Child Health USA 2011: U.S. Department of Health and Human Services Health Resources and Services Administration pot
Bạn đang xem bản rút gọn của tài liệu. Xem và tải ngay bản đầy đủ của tài liệu tại đây (4.67 MB, 80 trang )
Child
Health
USA
2011
September 2011
U.S. Department of Health and Human Services
Health Resources and Services Administration
Child Health USA 2011 is not copyrighted. Readers are free to duplicate and use all or part of the
information contained in this publication; however, the photographs are copyrighted and permis-
sion may be required to reproduce them. It is available online: www.mchb.hrsa.gov
Suggested Citation: U.S. Department of Health and Human Services, Health Resources and
Services Administration, Maternal and Child Health Bureau. Child Health USA 2011.
Rockville, Maryland: U.S. Department of Health and Human Services, 2011.
Single copies of this publication are also available at no cost from:
HRSA Information Center
P.O. Box 2910
Merrield, VA 22116
1-888-ASK-HRSA or
CHILD HEALTH USA 2011 CONTENTS 3
PREFACE 4
INTRODUCTION 5
POPULATION CHARACTERISTICS 8
Population of Children 9
Children in Poverty 10
Children of Foreign-Born Parents 11
Adopted Children 12
Rural and Urban Children 13
Education 14
Homeless and Sheltered Families 16
Child-Family Connectedness 17
Maternal Age 18
Working Mothers and Child Care 19
HEALTH STATUS 20
Health Status-Infants
Low Birth Weight 22
Very Low Birth Weight 23
Preterm Birth 24
Breastfeeding 25
Infant Mortality 26
Neonatal and Postneonatal Mortality 27
International Infant Mortality 28
Maternal Mortality 29
Health Status-Children
Vaccine-Preventable Diseases 31
Pediatric HIV and AIDS 32
Hospitalization 33
Chronic Health Conditions 34
Abuse and Neglect 35
Child Mortality 36
Health Status-Adolescents
Sexual Activity and Education 38
Adolescent Childbearing 39
Sexually Transmitted Infections 40
Adolescent and Young Adult HIV and AIDS 41
Physical Activity 42
Sedentary Behaviors 44
Overweight and Obesity 45
Mental Health 46
Suicide 47
Violence 48
Bullying 49
Social Skills 50
Cigarette Smoking 51
Substance Abuse 52
Adolescent Mortality 53
HEALTH SERVICES FINANCING
AND UTILIZATION 54
Health Care Financing 55
Levels of Insurance 56
Vaccination Coverage 57
Vaccination Schedule 58
Health Care Financing for CSHCN 59
Mental Health Treatment 60
Dental Care 61
Well-Child Visits 62
Health Care Visits 63
Usual Place for Sick Care 64
Medical Home 65
Emergency Department Utilization 66
Prenatal Care 67
STATE DATA 68
CHIP Enrollment 69
Medicaid Enrollment and Utilization 70
Health Insurance Status of Children 71
Health Insurance Status Map 72
Birth Outcomes 73
Infant and Neonatal Mortality 74
CITY DATA 75
Birth Weight 76
Infant Mortality 77
REFERENCES 78
CONTRIBUTORS 80
CHILD HEALTH USA 20114
PREFACE AND READER’S GUIDE
e Health Resources and Services Admin-
istration’s Maternal and Child Health Bureau
(MCHB) is pleased to present Child Health
USA 2011, the 21st annual report on the health
status and service needs of America’s children.
MCHB envisions a Nation in which the right
to grow to one’s full potential is universally as-
sured through attention to the comprehensive
physical, psychological, and social needs of the
maternal and child population. To assess the
progress toward achieving this vision, MCHB
has compiled this book of secondary data for
more than 50 health status and health care in-
dicators. It provides both graphical and textual
summaries of relevant data, and addresses long-
term trends where applicable and feasible.
All of the data discussed within the text of
Child Health USA are from the same sources as
the information in the corresponding graphs,
unless otherwise noted. Data are presented for
the target population of the Title V Maternal
and Child Health Block Grant: infants, chil-
dren, adolescents, children with special health
care needs, and women of childbearing age.
Child Health USA 2011 addresses health status
and health services utilization within this popu-
lation, and oers insight into the Nation’s prog-
ress toward the goals set out in the MCHB’s
strategic plan—to assure quality of care, elimi-
nate barriers and health disparities, promote an
environment that supports maternal and child
health, and improve the health infrastructure
and system of care for women, infants, children,
and families.
Child Health USA is designed to provide the
most current data available for public health
professionals and other individuals in the public
and private sectors. e book’s succinct format
is intended to facilitate the use of the informa-
tion as a snapshot of children’s health in the
United States.
Population Characteristics is the rst section
and presents statistics on factors that inuence
the well-being of children, including poverty,
education, and child care. e second section,
entitled Health Status, contains vital statistics
and health behavior data for the maternal and
child population. Health Services Financing
and Utilization, the third section, includes data
regarding health care nancing and utilization
of selected health services. e nal sections,
State Data and City Data, contain information
on selected indicators at those levels.
Child Health USA is not copyrighted and
readers may duplicate and use all of the infor-
mation contained herein; however, the photo-
graphs are copyrighted and permission may be
required to reproduce. is and all editions of
Child Health USA since 1999 are available on-
line at />childhealthusa.html.
For a complimentary copy of this publica-
tion, mail your request to HRSA Information
Center, P.O. Box 2910, Merrield, VA 22116.
You may also call 1-888-ASK-HRSA or email
CHILD HEALTH USA 2011 5
INTRODUCTION
e health of the child population is reec-
tive of the overall health of a Nation, and has
many implications for the Nation’s future as
these children grow into adults. Physical, men-
tal, and emotional health aect virtually every
facet of life, such as learning, participation in
leisure activities, and employment. Health
habits established in childhood often continue
throughout the lifespan, and many health prob-
lems in childhood, such as obesity and poor oral
health, inuence health into adulthood. Eec-
tive policies and programs are important to the
establishment of healthy habits and the miti-
gation of risk factors for disease. However, the
health and health care needs of children change
over time, and current data on these issues is
critically important as policy makers and pro-
gram planners seek to maximize the health of
children, now and into the future.
In 2010, nearly 25 percent of the U.S. pop-
ulation was under 18 years of age. e racial
and ethnic composition of the child popula-
tion is shifting, with a growing population of
Hispanics and a decline in the representation
of non-Hispanic Whites. In addition to race
and ethnicity, the demographic composition of
a population can also be characterized by fac-
tors such as nativity, poverty, and geographic
location. In 2009, 21.9 percent of children in
the United States had at least one foreign-born
parent. Of all children, 18.9 percent were U.S
born with a foreign-born parent or parents, and
3.0 percent were themselves foreign-born. In
the same year, over 15 million children under
18 years of age lived in households with in-
comes below 100 percent of the U.S. Census
Bureau’s poverty threshold ($21,954 for a fam-
ily of four in 2009), representing 20.7 percent
of all children in the United States. Dierences
in health risks have also been observed for chil-
dren by geographic location. In 2007, about 82
percent of children lived in urban areas while
18 percent lived in either large or small/isolated
rural areas. Children in rural areas—particularly
those in small or isolated rural communities –
were more likely to be overweight or obese than
children living in urban areas.
Good health begins before birth. Timely pre-
natal care is an important preventive strategy
that can help protect the health of both mother
and child. In 2008, 71.0 percent of women be-
gan prenatal care during the rst trimester (ac-
cording to data from areas using the “revised”
birth certicate (For more information, please
see page 67). A small proportion of women (7.0
percent) did not receive prenatal care until the
third trimester, or did not receive any at all.
Following birth, there are a variety of pre-
ventive or protective factors that can aect a
child’s health. Vaccination is a preventive health
measure that begins immediately after birth and
protects into adulthood. Vaccines are available
for a number of public health threats, includ-
ing measles, mumps, rubella (German measles),
polio, diphtheria, tetanus, pertussis (whoop-
ing cough), hepatitis B, and varicella (chicken
pox). In 2009, 70.5 percent of children 19–35
months of age received this recommended se-
ries of vaccines. is estimate excludes receipt of
the Haemophilus inuenza type b vaccine (Hib)
which has been presented in previous editions
of Child Health USA. For more information,
please see page 57.
Breastfeeding is also an important protective
factor, and rates have increased steadily since
the beginning of the last decade. In 2007, 75.5
percent of children through age 5 had been
breastfed for some period of time. Although
recommended by the American Academy of
Pediatrics, only 12.4 percent of children were
breastfed exclusively (without supplemental
food or liquids) for the rst 6 months of life.
Exclusive breastfeeding through the rst 6
months of life was more common among older
mothers and mothers with more than a high
school level education.
Family and neighborhood characteristics can
also play a role in the health and well-being of
children. In 2009, 71.4 percent of women with
children under 18 years of age were in the labor
force (either employed or looking for work).
Mothers with children under 6 years of age were
CHILD HEALTH USA 2011INTRODUCTION6
less likely to be in the labor force (64.2 percent).
In 2007, 54.2 percent of children from birth
through age 5 were in child care for 10 or more
hours per week, but not all families were able to
secure needed child care: nearly 20 percent of
families who did not receive 10 or more hours of
child care per week reported that they needed it.
Family activities and parent-child relationships
can aect health and well-being, and in 2007,
nearly 70 percent of parents with children aged
6-17 years reported that they could share ideas
or talk about things that really matter with their
children. e proportion of parents reporting
that they could share ideas and have meaning-
ful conversations with their child was higher
among those with children aged 6-11 years than
those with children aged 12-17 years.
Physical activity is another factor that can af-
fect health through the lifespan. Results from
the Youth Risk Behavior Surveillance System
show that 18.4 percent of high school students
met currently recommended levels of physical
activity in 2009 (one hour or more of physical
activity every day, most of which should be mod-
erate- to vigorous-intensity aerobic activity).
Nearly one-quarter of students did not partici-
pate in 60 or more minutes of physical activity
on any day in the preceding week. Participation
in physical activity can be adversely impacted by
in media use—or “screen time”. e American
Academy of Pediatrics recommends that parents
limit children’s daily use of media to 1-2 hours
per day. Yet, in 2007, 12.8 percent of pre-school
aged children and 10.8 percent of children aged
6-17 years engaged in 4 or more hours of media
use on an average weekday, including watching
TV or videos or playing video games.
Child Health USA also presents information
on risk factors for adverse health outcomes.
According to preliminary data, 8.2 percent of
infants were born low birth weight (less than
2,500 grams or 5 pounds 8 ounces) in 2009,
and 1.5 percent of infants were born very
low birth weight (less than 1,500 grams, or 3
pounds 4 ounces). Children born underweight
are more likely to suer from long-term dis-
ability and have higher rates of mortality than
children born of normal weight.
Violence and neglect are also risk factors for
poor health, and in 2009, investigations de-
termined that an estimated 702,000 children
were victims of abuse or neglect, equaling a
victimization rate of 9.3 per 1,000 children in
the population. Victimization rates were high-
est among young children. Among older chil-
dren, peer violence is also of concern. In 2009,
11.1 percent of high school students reported
that they had been in a physical ght on school
property in the prior 12 months and 9.8 per-
cent reported that they had experienced dating
violence—having been hit, slapped or physical-
ly hurt on purpose—at the hands of a boyfriend
or girlfriend.
Information on the prevalence of various dis-
eases and conditions in childhood is also impor-
tant in the eort to improve health in the child
population. For instance, obesity is a serious
health concern for children—obese children
are more likely to have risk factors for cardio-
vascular disease, such as high blood pressure,
high cholesterol, and Type 2 diabetes. Obese
children are also at increased risk of obesity
in adulthood, which is associated with a host
of serious health consequences. In 2007, 15.3
percent of children aged 10–17 years were over-
weight and 16.4 percent were obese, based on
parent-reported height and weight.
HIV/AIDS and other sexually transmitted
infections (STIs) are also of concern. In 2009,
an estimated 166 children younger than 13
years of age and an estimated 8,294 people aged
13–24 years were diagnosed with HIV. Chla-
mydia continues to be the most common STI
among adolescents and young adults. Based
on the number of cases reported to the Cen-
ters for Disease Control and Prevention, there
were 2,000 chlamydial infections per 100,000
adolescents and 2,165 infections per 100,000
young adults in 2009. Rates of gonorrhea were
405 and 479 per 100,000 adolescents and
young adults, respectively.
In 2009, there were nearly 3.1 million hos-
pital discharges among people aged 1–21 years.
CHILD HEALTH USA 2011 INTRODUCTION 7
While injuries are the leading cause of death
among this age group, they were not the most
common cause of hospitalization. In 2009, dis-
eases of the respiratory system were the most
common cause of hospitalization among chil-
dren aged 1–4 and 5–9 years, while mental
disorders were the most common cause of hos-
pitalization among children aged 10–14 years,
and pregnancy and childbirth was the most
common cause of hospitalization for adoles-
cents aged 15–19 years and young adults aged
20–21 years.
Depression and suicide remain critical pub-
lic health challenges for the adolescent popula-
tion, in particular. In 2009, 2.0 million adoles-
cents—or 8.1 percent of children aged 12-17
years—experienced at least one major depressive
episode (MDE). Occurrence of MDE was sig-
nicantly higher among females (11.7 percent).
In the same year, data from the Youth Risk Be-
havior Surveillance System found that 13.8 per-
cent of all high school students had considered
attempting suicide in past 12 months while 6.3
percent reported at least one suicide attempt
during the same period.
e health status and health services utiliza-
tion indicators reported in Child Health USA
can help policymakers and public health o-
cials better understand current trends in pediat-
ric health and wellness and determine what pro-
grams might be needed to further improve the
public’s health. ese indicators can also help
identify positive health outcomes which may
allow public health professionals to draw upon
the experiences of programs that have achieved
success. e health of our children and adoles-
cents relies on eective public health eorts that
include providing access to knowledge, skills,
and tools; providing drug-free alternative activi-
ties; identifying risk factors and linking people
to appropriate services; building community
supports; and supporting approaches that pro-
mote policy change, as needed. Such preventive
eorts and health promotion activities are vital
to the continued improvement of the health and
well-being of America’s children and families.
CHILD HEALTH USA 20118
POPULATION
CHARACTERISTICS
e increasing diversity of the United States
population is reected in the sociodemographic
characteristics of children and their families.
e percentage of children who are Hispanic
has more than doubled since 1980, while the
percentage who are non-Hispanic White has de-
clined. e percentage of children who are Black
has remained relatively stable. is reects the
changes in the racial and ethnic makeup of the
population as a whole.
At the national, State, and local levels, poli-
cymakers use population information to address
health-related issues that aect mothers, chil-
dren, and families. By carefully analyzing and
comparing available data, public health profes-
sionals can often identify high-risk populations
that could benet from specic interventions.
is section presents data on several popula-
tion characteristics that inuence maternal and
child health program development and evalu-
ation. Included are data on the age and racial
and ethnic distribution of the U.S. population,
as well as data on the poverty status of children
and their families, child care arrangements, and
education.
CHILD HEALTH USA 2011 POPULATION CHARACTERISTICS 9
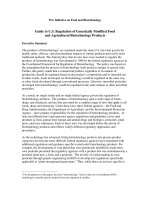
POPULATION OF CHILDREN
In 2009, there were more than 74 million
children under 18 years of age in the United
States, representing nearly 25 percent of the
population. Young adults aged 18–24 years
made up another 9.9 percent of the population,
while adults aged 25–64 years composed 52.9
percent of the population, and adults aged 65
years and older composed 12.9 percent.
e age distribution of the population has
shifted signicantly in the past several decades.
e percentage of the population that is un-
der 18 fell from 28.2 percent in 1980 to 24.3
percent in 2009. e representation of young
adults (aged 18–24 years) has also declined,
from 13.3 percent to 9.9 percent. During this
time period, the percentage of the population
that is aged 25–64 years increased from 47.3
percent to 52.9 percent, and the percentage that
is over 65 years increased from 11.3 percent to
12.9 percent. e median age in the United
States has increased from 30.0 years in 1980 to
36.8 years in 2009 (data not shown).
e shifting racial/ethnic makeup of the
child population (under 18 years) reects
the increasing diversity of the population as a
whole. Hispanic children represented less than 9
percent of children in 1980, compared to more
than 22 percent in 2009, while the percentage
of children who are Black remained relatively
steady over the same period, around 15 percent.
However, the percentage of children who are
non-Hispanic White fell signicantly, from
74.3 percent in 1980 to 55.3 percent in 2009.
Changes in the ways that racial and ethnic data
were collected after 2000 limit comparison over
time for some groups, including Asians and
Native Hawaiians and Other Pacic Islanders,
and individuals of more than one race.
Population of Children Under Age 18, by Race/Ethnicity, 1980 and 2009
Source (I.1): U.S. Census Bureau, Annual Population Estimates
U.S. Population, by Age Group, 1980 and 2009
Source (I.1): U.S. Census Bureau, Annual Population Estimates
10
20
30
40
50
60
70
80
Two or
More
Races*
†
Native Hawaiian
or Other
Pacific Islander*
†
Asian*
†
American Indian/
Alaska Native*
HispanicNon-Hispanic
Black
Non-Hispanic
White
*May include Hispanics.
†
1980 data are not available.
Percent of Children
55.3
15.1
22.5
1.3
4.4
3.3
0.2
0.9
8.7
14.8
74.3
1980
2009
1980 2009
Under 5 Years
7.2%
5-13 Years
13.8%
14-17 Years
7.2%
18-24 Years
13.3%
25-64 Years
47.3%
Under 5 Years
6.9%
5-13 Years
11.9%
25-64 Years
52.9%
14-17 Years
5.5%
18-24 Years
9.9%
65 Years
and Older
11.3%
65 Years
and Older
12.9%
CHILD HEALTH USA 2011POPULATION CHARACTERISTICS10
CHILDREN IN POVERTY
In 2009, more than 15 million children
under 18 years of age lived in households
with incomes below 100 percent of the U.S.
Census Bureau’s poverty threshold ($21,954
for a family of four in 2009); this represents
20.7 percent of all children in the United
States. Poverty aects many aspects of a child’s
life, including living conditions, nutrition,
and access to health care. A number of factors
aect poverty status, and signicant racial/
ethnic disparities exist. In 2009, 35.7 percent
of non-Hispanic Black children, 34.0 percent of
non-Hispanic American Indian/Alaska Native
children, and 33.1 percent of Hispanic children
lived in households with incomes below 100
percent of the poverty threshold, compared to
11.9 percent of non-Hispanic White children.
Single-parent families are particularly
vulnerable to poverty. In 2009, 44.3 percent of
children living in a female-headed household
experienced poverty, as did 26.5 percent of
children living in a male-headed household.
Only 11.1 percent of children living in married-
couple families lived in poverty (data not
shown). e proportion of children living in
poverty varies by age and family type. In 2009,
54.3 percent of children under 5 years of age
living in female-headed households lived in
poverty, while the same was true of 39.5 percent
of children aged 6–17 years.
A number of Federal programs work to
protect the health and well-being of children
living in low-income families. One of these is the
National School Lunch Program, administered
by the U.S. Department of Agriculture’s Food
and Nutrition Service. e program provides
nutritionally-balanced low-cost or free lunches
to children based on income. In 2009, the
program served free lunch to 16.3 million
children and reduced-price lunch to another 3.2
million children. is represents 62.5 percent of
all lunches served in participating schools.
1
1 U.S. Department of Agriculture, Food and Nutrition
Service. Child nutrition tables: National Level Annual
Summary Tables. Available online: yra-
midforkids.gov/pd/cnpmain.htm. Accessed March 2011.
Children Under Age 18 Living in Households with Incomes Below
100 Percent of the Poverty Threshold,* by Race/Ethnicity, 2009
Source (I.2): U.S. Census Bureau, Current Population Survey, Annual Social and Economic
Supplement
Percent of Children
*The U.S. Census Bureau uses a set of money income thresholds to determine
who is in poverty; the poverty threshold for a family of four was $21,954 in 2009.
Children Under Age 18 Living in Families* with Incomes
Below 100 Percent of the Poverty Threshold,** by Age and
Family Type, 2009
Source (I.2): U.S. Census Bureau, Current Population Survey, Annual Social and
Economic Supplement
*Includes only children who are related to the head of household by birth, marriage, or adoption.
**The U.S. Census Bureau uses a set of money income thresholds to determine who is in
poverty; the poverty threshold for a family of four was $21,954 in 2009.
10
20
30
40
50
60
Male Householder,
no Wife Present
Female
Householder,
no Husband Present
Married-Couple
Families
Total
Percent of Children
23.8
18.2
13.4
9.8
54.3
39.5
29.4
24.9
Under 5
Years
6-17
Years
10
20
30
40
50
60
Non-Hispanic
Two or
More Races
Non-Hispanic
Native Hawaiian/
Other
Pacific Islander
Non-
Hispanic
Asian
Non-Hispanic
American Indian/
Alaska Native
HispanicNon-Hispanic
Black
Non-Hispanic
White
Total
20.7
26.0
24.0
11.9
14.2
35.7
33.1
34.0
CHILD HEALTH USA 2011 POPULATION CHARACTERISTICS 11
CHILDREN OF FOREIGN-BORN
PARENTS
e foreign-born population in the United
States has increased substantially since the 1970s,
largely due to immigration from Asia and Latin
America. In 2009, 21.9 percent of children
in the United States had at least one foreign-
born parent. Of all children, 18.9 percent were
U.S born with a foreign-born parent or parents,
and 3.0 percent were themselves foreign-born.
Most children (73.8 percent) were native-born
with native-born parents.
Children’s poverty status varies with their
nativity. In 2009, foreign-born children with
foreign-born parents were most likely to live in
poverty, with 32.7 percent living in households
with incomes below 100 percent of the U.S.
Census Bureau’s poverty threshold ($21,954
for a family of four in 2009). Another 29.0 per-
cent of these children lived in households with
family incomes of 100–199 percent of the pov-
erty threshold. Native-born children with na-
tive parents were the least likely to experience
poverty, with 16.4 percent living in households
with incomes below 100 percent of the poverty
threshold, and another 19.4 percent living in
households with incomes of 100–199 percent
of the poverty threshold.
A number of other sociodemographic fac-
tors vary by the nativity of children and their
parents. For instance, native-born children with
native parents were most likely to have health
insurance in 2009 (92.8 percent), while foreign-
born children with foreign-born parents were
least likely (66.3 percent). Almost 87 percent
of native-born children with foreign-born par-
ents had health insurance in 2009 (data not
shown).
Children Under Age 18, by Nativity of Child and Parent(s)* and
Poverty,** 2009
Source (I.3): U.S. Census Bureau, Current Population Survey, Annual Social and Economic
Supplement
*“Native parent” indicates that both of the child’s parents were U.S. citizens at birth, “foreign-born parent” indicates
that one or both parents were born outside of the United States. **The U.S. Census Bureau uses a set of money
income thresholds to determine who is in poverty; the poverty threshold for a family of four was $21,954 in 2009.
*“Native parent” indicates that both of the child’s parents were U.S. citizens at birth, “foreign-born parent” indicates
that one or both parents were born outside of the United States, and “other” includes children with parents whose
native status is unknown and foreign-born children with native parents.
Children Under Age 18, by Nativity of Child and Parent(s),* 2009
Source (I.3): U.S. Census Bureau, Current Population Survey, Annual Social and Economic
Supplement
32.7 38.3 29.0
16.4 64.119.4
23.8 28.0 48.2
20 40 60 80 100
Foreign-Born
Child and Parent
Native Child,
Foreign-Born Parent
Native Child
and Parent
Below 100%
of Poverty
100–199%
of Poverty
200% of Poverty
and Above
Percent of Children
Native Child,
Foreign-Born Parent
18.9%
Foreign-Born Child
and Parent
3.0%
Other 4.3%
Native Child and Parent
73.8%
CHILD HEALTH USA 2011POPULATION CHARACTERISTICS12
ADOPTED CHILDREN
In 2007, there were approximately 1.8
million adopted children living in the United
States. Of all adopted children, 38 percent were
placed with families through private domestic
adoption, meaning the child was voluntarily
placed for adoption by his or her biological
parents. Another 37 percent of adopted children
were placed with their families through foster
care adoption, and the remaining 25 percent of
adopted children came to their families through
international adoption (data not shown).
Overall, the sex distribution of adopted
children is about even, but this varies by
adoption type. Only one-third of children
adopted internationally are male (33 percent)
compared to 57 percent of children adopted
from foster care and 51 percent of children
adopted privately in the U.S. e racial/ethnic
distribution of adopted children also varies
across adoption types, with private adoptions
most likely to involve non-Hispanic White
children and international adoptions most likely
to involve Asian children (data not shown).
e majority of adopted children, 85 percent,
were reported by their parents to be in “excellent”
or “very good” health; however, nearly 40
percent of adopted children have special health
care needs. Children with special health care
needs are those who have or are at increased
risk for a chronic physical, developmental,
behavioral, or emotional condition and who
also require health and related services of a type
or amount beyond that required by children
generally.
1
Children adopted from foster care
are more likely to have a special health care need
(54 percent) compared to children adopted
privately from the United States (32 percent) or
internationally (29 percent).
1 McPherson M, Arango P, Fox H, Lauver C, McManus
M, Newacheck P, Perrin J, Shonko J, Strickland B. A
new denition of children with special health care needs.
Pediatrics, 102(1):137–140, 1998.
Adopted Children,* by Adoption Type and Selected Health Status
Indicators,** 2007
Source (I.4): Oce of the Assistant Secretary for Planning and Evaluation and the Administration
for Children and Families, National Survey of Adoptive Parents
Adopted Children,* by Adoption Type and Sex,** 2007
Source (I.4): Oce of the Assistant Secretary for Planning and Evaluation and the
Administration for Children and Families, National Survey of Adoptive Parents
*Adopted children were defined as those with at least one adoptive parent, but no biological parents, in the
household. **Published analyses of this data source round all estimates to the nearest whole number.
Percent of Children
Percent of Children
International
25%
*Adopted children were defined as those with at least one adoptive parent, but no biological parents, in
the household. **Published analyses of this data source round all estimates to the nearest whole number.
20
40
60
80
100
InternationalPrivate DomesticFoster CareAll Adopted Children
20
40
60
80
100
InternationalPrivate DomesticFoster CareAll Adopted Children
Male
Female
49
51 51
49
57
43
33
67
93
29
Health Status is excellent or very good
Special Health Care Needs
85
81
39
54
84
32
RURAL AND URBAN CHILDREN
e health risks facing children often vary by
geographic location. For instance, children living
in rural areas are more vulnerable to death from
injuries,
1
and are more likely to use tobacco than
their urban counterparts.
2
Rural families may also
not have the same access to health care because
health services are not always located nearby.
3
Understanding these potential risks can provide
program planners and policymakers information
that can be used to design and target services.
In 2007, 81.7 percent of children lived in
urban areas, while about 9 percent lived in large
and small/isolated rural areas, respectively (data
not shown). ese areas were classied based on
zip code, the size of the city or town, and the
commuting pattern in the area. Urban areas
include metropolitan areas and surrounding
towns, large rural areas include towns with
populations of 10,000 to 49,999 persons and
their surrounding areas, and small/isolated rural
areas include towns with populations of 2,500 to
9,999 persons and their surrounding areas.
Rural and urban children did not dier in
the proportion who were insured; however,
rural children were more likely to have public
insurance (38.3 percent among those in small/
isolated rural areas and 35.6 percent in large
rural areas) compared to urban children (27.2
percent). While the majority of children had a
preventive physical or oral health visit in the past
CHILD HEALTH USA 2011 POPULATION CHARACTERISTICS 13
year (88.5 percent), children in both large and
small/isolated rural communities were slightly
less likely to have had either such visit compared
to their urban counterparts (data not shown).
Rural and urban children did not dier in
their overall physical and oral health status;
however, dierences were found for specic
health indicators by location. Children aged 10-
17 years in small/isolated rural areas were more
likely to be overweight or obese than children in
urban areas (35.2 versus 30.9 percent) and were
also more likely to spend more than 1 hour per
weekday watching TV or videos or playing video
games than urban children of the same age (55.3
versus 50.9 percent). However, children in small/
isolated rural areas were more likely to engage in
physical activity everyday (28.9 percent) than
those in urban (24.6 percent) or large rural areas
(23.3 percent) and also had a higher rate of daily
shared family meals than children living in urban
areas (40.7 percent versus 35.0 percent).
1 Cherry DC, Huggins B, Gilmore K. Children’s health in the
rural environment. Pediatric Clinics of North America 54
(2007):121-133.
2 Johnston LD, O’Malley PM, Bachman JG, Schulenberg JE.
(2009) Monitoring the Future: National Survey Results on
Drug Use, 1975-2008. (NIH Publication No. 09-7402.)
Bethesda, MD: National Institute on Drug Abuse.
3 Probst JC, Laditka SH, Wang J-Y, Johnson AO. Eects of
residence and race on burden of travel for care: cross sec-
tional analysis of the 2001 US National Household Travel
Survey. BMC Health Serv Res 2007 Mar 9;7-40.
Selected Indicators Among Children Aged 10-17, by Location,* 2007
Source (I.5): Health Resources and Services Administration, Maternal and Child Health Bureau and Centers for Disease
Control and Prevention, National Center for Health Statistics, National Survey of Children’s Health.
Percent of Children
10
20
30
40
50
60
Shared Family Meal
Every Day (past week)
More than 1 Hour of
Media Use per Weekday
Physical Activity Every Day
(past week)
Overweight or Obese
Total
30.9
31.6
23.3
24.9
34.6
51.6
54.2
50.9
24.6
35.2
28.9
55.3
35.0
35.9
38.7
40.7
Large Rural
Urban
Small/Isolated Rural
*Urban areas include metropolitan areas and surrounding towns, large rural areas include towns with populations of 10,000 to 49,999 persons
and their surrounding areas, and small/isolated rural areas include towns with populations of 2,500 to 9,999 persons and their
surrounding areas.
CHILD HEALTH USA 2011POPULATION CHARACTERISTICS14
EDUCATION
In 2008, there were nearly 3.3 million high
school status dropouts in the United States,
representing a “status dropout” rate of 8.0
percent. Status dropout refers to those 16–24
years of age who are not enrolled in school
and have not earned high school credentials
(diploma or equivalent). is rate has declined
steadily over the past several decades, with a
decrease of 43 percent since 1980 (when the
rate was 14.1 percent).
Historically, Hispanic students have had
the highest dropout rates among youth of all
racial/ethnic groups. Racial/ethnic dierences
in status dropout rates also vary by student sex
and nativity. In 2008, the status dropout rate
among Hispanics born in the United States
(10.8 percent) was much lower than the rate
for foreign-born Hispanics (34.6 percent; data
not shown). Overall, 10.4 percent of males
were status dropouts compared to 7.9 percent
of females. e highest rate observed was for
Hispanic males (21.9 percent).
Children are educated in a variety of settings,
including public and private schools and at
home. In 2007, the majority of all children
aged 5-17 years attending kindergarten through
12th grade were in public schools, including
70.6 percent who attended their assigned public
school and 15.0 percent who attended another
public school of choice. An additional 11.4
percent of students attended private schools
while 2.9 percent were homeschooled.
2
School
type and setting varied by race/ethnicity. A
higher proportion of Hispanic students were
enrolled in assigned public schools than non-
Hispanic Whites (74.6 versus 69.9 percent,
respectively); non-Hispanic Whites were also
less likely to be enrolled in a public school of
choice (12.0 percent) than non-Hispanic Blacks
(23.0 percent). Conversely, a higher proportion
of non-Hispanic White children attended
private school or were homeschooled.
2 Percentages may not sum to 100 due to rounding.
Students Aged 5-17 Years, by Race/Ethnicity and School Type or
Setting, 2007
Source (I.7): U.S. Department of Education, National Center for Education Statistics,
National Household Education Survey, Parent and Family Involvement in Education Survey
School Status Dropout* Rates Among Persons Aged 16–24 Years,
by Race/Ethnicity and Sex, 2008
Source (I.6): U.S. Census Bureau, American Community Survey
10
20
30
40
50
60
70
80
Non-
Hispanic
Two or
More
Races
Non-
Hispanic
American
Indian/
Alaska Native
Non-
Hispanic
NativeHawaiian/
Other Pacific
Islander
Non-
Hispanic
Asian
HispanicNon-
Hispanic
Black
Non-
Hispanic
White
Total
Percent of Population
Percent of Students
8.2
12.1
21.9
5.5
8.8
7.9
6.7
7.8
6.8
2.9
3.5
15.8
10.8
16.9
15.7
10.4
Male
Female
10
20
30
40
50
60
70
80
Non-
Hispanic
Other
HispanicNon-
Hispanic
Black
Non-
Hispanic
White
Total
Public Assigned Public Chosen Private Homeschooled
*Interpret with caution; coefficient of variation is >30 percent.
70.6
15.0
11.4
2.9
70.4
16.7
9.4
3.3
69.9
12.0
14.2
3.9
68.4
23.0
7.8
0.8*
74.6
17.5
6.3
1.5
*Status dropout refers to those 16-24 years of age who are not enrolled in school and have not earned
high school credentials (diploma or equivalent).
CHILD HEALTH USA 2011 POPULATION CHARACTERISTICS 15
CHILD HEALTH USA 2011POPULATION CHARACTERISTICS16
HOMELESS AND SHELTERED
FAMILIES
Children and youth are considered to be
homeless if they do not have a xed, regular,
and adequate nighttime residence. is includes
children living in shelters, transitional housing,
cars, campgrounds, motels and hotels, or sharing
housing with others due to loss of housing or eco-
nomic hardship.
1
e exact number of children
and adults who are homeless is not known, how-
ever, the US Department of Housing and Urban
Development (HUD) estimated that approxi-
mately 1.6 million people, or one in every 200
Americans, spent at least one night in emergency
shelter or transitional housing in 2009. Although
the majority of those in shelter are individuals,
persons in families – households with at least one
adult and one child – accounted for 34.1 percent
(or 535,477) of those using emergency shelters or
transitional housing. Between 2007 and 2009,
family homelessness (as reected by emergency
and transitional shelter use) increased approxi-
mately 30 percent while a decrease in the number
of individuals using shelter was observed during
the same period (data not shown).
2
Homeless families in emergency shelter or
transitional housing dier substantially from
homeless individuals. While sheltered individuals
are more likely to be male (72.7 percent), over the
age of 30 (75.2 percent), disabled (42.9 percent),
and of veteran-status (13.0 percent), the majority
of persons in sheltered families are female (79.6
percent), African American (47.9 percent), and
under the age of 31 (82.4 percent). Overall, 22.2
percent of all sheltered homeless persons are un-
der the age of 18, the majority of whom (52.6
percent) are under the age of 6 (data not shown).
e path into and out of emergency shelter
and transitional housing is also dierent for fam-
ilies and individuals. Among adults in families,
62.6 percent entered emergency shelter or transi-
tional housing from some other form of shelter,
including a rented or owned housing unit. e
same was true for only 36.6 percent of individu-
als, the majority of whom were already homeless
before seeking emergency shelter. Families are
also more likely to stay in shelter for longer peri-
ods of time than individuals. In 2009, the aver-
age number of nights spent in emergency shelter
among persons in families was 36 compared to
17 among individuals (data not shown).
1 National Coalition for the Homeless. Who is homeless?
Available at: />html. Accessed May 2011.
2 U.S. Department of Housing and Urban Development.
e 2009 Annual Homeless Assessment Report to Congress.
Available at: o/documents/5thHomel
essAssessmentReport.pdf. Accessed May 2011.
Sheltered Homeless Persons by Household Type and Age, 2009
Source (I.8): U.S. Department of Housing and Urban Development. Homeless
Management Information System.
Sheltered Homeless Persons by Household Type and Sex, 2009
Source (I.8): U.S. Department of Housing and Urban Development. Homeless
Management Information System.
Individuals Persons in Families
Females
27.3%
Males
72.7%
Females
79.6%
Males
20.4%
Individuals Persons in Families
18-30 Years
22.6%
31-50 Years
49.7%
Under 18 Years
2.2%
51-61 Years
21.3%
62 and Older
4.2%
18-30 Years
21.8%
31-50 Years
16.4%
Under 18 Years
60.6%
51-61 Years
1.1%
62 and Older
0.1%
CHILD HEALTH USA 2011 POPULATION CHARACTERISTICS 17
CHILD-FAMILY CONNECTEDNESS
Family activities can promote bonding and
help children lay the groundwork for future
health and well-being. Sharing meals is a bond-
ing activity that can also encourage good nutri-
tional habits. In 2007, 45.8 percent of children
under 18 years of age ate at least one meal every
day with all other members of their household
in the prior week while less than 5 percent of
children did not share at least one meal with all
the other members of their household. Sharing
of meals varied by family income, with 58.2
percent of children living in households with
incomes below 100 percent of the Federal pov-
erty level ($20,650 for a family of four in 2007)
sharing meals daily compared to 48.8 and 42.9
percent of children living in households with
incomes between 100-199 and 200-399 percent
of the Federal poverty level, respectively, sharing
daily family meals. Only 38.9 percent of chil-
dren with household incomes of 400 percent or
more of the Federal poverty level shared a meal
every day with all other members of their house-
hold in the prior week.
In 2007, the parents of nearly 70 percent of
children between the ages of 6 and 17 years re-
ported that they could share ideas or talk about
things that really matter very well with their chil-
dren. Less than one third of parents (27.1 per-
cent) reported that they could share ideas or talk
about things that really mattered only somewhat
well with their children and 3.1 percent reported
that they could not share or talk about important
issues well at all. is varied by age, with 75.4
percent of parents with children between the ages
of 6 and 11 years reporting that they could share
ideas and talk about important issues very well
and 64.5 percent of parents with children aged
12-17 reporting the same level of communica-
tion with their children.
Parents and Children Sharing Ideas and Meaningful Conversation,*
by Age, 2007
Source (I.8): Health Resources and Services Administration, Maternal and Child Health
Bureau and Centers for Disease Control and Prevention, National Center for Health
Statistics, National Survey of Children’s Health
Percent of Children
10
20
30
40
50
60
70
80
Not Very WellSomewhat WellVery Well
Total
75.4
64.5
69.8
27.1
31.3
22.6
2.0
*Based on parent report of how well they share ideas or talk about things that really matter with their children.
6-11 Years
12-17 Years
Frequency of Family Meals* Among Children, by Poverty,** 2007
Source (I.8): Health Resources and Services Administration, Maternal and Child Health
Bureau and Centers for Disease Control and Prevention, National Center for Health
Statistics, National Survey of Children’s Health
Percent of Children
10
20
30
40
50
60
70
80
400% or
more of Poverty
200-399%
of Poverty
100-199%
of Poverty
<100%
of Poverty
Total
0 Days
31.1
4.1
19.1
5.2
17.1
45.8
26.5
20.2
48.8
19.5
58.2
4.5
34.0
19.3
42.9
3.8
38.6
19.3
38.9
3.3
*Number of days that the child ate a meal with all other family members living in the household. **The U.S.
Department of Health and Human Services establishes poverty guidelines for determining financial
eligibility for Federal programs; the poverty level for a family of four was $20,650 in 2007.
4-6 Days
1-3 Days
Every Day
3.1
4.2
CHILD HEALTH USA 2011POPULATION CHARACTERISTICS18
MATERNAL AGE
According to preliminary data, the general
fertility rate fell slightly to 66.7 live births per
1,000 women aged 15–44 years in 2009 (from a
rate of 68.6 in 2008). Birth rates for nearly every
age and racial/ethnic group declined. e rate for
teenagers aged 15–19 years decreased to 39.1 per
1,000 females in this age group, which contin-
ues the general decline in teenage birthrates since
1991, when the rate was 61.8 births per 1,000.
Although the birth rate for women aged 25–29
years fell in 2009, this group still experienced the
highest birth rate of all age groups (110.5 births
per 1,000). Birth rates for women aged 35–39
years (46.6 births per 1,000) also declined slight-
ly (from 46.9 in 2008), representing the second
year of decline after increasing rates for three de-
cades. Birth rates for women aged 40–44 years
(10.1 births per 1,000) increased slightly over the
previous year.
1
Average age at rst birth rose 3.6
years between 1970 and 2006 to 25.0 years (the
latest year for which data are available; data not
shown).
2
e age distribution of births varies by race/
ethnicity. Among non-Hispanic Black, Hispanic,
and American Indian/Alaska Native women,
16.5 percent, 13.8 percent, and 17.3 percent of
births, respectively, were to females younger than
20 years of age, compared to 7.3 percent of births
to non-Hispanic White females. e percentage
of births to women aged 20–24 years was higher
among non-Hispanic Black and Hispanic wom-
en (31.8 percent and 27.5 percent, respectively)
than among non-Hispanic White women (22.2
percent). However, births to women aged 35 and
older represented a higher proportion of births
among non-Hispanic White and Asian/Pacic
Islander women than among non-Hispanic
Black and Hispanic women.
1 Hamilton BE, Martin JA, Ventura SJ. Births: Preliminary
data for 2009. National vital statistics reports; vol 59 no
3. National Center for Health Statistics. 2010.
2 Mathews TJ, Hamilton BE. Delayed childbearing: More
women are having their rst child later in life. NCHS
data brief, no 21. Hyattsville, MD: National Center for
Health Statistics. 2009
8
16
24
32
40
Asian or Pacific Islander**
†
American Indian/Alaska Native**HispanicNon-Hispanic BlackNon-Hispanic WhiteTotal
3.1
2.8
6.9
11.5
24.4
23.1
28.2
1.9
3.0
5.4
12.3
22.2
25.5
29.7
5.5
2.2
11.0
8.2
31.8
16.2
25.1
5.0
2.3
8.8
9.7
27.5
19.6
27.1
5.7
1.6
11.6
6.6
33.4
15.2
26.0
0.8
4.2
2.0
19.2
11.7
34.0
28.1
Distribution of Births, by Maternal Age and Race/Ethnicity, 2009*
Source (I.9): Centers for Disease Control and Prevention, National Center for Health Statistics, National Vital Statistics System
Percent of Births
*Preliminary data. **May include Hispanics.
†
Separate estimates were not available for Asians and Native Hawaiians and Other Pacific Islanders.
Under 18 Years
18-19 Years
30-34 Years
35-39 Years
20-24 Years
25-29 Years
40 Years and Older
CHILD HEALTH USA 2011 POPULATION CHARACTERISTICS 19
WORKING MOTHERS AND
CHILD CARE
In 2009, 71.4 percent of women with chil-
dren under 18 years of age were in the labor
force (either employed or looking for work), and
65.5 percent were employed (data not shown).
Among men, rates were 93.8 percent and 86.8
percent, respectively. Labor force participation
among women varied by a number of factors.
Of mothers with children aged birth through 5
years, 64.2 percent were in the labor force, while
among those whose youngest child was aged
6–17 years, 77.3 percent were in the labor force.
Employed mothers with children birth to age ve
were more likely to be employed part time than
mothers with older children (29.2 versus 24.2
percent, data not shown).
In 2007, 54.2 percent of children aged birth
through 5 years were in childcare for 10 or more
hours per week. Overall, 29.1 percent of children
were in the care of a non-relative, while 14.7 per-
cent were cared for by a relative and 10.4 per-
cent received both relative and non-relative care.
Childcare arrangements varied by race/ethnicity:
55.8 percent of Hispanic children did not receive
10 or more hours of childcare per week while the
same was true of 45.2 percent of non-Hispanic
White children and 32.0 percent of non-Hispan-
ic Black children. A greater proportion of both
non-Hispanic Black and Hispanic children re-
ceived 10 or more hours of childcare per week
from a relative (20.5 percent and 15.6 percent,
respectively) than non-Hispanic White children
(13.2 percent).
Securing childcare can be dicult for families.
In 2007, nearly 20 percent of families who did
not receive 10 or more hours of childcare per
week for their child reported that they needed
child care during the prior month. Families with
incomes of 400 percent or more of the Federal
poverty level ($20,650 for a family of four in
2007) were most likely to report needing care
(27.3 percent) compared to 16.9 percent of chil-
dren living in families with household incomes
under 100 percent of the Federal poverty level
(data not shown).
Childcare Arrangements* for Children Aged 0-5 Years, by
Race/Ethnicity, 2007
Source (I.5): Health Resources and Services Administration, Maternal and Child Health
Bureau and Centers for Disease Control and Prevention, National Center for Health
Statistics, National Survey of Children’s Health
Percent of Parents
20
40
60
80
100
Children Aged 6-17 YearsChildren Aged 0-5 YearsChildren Under 18
Fathers
93.8
95.1
64.2
71.4
77.3
92.7
*10 or more hours of childcare per week.
Mothers
Parents’ Labor Force* Participation Rate, by Age of
Youngest Child,** 2009
Source (I.10): U.S. Department of Labor, Bureau of Labor Statistics
Percent of Children
20
40
60
80
100
HispanicNon-Hispanic BlackNon-Hispanic WhiteTotal
45.8
10.4
29.1
9.2
45.2
14.7
32.9
32.0
32.4
13.2
17.7
55.8
20.5
10.8
15.6
14.5
*Includes people who are employed and those who are actively seeking work.
**Children include sons, daughters, step-children, and adopted children.
No Childcare
Relative Care
Non-Relative Care
Both Relative and Non-Relative Care
CHILD HEALTH USA 201120 HEALTH STATUS
HEALTH STATUS
Monitoring the health status of infants,
children, and adolescents allows health profes-
sionals, program planners, and policymakers
to assess the impact of past and current health
intervention and prevention programs and
identify areas of need within the child popula-
tion. Although indicators of child health and
well-being are often assessed on an annual basis,
some surveillance systems collect data at regular
intervals, such as every 2, 4, or 5 years. Trends
can be identied by examining and comparing
data from one data collection period to the next
whenever multiple years of data are available.
In the following section, mortality, disease,
injury, and health behavior indicators are
presented by age group. e health status
indicators in this section are based on vital
statistics and national surveys and surveillance
systems. Population-based samples are designed
to yield information that is representative of the
maternal and child populations that are aected
by, or in need of, specic health services or
interventions.
CHILD HEALTH USA 2011 HEALTH STATUS 21
HEALTH STATUS - INFANTS
CHILD HEALTH USA 2011HEALTH STATUS-INFANTS22
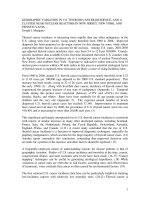
LOW BIRTH WEIGHT
Low birth weight is a leading cause of neonatal
mortality (death before 28 days of age). Low
birth weight infants are more likely to experience
physical and developmental health problems or
die during the rst year of life than are infants of
normal weight.
1,2
According to preliminary data, 8.2 percent
of infants were born low birth weight (less than
2,500 grams, or 5 pounds 8 ounces) in 2009.
In 2006, the rate of low birth weight was the
highest recorded in four decades (8.3 percent).
e increase in multiple births, which are at high
risk of low birth weight, strongly inuenced this
increase; however, rates of low birth weight also
rose for singleton births.
3
In 2009, the rate of low birth weight was much
higher among infants born to non-Hispanic
Black women (13.6 percent) than infants born to
mothers of other racial/ethnic groups. e second
highest rate, which occurred among Asian/Pacic
Islanders, was 8.3 percent, followed by a rate of
7.3 percent among American Indian/Alaska
Natives. Low birth weight occurred among 7.2
percent of infants born to non-Hispanic White
women, while infants of Hispanic women
experienced the lowest rate (6.9 percent). Low
birth weight levels in 2009 were not signicantly
dierent from 2008 for non-Hispanic White,
non-Hispanic Black, and Hispanic infants.
Low birth weight also varied by maternal
age. In 2008 (the latest year for which data are
available), the rate of low birth weight was highest
among babies born to women younger than 15
years of age (12.4 percent), followed by babies
born to women aged 40–54 years (11.8 percent).
e lowest rates occurred among babies born to
mothers aged 25–29 years and 30–34 years (7.4
and 7.6 percent, respectively; data not shown).
1 Stein REK, Siegel MJ, Bauman LJ. Are children of mod-
erately low birth weight at increased risk for poor health?
A new look at an old question. Pediatrics 2006;118:
217-223.
2 Matthews TJ, MacDorman MF. Infant mortality statistics
from the 2006 period linked birth/infant death data set.
National vital statistics reports; vol 58 no 17. Hyattsville,
MD: National Center for Health Statistics. 2010.
3 Martin JA, Hamilton BE, Sutton PD, Ventura SJ, et al.
Births: Final data for 2006. National vital statistics re-
ports; vol 57 no 7. Hyattsville, MD: National Center for
Health Statistics. 2009.
Low Birth Weight Among Infants, by Maternal Race/Ethnicity, 1990–2009*
Source (II.1): Centers for Disease Control and Prevention, National Center for Health Statistics, National Vital Statistics
System
13.6
8.2
8.3
7.3
6.9
Non-Hispanic Black
Non-Hispanic White
Percent of Infants
7.2
Asian/Pacific Islander**
American Indian/
Alaska Native
All Races
*Data for 2009 are preliminary. **Separate estimates for Asians and Native Hawaiians and Other Pacific Islanders were not available.
5
6
7
8
9
10
11
12
13
14
15
20092008200720062005200420032002200120001999199819971996199519941993199219911990
Hispanic
CHILD HEALTH USA 2011 HEALTH STATUS-INFANTS 23
VERY LOW BIRTH WEIGHT
According to preliminary data, 1.5 percent of
infants were born very low birth weight (less than
1,500 grams, or 3 pounds 4 ounces) in 2009. e
proportion of very low birth weight infants has
slowly climbed from just over 1 percent in 1980.
Infants born at such low weight are more than
100 times more likely to die in the rst year of life
than are infants of normal birth weight (above 5
pounds 8 ounces).
1
Very low birth weight infants
who survive are at a signicantly increased risk
of severe health and developmental problems,
including physical and sensory diculties, de-
velopmental delays, and cognitive impairment,
which may require increased levels of medical,
educational, and parental care.
2
Infants born to non-Hispanic Black women
are over two times more likely than infants born
to mothers of other racial/ethnic groups to be
very low birth weight. Among infants born to
non-Hispanic Black women, 3.1 percent were
very low birth weight in 2009, compared to 1.2
percent of infants born to non-Hispanic White
and Hispanic women, 1.3 percent born to Amer-
ican Indian/Alaska Native women, and 1.1 per-
cent born to Asian/Pacic Islander women. is
dierence is a major contributor to the disparity
in infant mortality rates between non-Hispanic
Black infants and infants of other racial/ethnic
groups.
3
Although, overall, the rate of very low
birth weight was not statistically dierent from
2008, rates for non-Hispanic White and non-
Hispanic Black newborns were down 2-3 percent
from 2006.
4
In 2008 (the latest year for which data are
available), the rate of very low birth weight was
highest among babies born to mothers aged 45-
54 years (3.6 percent). Mothers under 15 years of
age also had high rates of very low birth weight
(3.0 percent.) e rate was lowest among mothers
aged 25-29 years (1.3 percent; data not shown).
1 Matthews TJ, MacDorman MF. Infant mortality statistics
from the 2006 period linked birth/infant death data set.
National vital statistics reports; vol 58 no 17. Hyattsville,
MD: National Center for Health Statistics. 2010.
2 Eichenwald EC, Stark AR. Management and outcomes of
very low birth weight. N Engl J Med 2008;358:1700-1711.
3 Wise PH. e anatomy of a disparity in infant mortality.
Annu Rev Public Health. 2003;24:341-62.
4 Hamilton BE, Martin JA, Ventura SJ. Births: Preliminary
data for 2009. National vital statistics reports web release;
vol 59 no 3. Hyattsville, MD: National Center for Health
Statistics. 2010.
Very Low Birth Weight Among Infants, by Maternal Race/Ethnicity, 1990–2009*
Source (II.1): Centers for Disease Control and Prevention, National Center for Health Statistics, National Vital
Statistics System
3.1
1.2
1.1
1.3
1.5
Non-Hispanic
White
Non-Hispanic Black
Hispanic
Asian/Pacific Islander
Percent of Infants
American Indian/
Alaska Native
0.5
1.0
1.5
2.0
2.5
3.0
3.5
20092008200620042002200019981996199419921990
All Races
*Data for 2009 are preliminary. **Separate estimates for Asians and Native Hawaiians and Other Pacific Islanders were not available.
CHILD HEALTH USA 2011HEALTH STATUS – INFANTS24
PRETERM BIRTH
Babies born preterm, before 37 completed
weeks of gestation, are at increased risk of im-
mediate and long-term complications, as well as
mortality. Complications that can occur during
the newborn period include respiratory distress,
jaundice, anemia, and infection, while long-
term complications can include learning and
behavioral problems, cerebral palsy, lung prob-
lems, and vision and hearing loss. Although the
risk of complications is greatest among those
babies who are born the earliest, even those
babies born “late preterm” (34 to 36 weeks’ ges-
tation) are more likely than full-term babies to
experience these types of problems.
1
According to preliminary data, 12.2 percent
of infants were born preterm in 2009. Over-
all, 8.7 percent of babies were born at 34 to
36 weeks’ gestation, 1.6 percent were born at
32-33 weeks, and 2.0 percent were “very pre-
term” (less than 32 weeks). e preterm birth
rate increased more than 20 percent from 1990
to 2006, but has declined in the three years
since (data not shown).
e preterm birth rate varies by race/eth-
nicity. In 2009, 17.5 percent of babies born to
non-Hispanic Black women were born preterm,
compared to 10.8 percent of babies born to
Asian/Pacic Islander women. Among babies
born to non-Hispanic White women, 10.9
percent were born preterm, while the same was
true of 12.0 percent of babies born to Hispanic
women and 13.5 percent of babies born to
American Indian/Alaska native women.
1 Centers for Disease Control and Prevention, National
Center for Chronic Disease Prevention and Health Pro-
motion, Division of Reproductive Health. Prematurity.
November 2009. Available online: />Features/PrematureBirth/. Accessed March 2011.
Preterm Birth Among Infants, by Completed Weeks of
Gestation, 2009*
Source (II.1): Centers for Disease Control and Prevention, National Center for Health
Statistics, National Vital Statistics System
Preterm Birth Among Infants, by Maternal Race/Ethnicity, 2009*
Source (II.1):
Centers for Disease Control and Prevention, National Center for Health Statistics,
National Vital Statistics System
*Data for 2009 are preliminary
*Data for 2009 are preliminary. **Includes Hispanics.
†
Separate data for Asians and Native Hawaiians and
Other Pacific Islanders not available.
Percent of Infants
10.9
17.5
12.0
10.8
13.5
5
10
15
20
25
30
Asian/
Pacific Islander**
†
American Indian/
Alaska Native**
HispanicNon-Hispanic
Black
Non-Hispanic
White
Percent of IInfants
12.2
2.0
8.7
1.6
5
10
15
20
25
30
34-36 Weeks32-33 WeeksLess than 32 WeeksTotal
BREASTFEEDING
Breastfeeding has been shown to promote
the health and development of infants, includ-
ing their immunity to disease. It also confers a
number of maternal benets, such as a decreased
risk of breast and ovarian cancers.
1
e American
Academy of Pediatrics Section on Breastfeeding
recommends exclusive breastfeeding— with no
supplemental food or liquids— through the rst
6 months of life, and continued supplemental
breastfeeding through at least the rst year.
2
Breastfeeding practices vary considerably by a
number of factors including maternal age, ma-
ternal education, household income, and race/
ethnicity. In 2007, the parents of 75.5 percent of
children from birth to 5 years of age reported that
the child had ever been breastfed or fed breast
milk. While this represents a substantial increase
in breastfeeding initiation over the past 25 years,
the overall prevalence of any breastfeeding for 6
months and the prevalence of exclusive breast-
feeding for 6 months remain below national ob-
jectives.
3
Parents of 45.0 percent of children aged
6 months to 5 years reported that the child was
breastfed for 6 months. Exclusive breastfeeding
for 6 months was reported for 12.4 percent of
children aged 6 months to 5 years.
Children born to mothers aged 30 years or
older are the most likely to be breastfed (79.8
percent), while children born to mothers aged
20 years or younger are the least likely (58.5 per-
cent). A similar trend exists for exclusive breast-
feeding; 14.1 percent of children born to moth-
ers aged 30 years or older are exclusively breastfed
for 6 months compared to 4.6 percent of chil-
dren born to mothers aged 20 years or younger.
Mothers with more than a high school education
are more likely to both initiate breastfeeding and
to breastfeed for 6 months exclusively than those
with less than a high school education.
1 Ip S, Chung M, Raman G, Chew P, Magula N, DeVine
D, et al. Breastfeeding and maternal and infant health
outcomes in developed countries. Evid Rep Technol As-
sess (Full Rep). 2007(153):1-186.
2 Gartner LM, Morton J, Lawrence RA, Naylor AJ, O’Hare
D, Schanler RJ, et al. Breastfeeding and the use of human
milk. Pediatrics. 2005;115(2):496-506.
3 U.S. Department of Health and Human Services. Healthy
People 2020. Available at: www.healthypeople.gov.
Accessed March 2011.
CHILD HEALTH USA 2011 HEALTH STATUS-INFANTS 25
Breastfeeding Among Children Aged 0-5 Years, by Maternal Age
and Duration, 2007
Source (II.2): Health Resources and Services Administration, Maternal and Child Health
Bureau and Centers for Disease Control and Prevention, National Center for Health
Statistics, National Survey of Children’s Health
Percent of Infants
20
40
60
80
100
30 Years or Older21-29 Years20 Years or YoungerTotal
20
40
60
80
100
More than
High School
High SchoolLess than
High School
Total
*Ever fed breast milk. **Exclusive breastfeeding is defined as only human breastmilk—no solids, water, or
other liquids.
†
Data is for infants aged 6 months to 5 years. Those less than 6 months of age were excluded.
Breastfeeding Among Children Aged 0-5 Years, by Maternal
Education and Duration, 2007
Source (II.2): Health Resources and Services Administration, Maternal and Child Health
Bureau and Centers for Disease Control and Prevention, National Center for Health
Statistics, National Survey of Children’s Health
Percent of Infants
*Ever fed breast milk **Exclusive breastfeeding is defined as only human breastmilk—no solids, water, or
other liquids.
†
Data is for infants aged 6 months to 5 years. Those less than 6 months of age were excluded.
75.5
45.0
12.4
68.1
10.4
37.8
67.9
9.2
33.4
81.7
14.4
52.3
75.5
22.2
4.6
58.5
12.4
45.0
76.5
12.3
44.4
79.8
14.1
51.2
Ever Breastfed*
Exclusively at 6 Months**
†
Any at 6 Months
†
Ever Breastfed*
Exclusively at 6 Months**
†
Any at 6 Months
†