Báo cáo khoa học: Enzymatic properties of the lactate dehydrogenase enzyme from Plasmodium falciparum pdf
Bạn đang xem bản rút gọn của tài liệu. Xem và tải ngay bản đầy đủ của tài liệu tại đây (424.27 KB, 11 trang )
Enzymatic properties of the lactate dehydrogenase
enzyme from Plasmodium falciparum
Deborah K. Shoemark
1
, Matthew J. Cliff
2
, Richard B. Sessions
1
and Anthony R. Clarke
1
1 Department of Biochemistry, University of Bristol, UK
2 Molecular Biology and Biotechnology Department, University of Sheffield, UK
The lactate dehydrogenase enzyme from the parasite
causing cerebral malaria, Plasmodium falciparum,is
currently the subject of efforts to find alternatives to
established drug regimens which suffer increasingly
from problems of resistance and side-effects [1]. This
enzyme (PfLDH) catalyses the final step in the glyco-
lytic pathway upon which the parasite relies during its
anaerobic erythrocytic stages of development within
the human host. The natural product gossypol, derived
from the cotton seed plant, is a known inhibitor of
dehydrogenases. Inhibition of PfLDH by gossypol
derivatives has proved parasiticidal in vitro [2] and the
search for specific inhibitors is underway [1,3]. The
enzyme PfLDH differs from the human isozymes in
several important structural and kinetic features,
among which is the possession of a five-residue inser-
tion in the substrate-specificity loop [4].
The fact that the enzyme has active-site properties
that differ substantially from those of human LDHs
implies that it might be possible to design selective
inhibitors that could preferentially target the parasitic
enzyme. However, it is a considerable advantage in
the selective targeting of an enzyme to have a firm
grounding in both the structural and functional char-
acteristics, the latter being useful in providing a basis
for quantifying the effects of inhibitors on the
enzyme. To elucidate its functional characteristics, we
have performed a mechanistic analysis using steady-
state kinetics, equilibrium binding measurements and
transient kinetic techniques. It has been hitherto
assumed that PfLDH follows the same kinetic mech-
anism as other LDHs. In these experiments, we
define the steady-state kinetic mechanism and associ-
ated rate constants in the forward and reverse direc-
tions, the coenzyme binding affinities and the nature
of the rate-limiting step. In addition, the effect of
the unusual loop structure on substrate specificity is
examined.
Keywords
kinetic; lactate dehydrogenase; malaria;
mechanism; Plasmodium falciparum
Correspondence
D. K. Shoemark, Department of
Biochemistry, School of Medical Sciences,
University Walk, Clifton, Bristol BS8 1TD,
UK
Fax: +44 117 9288274
Tel: +44 117 9288595
E-mail:
(Received 24 January 2007, revised 13
March 2007, accepted 23 March 2007)
doi:10.1111/j.1742-4658.2007.05808.x
The lactate dehydrogenase enzyme from Plasmodium falciparum (PfLDH)
is a target for antimalarial compounds owing to structural and functional
differences from the human isozymes. The plasmodial enzyme possesses a
five-residue insertion in the substrate-specificity loop and exhibits less
marked substrate inhibition than its mammalian counterparts. Here we
provide a comprehensive kinetic analysis of the enzyme by steady-state and
transient kinetic methods. The mechanism deduced by product inhibition
studies proves that PfLDH shares a common mechanism with the human
LDHs, that of an ordered sequential bireactant system with coenzyme
binding first. Transient kinetic analysis reveals that the major rate-limiting
step is the closure of the substrate-specificity loop prior to hydride transfer,
in line with other LDHs. The five-residue insertion in this loop markedly
increases substrate specificity compared with the human muscle and heart
isoforms.
Abbreviations
BsLDH, LDH enzyme from Bacillus stearothermophilus; FRET, fluorescence resonant energy transfer; LDH, lactate dehydrogenase; PfLDH,
LDH enzyme from Plasmodium falciparum; Tg LDH, LDH enzyme from Toxoplasma gondii.
2738 FEBS Journal 274 (2007) 2738–2748 ª 2007 The Authors Journal compilation ª 2007 FEBS
Results
Substrate inhibition
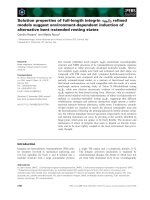
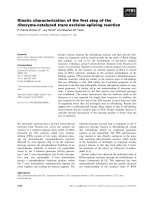
Figure 1 shows the k
cat
value taken from the initial
velocity of the reaction as a function of pyruvate
concentration and near-saturating levels of NADH
(k
cat
is used as it is independent of enzyme concentra-
tion). The fact that there is a reduction in velocity at
high concentrations of pyruvate shows that the
enzyme, in common with most lactate and malate de-
hydrogenases, is prone to substrate inhibition,
although the magnitude of the effect is small. The
data were fitted to Equation 1 (Experimental pro-
cedures) and reveal an inhibition constant (K
i
)of
140 ± 18 mm, an apparent K
M
for pyruvate of
69 ± 4 lm and a catalytic rate constant of 96 s
)1
.
This value of K
i
is high compared with that for
human muscle LDH (4 mm) and the human heart
enzyme (0.8 mm) [5].
Product inhibition and binding order in the
enzyme mechanism: determining the overall
steady-state mechanism
An extensive steady-state analysis of the PfLDH reac-
tion was performed to determine the basic mechanism,
the catalytic rate constants for the forward and reverse
reactions and K
M
values for pyruvate ⁄ lactate and
NADH ⁄ NAD
+
, respectively. Initially, a series of diag-
nostic steady-state experiments were designed to assign
the general kinetic mechanism. In these enzyme assays,
NADH and pyruvate were used as the substrates and
NAD
+
or lactate as product inhibitors. These studies
were performed to test whether PfLDH has the char-
acteristic mechanism for this class of dehydrogenases,
i.e. an ordered sequential binding system with NADH
binding before pyruvate. The manner in which prod-
ucts cause inhibition, i.e. competitive, mixed or uncom-
petitive under certain experimental conditions are
diagnostic of both the binding order and the extent
to which the system exhibits rapid-equilibrium charac-
teristics, i.e. whether off-rates are much faster than
turnover.
An initial set of four experiments used fixed, subsat-
urating concentrations of either substrate or cofactor
with varied concentrations of the other. The experi-
ments were performed at different, fixed concentrations
of either lactate or NAD
+
. A subsequent set of experi-
ments was performed to see if saturating conditions
could alleviate the effects on the apparent K
M
or k
cat
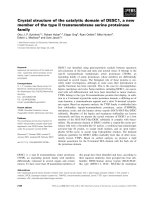
values. An example of data from a steady-state prod-
uct inhibition matrix is shown in Fig. 2.
The inhibition patterns found in these experiments
are summarized in Table 1. They show that an ordered
sequential bi-bi system in which NADH binds first is
the appropriate mechanism for the enzyme. The other
six possible mechanisms are ruled out by the data in
Table 1 [6].
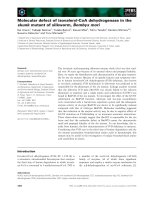
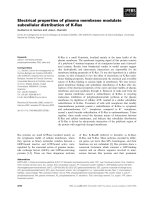
Elucidation of steady-state kinetic constants
The true K
M
value for pyruvate was determined using
the secondary plot shown in Fig. 3. Here the apparent
K
M
for pyruvate is plotted as a function of the concen-
tration of NADH and fitted to Equation 3 (see Experi-
mental procedures). The plot shows a plateau at a
value of about 55 ± 7 lm, the true K
M
for the sub-
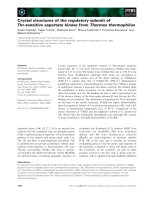
strate. Fig. 4 shows a secondary plot in which k
cat
val-
ues for these data sets were plotted as a function of
the NADH concentration and fitted to the Michaelis–
Menten equation. The plot yields a value for the max-
imal catalytic rate constant of the reaction of 96 s
)1
and a value for the K
M
for NADH of 11 ± 2 lm.
p
y
ruvate (mM)
0 0.4 0.8
0
20
40
60
80
100
20 30 40
k
tac
s(
1_
)
Fig. 1. Secondary plot of steady-state reaction velocities plotted as
a function of pyruvate concentration. Initial velocities of the enzyme
reaction were measured under steady-state conditions, in varied
concentrations of NADH and different fixed concentrations of pyru-
vate. In these experiments, each initial rate measurement was
repeated five times and the values averaged. These data were fit-
ted to the standard Michaelis–Menten equation to give values of
k
cat
at a series of fixed pyruvate concentrations. The curve shows
these values for k
cat
versus pyruvate concentration fitted to Eqn 1
in Experimental procedures, yielding a K
M
for pyruvate 69 ± 4 lM,
K
i
140 ± 18 mM (k
cat
is used as it is independent of enzyme
concentration). Each point on the graph corresponds to five
repeated measurements of initial rates at five different NADH con-
centrations fitted to yield k
cat
values with the standard error shown.
As there are nine of these points, the data correspond to 225 rate
measurements.
D. K. Shoemark et al. Kinetic characterization of Pf LDH
FEBS Journal 274 (2007) 2738–2748 ª 2007 The Authors Journal compilation ª 2007 FEBS 2739
The kinetic constants describing the reaction in the
other direction, with NAD
+
and lactate as substrates,
were determined at a physiologically relevant pH
(pH 7.5) and all steady-state constants are given in
Table 2. In this study, for ease of purification and sta-
bility, a histidine-tagged version of PfLDH was used
(see Experimental procedures) [7]. To assess any effect
of this tag on the catalytic function of the enzyme,
equivalent experiments to those described above were
performed with the wild-type enzyme. The K
M
for
NADH, the K
M
and K
i
for pyruvate and k
cat
for both
wild-type and His-tagged enzymes were measured.
These yielded the same constants, within error, as those
Table 1. Pattern of product inhibition in the steady state. In order
to elucidate the basic kinetic mechanism for PfLDH, the pattern of
product inhibition was determined using NADH and pyruvate as sub-
strates and either NAD
+
or lactate as inhibitors. For these diagnostic
purposes, the reactions were carried out at two set concentrations
of NADH, subsaturating (i.e. K
M
· 1 ¼ 10 lM) and saturating (i.e.
K
M
· 20 ¼ 200 lM). The pattern of inhibitory behaviour shown in
the table is exactly that expected for an ordered bi bi kinetic mech-
anism with the coenzyme binding first [6].
Product
Subsaturating
substrate
Saturating
substrate
Substrate
varied
Lactate Mixed Mixed Pyruvate
NAD+ Mixed Not inhibited Pyruvate
Lactate Mixed Uncompetitive NADH
NAD+ Competitive Competitive NADH
NADH (m
M
)
0.05 0.1 0.15 0.2
K
M
mM)(etavuryptnerappa
0
0.02
0.04
0.06
0.08
0.1
0.12
Fig. 3. The secondary plot of apparent K
M
for pyruvate plotted
against NADH concentration showing the true K
M
for pyruvate. Ini-
tial velocities were measured in five different NADH concentrations
and varied pyruvate. Each measurement was repeated five times
and averaged; this graph represents 125 measurements. From a
standard Michaelis–Menten fit, the data revealed apparent K
M
val-
ues for pyruvate for each NADH concentration (the error bars on
the graph pertain to these fits). These apparent K
M
values for pyru-
vate were then plotted against the corresponding NADH concentra-
tion. The data were fitted to Eqn 3 in Experimental procedures and
show the true K
M
for pyruvate; 55 ± 7 lM is found at infinite NADH
concentrations seen here as the plateau. This behaviour also indi-
cates that the system is an ordered sequential bireactant system
with pyruvate binding subsequently to NADH [6].
NADH (mM)
0
0.04 0.08 0.12 0.16 0.2
k
tac
s(
1-
)
0
20
40
60
80
100
Fig. 4. The secondary plot of steady-state reaction velocities plot-
ted as a function of NADH concentration. Data from the same set
of experiments as described for Fig. 3 was used. This time the sec-
ondary plot shows steady-state values for the fitted k
cat
measured
with varied pyruvate at different fixed NADH concentrations. The
re-plotted data were fitted to the Michaelis–Menten equation to
yield the K
M
for NADH as 11 ± 2 lM and the k
cat
96 s
)1
.
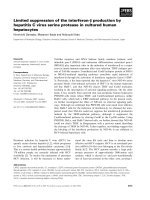
1/pyruvate (μM
-1
)
-0.02 -0.01 0 0.01 0.02 0.03
1/v (min/ΔA)
0
2
4
6
8
10
Fig. 2. Example plot of data from the steady-state product inhibition
matrix, generating one piece of the information in Table 1. This
example shows a Lineweaver–Burk plot of rates under conditions
of subsaturating NADH and varied pyruvate in the presence of dif-
ferent fixed lactate concentrations. s, zero lactate; j,50m
M lac-
tate; n ,75m
M lactate; *, 100 mM lactate. Each point on the graph
represents an average of five measurements.
Kinetic characterization of Pf LDH D. K. Shoemark et al.
2740 FEBS Journal 274 (2007) 2738–2748 ª 2007 The Authors Journal compilation ª 2007 FEBS
described above, hence the tag did not influence the kin-
etic behaviour of the enzyme to any measurable extent.
Equilibrium binding affinity of NADH
The binding of NADH to the active site of dehydro-
genases is usually accompanied by a significant alter-
ation in its fluorescence properties resulting from
either a protection from solvent, collision quenching
and ⁄ or a change in polarity of the environment of the
fluorophore. In the case of PfLDH, the signal change
on binding to the active site was too small to be used
as a reliable reporter of the formation of the binary
complex. As a result, fluorescent resonance energy
transfer (FRET) from the indole to the dihydro-nico-
tinamide groups was used to measure the affinity for
NADH. The FRET data were fitted to Equation 5 (see
Experimental procedures) and are shown in Fig. 5,
yielding a K
d
of 4.0 ± 0.8 lm.
pH dependence of substrate binding
A characteristic of this family of dehydrogenases is the
pH sensitivity of the K
M
values for pyruvate and lac-
tate [8]. These parameters are controlled by the proto-
nation state of the active-site histidine residue, which
serves as a proton donor–acceptor in the redox reac-
tion. Pyruvate binds only when the histidine is in the
protonated state and lactate only when it is unproto-
nated. To investigate the pK of this residue, the K
M
for pyruvate was determined as a function of pH and
the data are shown in Fig. 6. The data was fitted to
Equation 6 (see Experimental procedures) and shows
that the K
M
is controlled by a single ionizing group
with a pK of 7.95 ± 0.08, similar to other lactate
dehydrogenases of this mechanistic family [9].
Transient kinetic properties of the enzyme: the
single-turnover reaction
Single-turnover experiments were carried out to help
elucidate the nature of the rate-limiting step. In such
Table 2. Kinetic constants for the reduction of pyruvate and the
oxidation of lactate at pH 7.5.
Substrate ⁄ cofactor K
M
(lM) k
cat
(s
)1
)
k
cat
⁄ K
M
(s
)1
Æ M
)1
)
NADH 11 ± 2 96 6.7 · 10
6
Pyruvate 55 ± 7 96 1.7 · 10
6
NAD+ 180 ± 24 40 2.2 · 10
5
Lactate 47 ± 8 · 10
3
40 850
Pf LDH (μM)
0 2 4 6 8 10 12 14 16 18 20 22 24 26 28
)stinu yrartibra( langis TERF detcerroc
4
5
6
Fig. 5. The fluorescent resonance energy transfer (FRET) titration
to establish the K
d
for NADH. One micromolar additions of PfLDH
were made to a cuvette containing 10 l
M NADH in a SPEX Fluoro-
max spectrophotometer. The absorption wavelength for tryptophan
at 285 nm was used as the excitation wavelength and the emission
wavelength of 450 nm for NADH was monitored. Control experi-
ments were carried out to correct for the inner filter effect of
adding protein as described. The data were fitted to the tight bind-
ing equation (Eqn 5; see Experimental procedures) and the NADH
concentration was allowed to float. Results showed the K
d
for
NADH is 4 ± 0.8 l
M and the fitted NADH concentration was
10.4 ± 0.9 l
M (10 lM in cuvette).
[H
+
](
μ
Μ
)
K tnerappa
M
)Mm( etavuryp
0.0
0.1
0.10.010.0010.0001
1
1
Fig. 6. A pH titration under steady-state conditions was carried out
to determine the pKa of the ionizable group at the active site. The
K
M
for pyruvate was determined from rates measured for 8–10 dif-
ferent pyruvate concentrations in 200 l
M NADH in the pH range
6–10 (the enzyme was unstable below pH 5.5). Each rate was
repeated three times and averaged. Shown here is the log variation
in apparent K
M
(mM) for pyruvate versus log [H
+
]. NB In pH terms
the x-axis reads left to right pH 10–6. A four buffer system was
used to minimize variables other than pH (see Experimental
procedures). The data has been fitted to the equation
K
Mapp.
¼ K
M
(1 + K
h
⁄ [H
+
]). The K
h
from the graph was 11 ± 2 nM
and equates to a pKa of 7.95 ± 0.08 for the ionizable group.
D. K. Shoemark et al. Kinetic characterization of Pf LDH
FEBS Journal 274 (2007) 2738–2748 ª 2007 The Authors Journal compilation ª 2007 FEBS 2741
an experiment, the enzyme is mixed with one equival-
ent of NADH to form a binary complex in one syringe
of the stopped-flow apparatus. This solution is then
challenged with pyruvate and the first-order, on-
enzyme conversion of NADH to NAD
+
is recorded
by monitoring the loss of absorbance at 340 nm. In
this way, the reaction is simplified as it is only the
hydride-transfer chemistry itself, or a preceding con-
formational rearrangement that can limit the recorded
rate constant. The single-turnover data are shown in
Fig. 7, where the observed rate constant is plotted
against the varied concentration of pyruvate. The
data are fitted to the Michaelis–Menten equation
giving a maximum rate constant 130 s
)1
and an
apparent K
M
of 240 lm. The maximum rate constant
is significantly higher than the catalytic rate constant
measured in the steady state, suggesting that some
other process is partially limiting the steady-state
reaction rate.
The experiment at 2 mm pyruvate was repeated,
reversing the mixing order. In this case, 75 lm enzyme
was challenged with 4 mm pyruvate and 75 lm NADH
giving a single turnover rate for 2 mm pyruvate post-
mix of 116 s
)1
(data not shown). This is a similar rate
to that seen in the previous experiment, with a pre-
equilibrated binary complex challenged with 2 mm
(postmix) pyruvate. This result rules out the possibility
that there is a rate-limiting, or partly rate-limiting, step
that occurs after the binding of NADH and before the
association of pyruvate, i.e. a structural rearrangement
of the E–NADH binary complex. These transient
kinetic results therefore demonstrate that the major
rate-limiting step or steps occur after the binding of
pyruvate.
Rapid kinetics of the multiple-turnover reaction
The result of a multiple-turnover experiment in which
200 lm NADH was mixed with 35 lm enzyme at a
pyruvate concentration of 1 mm is shown in Fig. 8.
The reaction trace (Fig. 8A) shows curvature in the
initial milliseconds of the experiment, followed by a
steady-state rate of about 75 s
)1
per active site as
shown by the linear regression. The first turnover was
pyruvate (mM)
0 0.2 0.4 0.6 0.8
1
1.2
1.4 1.6
1.8
2
k
sbo
s(
1-
)
0
20
40
60
80
100
120
Fig. 7. The secondary plot of single turnover rates as a function of
pyruvate concentration fitted to the Michaelis–Menten equation.
The K
M
value for pyruvate under transient conditions was 240 lM,
five times weaker binding than in the steady state and the k
cat
was
faster, 130 s
)1
compared to 96 s
)1
in the steady state. Each single
turnover rate was measured under transient kinetic conditions with
equimolar enzyme and NADH in one syringe challenged with
increasing concentrations of pyruvate in the other. Each of the
measurements was repeated 10 times, averaged and fitted to a
single exponential giving the rate constant at each concentration of
pyruvate.
A
0.150.10.050
0.3
0.2
0.1
0
Time (s)
ecnabrosbA
0.040.020
0.06
0.04
0.02
0
Time (s)
ecnabrosbA
B
Fig. 8. Multiple turnovers measured in the stopped flow apparatus.
NADH (200 l
M) was mixed with enzyme (35 lM) and mixed with
pyruvate (1 m
M). The change in absorbance at 340 nm was meas-
ured. An average of five transients was used for the fitting. (A)
shows the averaged data from the experiment with a linear fit to
the steady-state rate of 75 s
)1
. (B) shows the initial 0.04 s of the
data after subtracting the steady-state rate. These data were fitted
to a single exponential to give an initial rate of 134 s
)1
in the
approach to the steady-state rate.
Kinetic characterization of Pf LDH D. K. Shoemark et al.
2742 FEBS Journal 274 (2007) 2738–2748 ª 2007 The Authors Journal compilation ª 2007 FEBS
fitted to a single exponential with slope for subsequent
turnovers removed (Fig. 8B). This gave a first-order
rate constant of 134 s
)1
. This experiment shows that
there must be a process following hydride transfer that
partially limits the steady-state catalytic rate.
Primary deuterium isotope effect
Figure 9 shows a comparison of the single-turnover
reaction carried out with NADH and with 4R-NADD.
The observed kinetic isotope effect, KIE
(obs)
, was
approximately 1.2 (given by the ratio of the first-order
rate constants). Previous data for this class of dehy-
drogenase enzymes show that the intrinsic kinetic iso-
tope effect [KIE
(int)
] should be close to 2.7 [10] for a
reaction in which hydride transfer is completely rate-
limiting. This value was extrapolated from data on a
series of LDH mutants [10]. A plot of k
cat
versus the
observed kinetic isotope effect showed that as k
cat
ten-
ded to zero the KIE tended to 2.7. The value of 2.7
was taken to represent the maximal KIE for an LDH
limited by hydride transfer. Here, the observed value
of 1.2 indicates that while there is a small component
from hydride transfer in the rate limiting process (the
value is greater than 1), there must also be a major
contribution from a conformational change. Rate con-
stants for hydride transfer (k
3H
) and conformational
change (k
3C
) were calculated using Equations 7 and 8
(Experimental procedures) and found to be 2000 s
)1
and 160 s
)1
, respectively.
A likely candidate for this conformational change is
movement of the substrate-specificity loop, as observed
in other lactate dehydrogenases [10]. This will be con-
sidered in more detail, in the context of crystal struc-
tures, in the discussion.
Alternative substrates
The fact that there is a unique five-residue insertion in
the active-site loop of the PfLDH enzyme raises the
possibility that substrate specificity is different from the
LDHs thus far investigated in detail, both eukaryotic
and prokaryotic. To investigate this possibility, the
activity of the enzyme was tested with alternative sub-
strates for comparison with other well-characterized
LDHs; Table 3 shows a summary of the results. There
was an approximately 10-fold decrease in PfLDH effi-
ciency between pyruvate and a-ketobutyrate. The pres-
ence of the extra methylene group of a-ketobutyrate
results in a 10-fold increase in K
M
. However, the pres-
ence of two extra methylene groups, compared with
pyruvate, in a-ketovalerate results in a catastrophic
decrease in enzyme efficiency. For this substrate the
K
M
is increased 2000-fold and the k
cat
decreased
200-fold compared with a 130-fold increase in K
M
for
a-ketovalerate in BsLDH, which had just a five-fold
decrease in k
cat
[10]. The ability of the enzyme to
reduce phenylpyruvate was also assessed. Surprisingly,
and unlike the case of other LDH enzymes of this fam-
ily, we could detect no catalytic activity at all with this
substrate.
Testing for malate dehydrogenase activity
One of the more striking sequence differences between
PfLDH and other LDHs of the same fold is the
presence of a lysine residue at position 102. The pres-
ence of a positive charge in this position in the
sequence is a possible characteristic of an enzyme that
has malate dehydrogenase activity [11]. Indeed, appar-
ent activity is seen under standard steady-state condi-
tions when oxaloacetate is used as the substrate in
place of pyruvate. In neutral solutions, oxaloacetate
Time (s)
0 0.005 0.01 0.015 0.02 0.025 0.03 0.035 0.04
mn043 ecnabrosba egnahc
-0.05
-0.04
-0.03
-0.02
-0.01
0
Fig. 9. The kinetic primary isotope effect measured in the stopped
flow apparatus. In this experiment 75 l
M enzyme was challenged
with 75 l
M 4R-NADD (top trace) and 75 lM NADH (bottom trace).
The ratio of rates of the two single turnover events is 1.2. The ratio
expected (observed kinetic isotope effect) for this class of enzymes
in a process that is wholly rate-limited by hydride transfer is 2.7
[10]. The rate of conformational change was calculated as 160 s
)1
and the rate of hydride transfer as 2000 s
)1
using the equations
described in the primary deuterium isotope effect section of Experi-
mental procedures. Each transient is an average of 10.
Table 3. Kinetic constants for pyruvate, a -ketobutyrate and a-ket-
ovalerate (values in parentheses are taken from reference [16]).
Substrate K
M
(mM) k
cat
(s
)1
) k
cat
⁄ K
M
(s
)1
ÆM
)1
)
Pyruvate 0.055 96 1.7 · 10
6
a-ketobutyrate 0.6 (0.47) 80 (180) 1.3 · 10
5
(3.8 · 10
5
)
a-ketovalerate 116 0.64 5.5
D. K. Shoemark et al. Kinetic characterization of Pf LDH
FEBS Journal 274 (2007) 2738–2748 ª 2007 The Authors Journal compilation ª 2007 FEBS 2743
decarboxylates rapidly to pyruvate, even in the absence
of an enzyme. We used proton NMR to determine the
actual substrate responsible for activity. Over a period
of hours, peaks for NADH and oxaloacetate were
replaced by those corresponding to NAD
+
, lactate
and pyruvate. At no time were peaks corresponding to
malate observed. This indicates that oxaloacetate de-
carboxylates rapidly in the presence of PfLDH under
these conditions and the observed activity at pH 7.2 is
due to turnover of the resulting pyruvate.
Discussion
The general reaction mechanism of PfLDH is, by and
large, similar to those of other LDHs of the nicotina-
mide-dependent type. The reaction follows an ordered
bi-bi kinetic pattern [6] with coenzyme binding first
(see Fig. 10). In addition, the steady-state constants
(see Table 2) are very similar to those measured for
structurally related counterparts with K
M
values for
NADH and pyruvate being typically in the 10
)5
and
10
)4
m ranges, respectively, and those for NAD
+
and
lactate being in the 10
)4
and 10
)2
m ranges. Similarly
the steady-state catalytic rate constants in each direc-
tion are in keeping with other LDHs.
With regard to the nature of the rate-determining
steps, conformational rearrangement is the predomin-
ant kinetic barrier in the single-turnover reaction, i.e.
in a process that can only be limited by a rearrange-
ment of the ternary collision complex or by the rate
of hydride transfer, the latter must be the more rapid,
as shown by the relatively small primary kinetic
isotope effect. The rate-limiting conformational
rearrangement in other LDHs is identified as the
closure of an active-site loop triggered by substrate
binding. The function of this change in structure is to
remove solvent from the catalytic site and bring the
positive charge of Arg-109 into proximity, so that the
carbonyl group of pyruvate can be strongly polarized.
Additionally, loop-closure enhances substrate selectiv-
ity by engulfing the pyruvate within a catalytic
vacuole to maximize contact between substrate and
enzyme. The steady-state catalytic rate constant is
slightly slower than that recorded for the single-turn-
over reaction, showing that some process that follows
hydride transfer partially limits the steady-state reac-
tion cycle. This process must be a product-release
step, either a rate of dissociation of lactate or NAD
+
or the rate of loop opening after the hydride transfer
reaction.
A consequence of this partial rate-limiting process is
that the apparent Michaelis constant for pyruvate in
the single-turnover reaction is higher than that recor-
ded in the steady-state. This phenomenon is due to a
relatively slow product off-rate in the system as des-
cribed above. To illustrate this, if the binding of pyru-
vate to the E–NADH complex is a rapid equilibrium
process, then the measured K
M
(K
M
¢) in the single-
turnover reaction is simply equal to the K
d
for the for-
mation of the encounter complex. However, in the
steady state all the partially rate-limiting steps come
into play and the true K
M
is given by:
K
M
¼ K
M
0
=ð1 þ k
3C
=k
3H
þ k
3C
=k
4
Þ
where k
3c
represents the rate of the conformational
change, k
3H
the hydride transfer and k
4
the rate of
the product-off step. Hence, in these circumstances,
the steady-state K
M
is expected to be smaller than the
apparent K
M
measured in the single turnovers.
Furthermore, it is interesting to note that the fact
that all three of the above rate constants are partially
rate-limiting shows that the enzyme obeys the
‘Knowlesian’ principle that biological catalysts should
evolve to have no single, dominant energy barrier
[12]. Rather, there is an evolutionary advantage in
equalizing the energies of intermediate and transition
states in the on-enzyme reaction pathway.
A major aim of these experiments was to elucidate
unusual features of the enzyme that might distinguish
it from other LDHs, particularly those of human
origin, having confirmed the lack of malate dehydro-
genase activity. The principal differences in the kinetic
Fig. 10. Simplified schematic of the mech-
anism of PfLDH where k
3H
and k
3C
repre-
sent the rate constants for hydride transfer
and conformational change, respectively, as
calculated from isotopic effects.
Kinetic characterization of Pf LDH D. K. Shoemark et al.
2744 FEBS Journal 274 (2007) 2738–2748 ª 2007 The Authors Journal compilation ª 2007 FEBS
constants of PfLDH compared with human LDHs
(with native substrate and cofactor) are twofold.
Firstly, substrate inhibition of PfLDH (140 mm;in
the direction pyruvate to lactate) is much weaker
than that shown by the human heart and muscle iso-
forms by around 175- and 35-fold, respectively [5].
Second, the binding of NADH to PfLDH is some
10-fold weaker than that shown by the human iso-
forms, hence K
d
for PfLDH is 4 ± 0.8 lm compared
with 0.5 and 0.6 lm for the human heart and muscle
enzymes, respectively [5]. Both of these differences
(raised K
d
and K
i
) appear to be largely attributable
to the presence of leucine at 163 in PfLDH, a residue
which is serine in all known LDHs that do not pos-
sess the extra five residues in the substrate-specificity
loop. Crystal structures of holo-LDHs with serine at
position 163 show that the hydroxy group of the ser-
ine side-chain is hydrogen bonded to the nicotinamide
amide group of NADH, often via a water molecule.
Site-directed mutagenesis has been used to make the
S163L variants of both human heart and muscle
LDH isoforms [5]. In both cases, substrate inhibition
was removed (K
i
> 500 mm) and the K
d
for NADH
was raised about 10-fold compared with the wild-
types. Structural studies of ternary complexes of
plasmodial LDHs [13,14] all show a displacement in
the position of the nicotinamide ring when compared
with all other ternary LDH structures, which is con-
sistent with the presence of leucine rather than serine
at position 163. Whilst the human S163L mutants
show rather similar kinetic and binding parameters
for NADH, the K
M
for pyruvate is raised by 40- to
200-fold. We may speculate that the five-residue inser-
tion in the PfLDH substrate-specificity loop compen-
sates for the deleterious effect on the pyruvate
binding site due to the S163L change (since the reac-
tion mechanism is ordered bi-bi, the pyruvate binding
site is only fully formed after NADH binding). Some
supporting evidence for this hypothesis comes from a
kinetic study in which the substrate-specificity-loop
sequences from the broad-specificity ketoacid reduc-
tase, l-hydroxyisocaproate dehydrogenase (l-hicDH),
and PfLDH were engineered into Bacillus stearother-
mophilus LDH (BsLDH), replacing the wild-type loop
[15]. The BsLDH construct containing the l-hicDH
loop (a four-residue insertion compared with typical
LDHs, e.g. those from human and bacillus) had a
K
M
for pyruvate of 42 mm, raised some 670-fold over
wild-type BsLDH. By contrast, the BsLDH construct
possessing the substrate-specificity loop from PfLDH
had a K
M
for pyruvate raised only 13-fold to 0.8 mm,
despite this corresponding to a five-residue loop inser-
tion with respect to wild-type BsLDH.
A simple method to explore the size of the substrate
binding site in a functional enzyme is to measure its
ability to turn over larger substrate-like molecules. This
is straightforward in the case of LDHs as many com-
pounds R-CO.CO
2
H(R¼ methyl in pyruvate) are
readily available. The data in Table 3 clearly show that,
in the case of PfLDH, extending R from ethyl (i.e.
a-ketobutyrate) to n-propyl (i.e. a-ketovalerate) causes
a catastrophic fall off in the catalytic efficiency
(k
cat
⁄ K
M
) of nearly six orders of magnitude. In the case
of wild-type BsLDH, this change causes a loss in cata-
lytic efficiency closer to three orders of magnitude com-
pared with pyruvate. Even more striking are the
relative activities of this pair of enzymes towards phe-
nylpyruvate. This bulky substrate is turned over by
BsLDH with a reasonable catalytic efficiency of
1.8 · 10
4
m
)1
Æs
)1
[15], whilst no activity at all was
detected with PfLDH either in this study (data not
shown) and elsewhere [16]. This behaviour may be con-
trasted with that of two lactate dehydrogenases present
in the parasite Toxoplasma gondii that turn over phe-
nylpyruvate at a comparable rate to pyruvate. Recent
structural work [17] has shown that TgLDH1 has a
very similar structure to PfLDH, including the long
substrate-specificity loop. Both TgLDH enzymes con-
tain another loop insertion (of two residues) between
helices a-G2 and a-G3 and other changes in residue
types lining the active site, any or all of these factors
may be responsible for the activity shown by TgLDHs
towards phenylpyruvate.
Consequences for drug design
The intolerance of PfLDH towards larger substrates
limits the possibilities for inhibitor design based
on substrate or product (i.e. pyruvate or lactate)
analogues. This observation is borne out by the
recent development of a series of azole-based lactate
analogues which are strong inhibitors of the oxidized
binary complex of PfLDH and NAD
+
[3]. Attempts
to elaborate these compounds to improve binding
and specificity were unsuccessful, presumably due to
the precise conformational requirements of the closed
substrate-specificity loop. The bi-bi mechanism, demon-
strated in this paper, requires binding of NADH
before substrate. As both the NADH and the ordered
substrate-specificity loop comprise part of the sub-
strate-binding site, substrate analogues are not expec-
ted to bind tightly to the apoenzyme. However, an
inhibitor that competes with endogenous NADH will
firstly benefit from the 10-fold weaker affinity of
NADH for PfLDH compared with the human LDH
enzymes. Additionally, the differences in residues
D. K. Shoemark et al. Kinetic characterization of Pf LDH
FEBS Journal 274 (2007) 2738–2748 ª 2007 The Authors Journal compilation ª 2007 FEBS 2745
lining the NADH binding site such as the switch of
Ser to Leu at position 163 should be exploitable in
drug design. Finally, with respect to improving affin-
ity, compounds could be targeted to the apoenzyme
[18]. Binding compounds across the substrate and
coenzyme sites could increase the scope for elaboration.
The large surface e xposed when the substrate-specificity
loop is disordered, as seen in the apoenzyme
crystal structure, affords the opportunity to design
inhibitors that are not restricted by the limited space
available in the closed-loop conformation of the
protein.
Experimental procedures
Expression and purification
Six histidines were added to the C-terminus of the PfLDH
gene by PCR without linker or cleavage sites. The modified
gene was inserted into the pKK vector and cloned into
JM105 strain of Escherichia coli [4]. Cells were harvested
from overnight culture in 2xYT (yeast tryptone media)
without the need for isopropyl-b-d-thiogalactopyranoside
induction [7]. Following sonication, cell debris was separ-
ated by centrifugation at 5000 g for 30 min.
The supernatant was then applied to a Nickel-NTA
agarose column (Qiagen, Crawley, UK). The enzyme was
eluted in 250 mm imidazole, concentrated against polyethylene
glycol 20K and dialysed into phosphate buffered saline
(NaCl ⁄ P
i
), 10% glycerol, 5 mm EDTA and 10 mm dithio-
threitol. This protocol yielded pure enzyme at an average
of 80 mg cellsÆL
)1
. Aliquots (100 lL) of enzyme were snap
frozen in liquid nitrogen and stored at )80 °C. The activity
of the enzyme stored under these conditions remained con-
stant within the time-scale of the experiments. The concen-
tration of enzyme used was assessed by Bradford assay and
by absorbance at 280 nm where 1 mgÆmL
)1
corresponds to
an absorbance of 0.42 for a 1 cm path length. Enzyme pur-
ity was assessed as the only visible band by SDS ⁄ PAGE.
Where used for comparison with the his-tagged enzyme,
wild-type PfLDH was expressed from a pKK vector in
JM105 cells incubated overnight in 2xYT and purified on
an oxamate affinity column and eluted with NADH. Con-
centration, dialysis and storage methods were the same as
for the his-tagged enzyme.
Steady-state kinetics
Enzyme assays were carried out at 25 °C using a Perkin
Elmer spectrophotometer with a perfused cuvette block.
Grade I NADH and NAD
+
were purchased from Boehrin-
ger Mannheim (Mannheim, Germany; now Roche) and the
buffers and substrates from Sigma (Gillingham, UK). The
data were analysed using grafit 4 software.
To assess substrate inhibition, the data for experiments
in which pyruvate was varied were fitted to the following
equation:
v ¼ V
max
:S=½S þ K
M
þðS
2
=K
i
Þ ð1Þ
where v is the initial steady-state reaction velocity, S is sub-
strate concentration, K
M
is the Michaelis constant for pyru-
vate and K
i
is the substrate-inhibition constant.
At substrate concentrations well below K
i
, this equation
reduces to the standard Michaelis–Menten equation. All
experiments to elucidate the steady-state mechanism were
performed at pyruvate concentrations at least 50-fold lower
than K
i
. This equates to a reduction in rate of less than 2%
hence the following rate equations do not account for inhi-
bition by substrate.
Steady-state rate equations
The steady-state rate equation for an ordered bi-bi reaction
in the absence of reaction products is shown below.
v=E
0
¼ðk
1
Ák
2
Ák
3
Á½NÁ½PÞ=ðC
0
þ½NÁ½PÁC
NP
þ½PÁC
P
þ½NÁC
N
Þ
ð2Þ
where k
1
, k
2
and k
3
are the forward rate constants for the
binding of NADH, the binding of pyruvate and the catalytic
rate constant, respectively; the concentrations of NADH and
pyruvate are [N] and [P], respectively; the coefficients C
O
,
C
NP
,C
P
and C
N
represent the groups of rate constants that
are dependent on the subscripted substrates, e.g. C
o
are those
that are independent of substrate and C
NP
those dependent
on both coenzyme and substrate, etc. The component rate
constants are as follows: C
o
¼ k
-1
Æk
-3
+ k
-1
Æk
-2
,C
NP
¼ k
1
Æk
2
,
C
P
¼ k
2
Æk
3
, and C
N
¼ k
1
Æk
-2
+ k
1
Æk
3
.
To determine the Michaelis constants for pyruvate in the
steady state, velocities were determined at a series of coen-
zyme and substrate concentrations and the apparent K
M
for
pyruvate [K
M.pyr.(app)
] was determined as a function of NAD H
concentration ([N]). Using Eqn 2 as the parent equation, t he
secondary data were then fitted t o the following relationship:
K
M:pyr:ðappÞ
¼ðC
O
=C
NP
þ½NÁC
N
=C
NP
Þ=ð½NþC
N
=C
NP
Þð3Þ
where the y -value at infinite [N] is C
N
⁄ C
NP
, which translates
to (k
3
+ k
-2
) ⁄ k
2
and represents the true K
M
for pyruvate.
The apparent k
cat
of the system [k
cat(app)
] was deter-
mined using pyruvate as the varied reactant. The value of
k
cat.pyr.(app)
was then determined at a series of fixed NADH
concentrations ([N]). Again using Eqn 2 as the parent equa-
tion, the secondary data were fitted to the following derived
relationship:
k
cat:pyr:ðappÞ
¼ðk
1
Ák
2
Ák
3
=C
NP
ÞÁ½N=ðC
P
=C
NP
þ½NÞ ð4Þ
where k
1
Æk
2
Æk
3
⁄ C
NP
¼ k
3
and C
P
⁄
CNP
¼ k
3
⁄ k
1
. The former
is the true k
cat
and the latter the true K
M
for NADH.
Steady-state reactions were carried out at 25 °Cin
50 mm tris ⁄ 50 mm KCl buffer at pH 7.5.
Kinetic characterization of Pf LDH D. K. Shoemark et al.
2746 FEBS Journal 274 (2007) 2738–2748 ª 2007 The Authors Journal compilation ª 2007 FEBS
Proton NMR analysis of reaction products
For the alternative substrates in addition to spectrophoto-
metric assays,
1
H NMR was used to assign the products
formed in the presence of oxaloacetate and NADH. As
oxaloacetate undergoes decarboxylation to pyruvate, NMR
was used to determine whether the activity seen was due to
the turnover of oxaloacetate to malate or pyruvate to lac-
tate. Pyruvate formation, due to spontaneous oxaloacetate
decarboxylation at low pH, was minimized by adding two
molar equivalents of NaOH to ice-cold buffer prior to the
addition of solid oxaloacetic acid. In this manner, a prepar-
ative reaction was set up with PfLDH (3 lm), oxaloacetate
(5 mm) and NADH (5 mm) in NaCl ⁄ P
i
⁄ D
2
O (pH 7.2) and
1
H NMR was used to follow product formation.
Transient kinetics
Transient kinetic data were collected using an SX.18 mV
apparatus supplied by Applied Photophysics.
For the stopped-flow reactions, buffers comprised 10%
glycerol, 50 mm phosphate, 150 mm NaCl, with 5 mm
EDTA and 10 mm dithiothreitol at pH 7.5. Reactions were
carried out at 25 °C. Enzyme solutions were made up as
stocks in this buffer and lost no activity during 48 h. Gly-
cerol is known to slow the rate of loop closure for other
LDHs so the difference between steady-state rates in each
of the buffers was assessed. There was a 5–10% reduction
in k
cat
in the presence of 10% glycerol so that, within error,
direct comparisons could be made between stopped-flow
data and the steady state.
All NADH solutions were diluted in buffer from freshly
thawed 0.25 m stocks made up in water and stored at
minus 80 °C. NADH or 4R-NADD was added to enzyme
immediately before rates were measured.
Equilibrium fluorescence
FRET reactions were measured in a Spex Fluoromax spec-
trophotometer. Over a 1500-s time-base, additions of 1 lm
enzyme were made to a solution of 10 lm NADH. The
excitation wavelength was 285 nm and emission monitored
at 450 nm. Adding protein to the cuvette causes an inner
filter effect. To compensate, an identical experiment was set
up using N-acetyltryptophanamide in place of enzyme. The
PfLDH data were then divided by the resulting linear
change in fluorescence for N-acetyltryptophanamide. Data
were fitted to a tight binding equation with floating
[NADH]:
Signal ¼ initial þ ðfðE þ N
0
þ K
d
ÞÀ½ðE þ N
0
þ K
d
Þ
2
À 4ÁN
0
ÁE
0:5
g=ð2ÁN
0
ÞÞÁamp ð5Þ
where ‘initial’ is the starting fluorescence, ‘amp’ the ampli-
tude of change, E is the concentration of LDH added and
N
0
is total concentration of NADH in the titration.
pH dependence
The pH titration experiments at 25 °C were carried as
for other steady-state assays. A four buffer system was
used comprising 20 mm each of potassium acetate,
2-(cyclohexylamino)-ethanesulfonic acid (CHES), 2-amino-
2-(hydroxymethyl)-1,3-propanediol (Tris), 2,2-bis(hydroxy-
methyl)-2,2¢,2¢-nitrilotriethanol (Bis Tris). The pH of the
buffer was adjusted by the addition of either HCl or NaOH
to produce a range of pH values from 5 to 10. Measure-
ments were made in saturating NADH and varied pyruvate
to determine the K
M
for pyruvate at different pHs. The
pKa of the ionizable group was determined by fitting data
to Eqn 6.
K
MðappÞ
¼ K
M
ð1 þ K
h
=½H
þ
Þ (6)
The primary deuterium isotope effect was measured in the
SX.18 mV to determine the difference in single turnover
rates achieved in the presence of NADH or 4R-NADD.
Mono-deuterated cofactor was enzymically produced by
formate dehydrogenase (from Candida methylica) in the
presence of NAD
+
and deuterated formic acid (kindly
donated by C. M. Eszes, University of Bristol, UK).
Formate dehydrogenase catalyses the addition of hydride
(deuteride) to the A face of NAD
+
giving 4R-NADD. This
is the same hydride (deuteride) that is transferred from the
A face of the cofactor to pyruvate during reduction to
lactate catalysed by LDH [19]. PfLDH (75 lm) with 75 lm
cofactor was mixed with 4 mm pyruvate (premix concentra-
tions). From these measurements the rates of conformational
change and hydride transfer were calculated using the equa-
tions below.
k
h
¼½k
obs;NADH
Ák
obs;NADD
ð1=R À 1Þ=ðk
obs;NADD
=R
À K
obs;NADH
=RÞ (7)
k
c
¼ðk
obs;NADH
Ák
h
Þ=ðk
h
À k
obs;NADH
Þð8Þ
where k
obs
NADH ¼ observed rate constant with NADH ¼
(k
c
Æk
h
) ⁄ (k
c
+k
h
); k
obs,NADD
¼ observed rate constant with
4R-NADD ¼ [k
c
Æ(k
h
⁄ R)] ⁄ k
c
(k
h
⁄ R); R ¼ 2.7 (the basis for
R-value explained in results section for the primary deuter-
ium isotope effect [7]); k
h
¼ rate constant for hydride trans-
fer; and k
c
¼ rate constant for conformational change.
References
1 Mehlin C (2005) Structure-based drug design for
Plasmodium falciparum. Comb Chem High T Scr 8,
5–14.
2 Royer RE, Deck LM, Campos NM, Hunsaker LA &
Vander Jagt DL (1986) Biologically active derivatives of
gossypol: synthesis and antimalarial activities of peri-
acylated gossylic nitriles. J Med Chem 29, 1799–1801.
3 Cameron A, Read JA, Tranter R, Winter VJ, Sessions
RB, Brady RL, Vivas L, Easton A, Kendrick H, Croft
D. K. Shoemark et al. Kinetic characterization of Pf LDH
FEBS Journal 274 (2007) 2738–2748 ª 2007 The Authors Journal compilation ª 2007 FEBS 2747
SL et al. (2004) Identification and activity of a series of
azole-based compounds with lactate dehydrogenase-
directed anti-malarial activity. J Biol Chem 279,
31429–31439.
4 Bzik DJ, Fox BA & Gonyer K (1993) Expression of
Plasmodium falciparum lactate dehydrogenase in Escher-
ichia coli. Mol Biochem Parasitol 59, 155–166.
5 Hewitt CO, Eszes CM, Sessions RB, Moreton KM,
Dafforn TR, Takei J, Dempsey CE, Clarke AR &
Holbrook JJ (1999) A general method for relieving sub-
strate inhibition in lactate dehydrogenases. Protein Eng
12, 491–496.
6 Segel IR (1993) Enzyme Kinetics – Behaviour and Analy-
sis of Rapid Equilibrium and Steady State Enzyme Sys-
tems. Wiley Classics Library edn. John Wiley and Sons
Inc., Chichester, UK.
7 Shoemark DK. (2000) The kinetic characterization of
lactate dehydrogenase enzyme from Plasmodium
falciparum. PhD Thesis. University of Bristol, UK.
8 Fersht A (1998) Structure and Mechanism in Protein
Science: a Guide to Enzyme Catalysis and Protein
Folding, 4th edn. W. H. Freeman, New York, NY.
9 Read JA, Winter VJ, Eszes CM, Sessions RB & Brady
RL (2001) Structural basis for altered activity of
M- and H-isozyme forms of human lactate dehydrogen-
ase. Proteins Struct Func Genet 43, 175–185.
10 Wilks HM, Halsall DJ, Atkinson T, Chia WN,
Clarke AR & Holbrook JJ (1990) Designs for a broad
specificity keto acid dehydrogenase. Biochem 29, 8587–
8591.
11 Brown MW, Yowell CA, Hoard A, Vander Jagt TA,
Hunsaker LA, Deck LM, Royer RE, Piper RC, Dame
JB, Makler MT et al. (2004) Comparative structural
analysis and kinetic properties of the lactate dehydro-
genases from the four species of human malarial para-
sites. Biochemistry 43, 6219–6229.
12 Albery WJ & Knowles JR (1976) Evolution of enzyme
function and the development of catalytic efficiency.
Biochemistry 15 , 5631–5640.
13 Winter VJ, Cameron A, Tranter R, Sessions RB &
Brady RL (2003) Crystal structure of Plasmodium
berghei lactate dehydrogenase indicates the unique
structural differences of these enzymes are shared
across the Plasmodium genus. Mol Biochem Parasitol
131, 1–10.
14 Dunn CR, Banfield MJ, Barker JJ, Higham CW,
Moreton KM, Turgut-Balik D, Brady RL & Holbrook
JJ (1996) The structure of lactate dehydrogenase from
Plasmodium falciparum reveals a new target for anti-
malarial design. Nat Struct Biol 3, 912–915.
15 Hewitt CO, Sessions RB, Dafforn TR & Holbrook JJ
(1997) Protein engineering tests of a homology model of
Plasmodium falciparum lactate dehydrogenase. Protein
Eng 10, 39–44.
16 Gomez MS, Piper RC, Hunsaker LA, Royer RE, Deck
LM, Makler MT & Vander Jagt DL (1997) Substrate
and cofactor specificity and selective inhibition of
lactate dehydrogenase from the malarial parasite
P. falciparum. Mol Biochem Parasitol 90, 235–224.
17 Kavanagh KL, Elling RA & Wilson DK (2004) Struc-
ture of Toxoplasma gondii LDH1: active-site differences
from human lactate dehydrogenases and the structural
basis for efficient APAD
+
use. Biochemistry 43,
879–889.
18 Conners R, Schambach F, Read JA, Cameron A,
Sessions RB, Vivas L, Easton A, Croft SL & Brady RL
(2005) Mapping the binding site for gossypol-like inhibi-
tors of Plasmodium falciparum lactate dehydrogenase.
Mol Biochem Parasitol 142, 137–134.
19 Dolphin D, Poulson R & Avramovic O (1987) Pyridine
Nucleotide. Coenzymes. Vol. II. Part A, pp. 258–260.
Wiley-Interscience, Chichester, UK.
Kinetic characterization of Pf LDH D. K. Shoemark et al.
2748 FEBS Journal 274 (2007) 2738–2748 ª 2007 The Authors Journal compilation ª 2007 FEBS