Báo cáo khoa học: Differential gene expression in periportal and perivenous mouse hepatocytes potx
Bạn đang xem bản rút gọn của tài liệu. Xem và tải ngay bản đầy đủ của tài liệu tại đây (445.71 KB, 11 trang )
Differential gene expression in periportal and perivenous
mouse hepatocytes
Albert Braeuning
1
, Carina Ittrich
2
, Christoph Ko
¨
hle
1
, Stephan Hailfinger
1
, Michael Bonin
3
,
Albrecht Buchmann
1
and Michael Schwarz
1
1 Institute of Pharmacology and Toxicology, Department of Toxicology, University of Tuebingen, Germany
2 Central Unit of Biostatistics, German Cancer Research Center, Heidelberg, Germany
3 Institute for Human Genetics, Microarray Facility, Tuebingen, Germany
Hepatocytes play a pivotal role in both the synthesis
and degradation of numerous endogenous biomole-
cules, thus maintaining metabolic homeostasis, as well
as in the conversion and detoxification of xenobiotic
compounds. Based on the location of the blood ves-
sels, the terminal branches of the portal and the hep-
atic (central) veins and on the direction of the blood
flow, hepatocytes of each liver lobule can be divided
into two subpopulations, an upstream ‘periportal’ and
a downstream ‘perivenous’ (pericentral) population.
Zonal-specific differences in the metabolic capacities of
many enzymes or other proteins, and – to a lesser
extent ) of their corresponding messenger RNAs, have
been subject to extensive studies throughout the last
decades.
Many enzymes of intermediary metabolism are not
distributed uniformly throughout the liver, but are
preferentially expressed in either the periportal or the
perivenous hepatocyte subpopulation [1–3]. Hence,
hepatocytes located in either of the two regions have
different, often complementary, functions. Whereas,
for example, glycolysis is exclusively active in perive-
nous hepatocytes, key enzymes of gluconeogenesis, the
antagonist pathway, are preferentially expressed in
periportal hepatocytes [1]. Zonal-specific expression
has also been established for enzymes of amino acid
and ammonia metabolism, showing, for example, a
higher activity of the urea cycle in periportal cells
compared to perivenous hepatocytes [3], whereas gluta-
mine synthesis is exclusively active in the perivenous
Keywords
metabolic zonation; microarray analysis;
mouse liver; zonal gene expression
Correspondence
M. Schwarz, Institute of Pharmacology and
Toxicology, Department of Toxicology,
University of Tuebingen, Wilhelmstr. 56,
72074 Tuebingen, Germany
Fax: +49 7071 29 2273
Tel: +49 7071 29 77398
E-mail:
(Received 24 July 2006, revised 15 Septem-
ber 2006, accepted 18 September 2006)
doi:10.1111/j.1742-4658.2006.05503.x
Hepatocytes located in the periportal and perivenous zones of the liver
lobule show remarkable differences in the levels and activities of various
enzymes and other proteins. To analyze global gene expression patterns of
periportal and perivenous hepatocytes, enriched populations of the two cell
types were isolated by combined collagenase ⁄ digitonin perfusion from
mouse liver and used for microarray analysis. In total, 198 genes and
expressed sequences were identified that demonstrated a ‡ 2-fold difference
in expression between hepatocytes from the two different zones of the liver.
A subset of 20 genes was additionally analyzed by real-time RT-PCR, val-
idating the results obtained by the microarray analysis. Several of the
differentially expressed genes encoded key enzymes of intermediary meta-
bolism, including those involved in glycolysis and gluconeogenesis, fatty
acid degradation, cholesterol and bile acid metabolism, amino acid degra-
dation and ammonia utilization. In addition, several enzymes of phase I
and phase II of xenobiotic metabolism were differentially expressed in peri-
portal and perivenous hepatocytes. Our results confirm previous findings
on metabolic zonation in liver, and extend our knowledge of the regulatory
mechanisms at the transcriptional level.
Abbreviations
GS, glutamine synthetase.
FEBS Journal 273 (2006) 5051–5061 ª 2006 The Authors Journal compilation ª 2006 FEBS 5051
subpopulation [4]. The list of zonally expressed
enzymes can be further extended to metabolic path-
ways such as glycogen synthesis, lipid metabolism and
bile acid formation [1]. Many enzymes of xenobiotic
metabolism also exhibit zonal-specific differences in
protein or mRNA levels, with preferential perivenous
expression of the main detoxification enzymes such as
the cytochrome P450 monooxygenase isoforms [5].
Two different types of zonation can be distinguished,
so-called ‘dynamic zonation’ and ‘stable zonation’.
Whereas some zonally expressed genes, particularly
those encoding enzymes of carbohydrate metabolism,
undergo dynamic changes in expression as an adaptive
response to changes in hormonal or nutritional status
[6], a second group of genes is more or less stably
expressed within only a few layers of hepatocytes of
the liver lobule, either perivenous or periportal, and
can hardly be affected by external stimuli. One of the
best-known examples of proteins with stable zonal
expression is the enzyme glutamine synthetase (GS),
which is expressed at high levels within only one
to two layers of hepatocytes surrounding the central
veins [4].
Previous studies on zonation of metabolic pathways
in the liver were mainly focused on analysis of protein
expression or measurements of enzyme activities in rat
liver, but comparatively few data are available on
mRNA expression levels, especially in mice. It is there-
fore largely unknown whether zonal gene expression is
regulated primarily at the transcriptional or post-trans-
lational level. We have now investigated by microarray
analysis the global gene expression patterns of peripor-
tal and perivenous hepatocytes to identify those pro-
teins that are subject to differential transcriptional
regulation in the two hepatocyte subpopulations.
Results
Expression profiles of perivenous and periportal
hepatocytes
Perivenous and periportal mouse hepatocyte fractions
were obtained by combined digitonin ⁄ collagenase per-
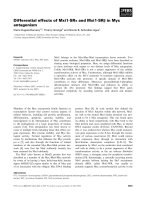
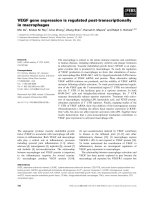
fusion of liver of male C3H ⁄ He mice. The efficiency of
hepatocyte separation was monitored by western ana-
lysis of marker proteins with well-known zonal differ-
ences in expression, e.g. GS, a perivenous marker, and
E-cadherin, a periportal marker; this demonstrated the
expected differences in levels between periportal and
perivenous hepatocytes (Fig. 1). The RNA expression
patterns of hepatocyte fractions were analyzed by use
of the Affymetrix GeneChip MOE-430A, which con-
tains approximately 22 600 probe sets, including more
than 14 000 well-characterized mouse genes. Genes
were stratified into two groups according to their pref-
erential perivenous or preferential periportal expres-
sion, using as discriminators a Œlog
2
expression ratio Œ
‡ 1 (corresponding to a ‡ 2-fold difference in expres-
sion) and an adjusted P-value £ 0.1.
In total, we identified 198 genes and expressed
sequences that were differentially regulated in hepato-
cytes from the two different zones of the liver; 99 of
these were predominantly expressed in perivenous cells,
whereas another 99 were mainly expressed in peripor-
tal hepatocytes. A detailed list of the differentially
expressed genes is provided in supplementary Table
S1. Note that the number of probe sets with significant
differences in expression was somewhat higher than
198, because several genes were represented more than
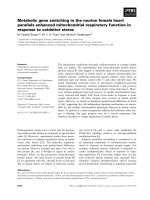
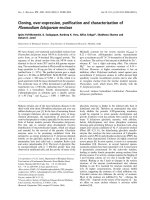
once on the array. Figure 2 shows a so-called Volcano
plot, where, for each of the 22 600 probe sets, the
mean of the adjusted P-values is plotted against its
corresponding mean log
2
ratio. Probe sets meeting the
criteria of significance are shown in the gray areas of
the plot. Genes with preferential perivenous expression
pv
GS
E-Cad.
Gpr49
Cyp1A
GAPDH
pp
Fig. 1. Western analysis of marker protein levels in protein extracts
from perivenous (pv) and periportal (pp) hepatocyte subpopulations
enriched by digitonin ⁄ collagenase perfusion. The indicated proteins
are known to show marked zonal differences in expression in liver
and were therefore chosen as ‘markers’ for periportal and perive-
nous hepatocytes. Glyceraldehyde-3-phosphate dehydrogenase
(GAPDH) was used as a loading control. GS, glutamine synthetase;
E-cad, E-cadherin; Gpr49, G-protein-coupled receptor 49; Cyp1A,
cytochrome P450 1A.
Zonal gene expression in mouse liver A. Braeuning et al.
5052 FEBS Journal 273 (2006) 5051–5061 ª 2006 The Authors Journal compilation ª 2006 FEBS
show positive log
2
ratios in the plot, whereas genes
with preferential periportal expression show negative
log
2
ratios.
To validate these data, the expression of 20 (10%)
of the zonated genes found in the microarray experi-
ment was additionally analyzed by real-time RT-PCR.
The PCR data closely resembled the findings of the
microarray analysis. A comparison of the results
obtained with the two methods is shown in Table 1.
Differences in genes encoding enzymes of
intermediary metabolism
The results of our present microarray analysis clearly
demonstrate differences between perivenous and peri-
portal hepatocytes in the expression of genes encoding
key enzymes of zonated pathways of intermediary meta-
bolism. This holds particularly true for genes encoding
enzymes playing a role in pathways that are known to
be stably zonated within the liver lobule. A schematic
representation of the observed differences in selected
metabolic pathways is given in Figs 3 and 4.
Glycolysis and gluconeogenesis
As shown in Fig. 3A, several genes encoding enzymes
participating in glycolysis are preferentially expressed in
perivenous cells. These include the genes encoding sorbi-
tol dehydrogenase (EC 1.1.1.14), aldehyde reductase
(EC 1.1.1.21), 6-phosphofructo-2-kinase (EC 2.7.1.105),
dihydrolipoamide-S-transferase (EC 2.3.1.2), and isoci-
trate dehydrogenase (EC 1.1.1.41). Only one gene of this
pathway, that encoding pyruvate kinase (EC 2.7.1.40),
was found to be mainly expressed in periportal hepato-
cytes. The gene encoding phosphoenolpyruvate carb-
oxykinase (EC 4.1.1.32), one of the key enzymes in
gluconeogenesis, is primarily expressed in periportal
hepatocytes. The same holds true for the gene encooding
ATP citrate lyase (EC 2.3.3.8), an enzyme forming
oxaloacetate and acetyl-CoA from citrate for further
utilization in gluconeogenesis and cholesterol synthesis,
respectively. When the discrimination level was lowered
to a Œlog
2
expression ratio Œ‡ 0.5, additional genes enco-
ding enzymes involved in glucose metabolism were
found to be zonated, such as the gene encoding the
tricarboxylic acid cycle component citrate synthase
(EC 2.3.3.1), which is preferentially expressed in peri-
venous hepatocytes.
Fatty acid degradation and cholesterol
metabolism
Zonal-specific differences in the expression of genes
encoding enzymes involved in fatty acid degradation
Fig. 2. Volcano plot demonstrating differ-
ences in gene expression between periportal
and perivenous hepatocytes. Each of the
22 600 transcripts is represented by a sin-
gle dot. Discriminators (P ¼ 0.1 for the adjus-
ted P-value and |log
2
expression ratio| ‡ 1)
are indicated by horizontal and vertical lines;
these were chosen to identify genes with
significant alterations in expression (areas
indicated by gray). One hundred and
twenty-nine probe sets (corresponding to 99
transcripts) were predominantly expressed in
perivenous cells, showing positive log
2
ratios,
whereas another 114 probe sets (corres-
ponding to another 99 transcripts) were
mainly expressed in periportal hepatocytes,
showing negative log
2
ratios.
A. Braeuning et al. Zonal gene expression in mouse liver
FEBS Journal 273 (2006) 5051–5061 ª 2006 The Authors Journal compilation ª 2006 FEBS 5053
and cholesterol metabolism are shown in Fig. 3B. For
example, mRNAs coding for phosphatide phosphatase
(EC 3.1.3.4) and apoliprotein C-II, an essential co-
factor for the activation of lipoprotein lipase
(EC 3.1.1.34), are preferentially expressed in periportal
hepatocytes. As mentioned above, preferential peripor-
tal expression is also observed for the acetyl-CoA-
forming enzyme ATP citrate lyase (EC 2.3.3.8), which
provides acetyl-CoA for cholesterol synthesis. How-
ever, the mRNAs for HMG-CoA synthase and HMG-
CoA reductase, the enzymes catalyzing the initial steps
in cholesterol formation from acetyl-CoA, failed the
criteria of significance in our microarray analysis. Bile
acid synthesis is another pathway known to be active
only in perivenous hepatocytes [2]. The key enzyme in
this pathway is cytochrome P450 7A1 (EC 1.14.13.17).
This enzyme, catalyzing the rate-limiting step in bile
acid formation, is regulated at the level of mRNA,
which was found to be expressed to a much greater
extent in perivenous than in periportal hepatocytes.
At a lower cutoff ( Œlog
2
expression ratio Œ‡ 0.5) cyto-
chrome P450 27A1 (EC 1.14.13.15), an enzyme
involved in side chain oxidation of sterol intermediates
during bile acid formation, appeared to be zonated
(preferentially perivenous).
Amino acid degradation
Figure 3C demonstrates differences in expression of the
genes encoding enzymes of histidine and serine ⁄ glycine
catabolism. Three genes encoding enzymes of histidine
catabolism, histidine ammonia lyase (EC 4.3.1.3), uroc-
anate hydratase (EC 4.2.1.49) and glutamate formimi-
notransferase (EC 2.1.2.5), are exclusively expressed in
periportal hepatocytes. Additionally, mRNA for hista-
mine-N-methyltransferase (EC 2.1.1.8), an enzyme of
histamine metabolism, is also mainly expressed in the
periportal hepatocyte subpopulation. A comparable
periportal zonation on the mRNA level can be observed
for genes encoding enzymes of serine ⁄ glycine meta-
bolism, including glycine decarboxylase (EC 1.4.4.2),
serine dehydratase (EC 4.3.1.17), and serine dehydra-
tase-like (EC 4.3.1.19). Oxaloacetate, the product of the
reaction catalyzed by the latter enzymes, can be used for
gluconeogenesis, a pathway that is also mainly located
in periportal hepatocytes [1].
Ammonia utilization
As shown in Fig. 3D, ammonia is used in perivenous
hepatocytes for glutamine synthesis, as GS
(EC 6.3.1.2), the key enzyme, is specifically expressed
in this hepatocyte subpopulation. Comparable zona-
tion is found for transporters participating in ammonia
(rhesus blood group-associated B glycoprotein) and
glutamate uptake (solute carriers 1A2 and 1A4), thus
providing the substrates for GS. In contrast, periportal
hepatocytes are lacking GS and use ammonia for urea
synthesis. With less stringent cutoff conditions, the
mRNAs of four enzymes of the urea cycle were found
to be preferentially localized in the periportal area,
namely ornithine transcarbamylase (EC 2.1.3.3), argin-
inosuccinate synthetase (EC 6.3.4.5), argininosuccinate
lyase (EC 4.3.2.1), and arginase (EC 3.5.3.1), showing
log
2
expression ratios between 0.58 and 0.82.
Xenobiotic metabolism
As expected, many genes encoding enzymes of xeno-
biotic metabolism were mainly expressed in perivenous
Table 1. Validation of microarray analysis data by real-time RT-PCR.
If genes are represented by more than one probe set on the chip,
their individual log
2
ratios are shown. Genes preferentially
expressed in perivenous (pv) hepatocytes are indicated by positive
log
2
ratios, and periportal (pp) expression is indicated by negative
log
2
ratios. Log
2
ratios of PCR analysis represent the mean log
2
ratios from comparison of the same three periportal and perivenous
hepatocyte isolates that were used for the microarray analysis.
Gene
Log
2
ratio(s)
pv versus pp
(microarray)
Log
2
ratio
pv versus
pp (PCR)
Glutamine synthetase (glul) 6.23 ⁄ 3.72 4.21
Ornithine aminotransferase (oat) 5.91 5.56
Serine dehydratase (Sds) ) 6.04 ) 5.55
6-Phosphofructo-2-kinase ⁄
fructose-2,6-bisphosphatase (Pfkfb1)
1.41 1.29
Phosphoenolpyruvate carboxykinase 1,
cytosolic (Pck1)
) 2.63 ) 3.12
Cytochrome P450 1a2 (Cyp1a2) 2.53 3.04
Cytochrome P450 2e1 (Cyp2e1) 1.69 4.12
Cytochrome P450 2f2 (Cyp2f2) ) 2.67 ) 4.58
Sulfotransferase 5a1 (Sult5a1) ) 3.03 ) 3.39
Aldehyde dehydrogenase 1B1
(Aldh1b1)
) 6.07 ) 4.98
Cytochrome P450 7a1 (Cyp7a1) 3.42 ⁄ 2.55 2.69
ATP citrate lyase (Acly) ) 1.36 ⁄ ) 1.44 ⁄
) 1.63
) 1.83
Cathepsin C (Ctsc) ) 3.77 ) 3.17
G protein-coupled receptor 49 (Gpr49) 2.63 8.10
Constitutive androstane receptor
(Nr1i3)
1.65 1.39
Aryl-hydrocarbon receptor (Ahr) 1.53 1.19
Hairy and enhancer of split 1 (Hes1) ) 1.90
) 1.49
Catenin beta interacting
protein 1 (Ctnnbip1)
) 1.81 ) 3.48
Cadherin 1 (Cdh1) ) 4.39 ) 5.58
Rhesus blood group-associated
B glycoprotein (Rhbg)
4.12 4.86
Zonal gene expression in mouse liver A. Braeuning et al.
5054 FEBS Journal 273 (2006) 5051–5061 ª 2006 The Authors Journal compilation ª 2006 FEBS
hepatocytes. A list of these genes is given in
Table 2. This holds true both for enzymes of phase I
xenobiotic metabolism, e.g. various cytochrome P450
monooxygenases, and for phase II enzymes, e.g. several
isoforms of glutathione-S-transferases and sulfotransf-
erases. Other genes involved in xenobiotic metabolism,
periportal
perivenous
perivenous (only
on protein level)
no zonation
RNA periportal, protein
equally distributed
fructose-
2,6-bis-P
glucose
fructose-6-P
pyruvate
acetyl-CoA
Phosphoenolpyruvate
1.1.1.21
2.7.1.105
/
3.1.3.46
2.3.1.12
sugar alcohols
1.1.1.14
sugars
4.1.1.32
allosteric
activation
+
2.7.1.2
fructose-
1,6-bis-P
2.7.1.11
oxaloacetate
glucose-6-P
2.7.1.40
citrate
2.3.3.8
oxaloacetate citrate
A
1.1.1.41
glutamine
ammoniaglutamate
amino acid
degradation
Rhbg
Slc1A4Slc1A2
6.3.1.2
urea
cycle
2.6.1.13
ornithine
ammonia
D
urocanate
N-formimino-
glutamate
histidine
N-methyl-
histamine
histamine
glutamate
2.1.2.5
4.3.1.3
4.2.1.49
2.1.1.8
serine
glycine
pyruvate
C
excretion
oxaloacetate
gluconeogenesis
4.3.1.17
1.4.4.2
4.1.1.32
4.3.1.19
cholesterol
citrate
acetyl-CoA
1.14.13.17
bile acids
2.3.3.8
oxaloacetate
4.1.1.32
gluconeo-
genesis
diacylglycerol
diacylglycerol-P
3.1.3.4
APOC2
activation
+
3.1.1.34
B
Lipo-
proteins
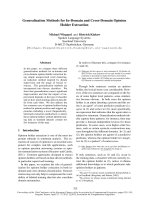
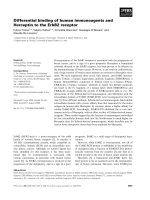
Fig. 3. Zonal differences in expression of genes encoding enzymes and other proteins involved in intermediary metabolism. Perivenous
expression is indicated by green, and genes with preferential periportal expression are indicated by red. (A) Perivenous zonation of glycolysis
and periportal zonation of gluconeogenesis. (B) Fatty acid degradation and cholesterol metabolism in periportal hepatocytes. (C) Elevated
amino acid degradation in periportal hepatocytes. (D) Ammonia utilization for glutamine synthesis in perivenous hepatocytes. EC 1.1.1.14,
L-iditol-2-dehydrogenase (sorbitol dehydrogenase) (gene name: Sdh); EC 1.1.1.21, aldehyde reductase (Akr1b3); EC 2.7.1.2, glucokinase;
EC 2.7.1.105 ⁄ EC 3.1.3.46, 6-phosphofructo-2-kinase ⁄ fructose-2,6-bisphosphatase (bifunctional enzyme) (PfkFB1); EC 2.7.1.11, 6-phospho-
fructokinase; EC 2.7.1.40, pyruvate kinase liver and red blood cell (Pklr); EC 2.3.1.12, dihydrolipoamide-S-transferase (E2 component of pyru-
vate dehydrogenase complex) (Dlat ); EC 1.1.1.41, isocitrate dehydrogenase NAD
+
(Idh3a); EC 4.1.1.32, phosphoenolpyruvate carboxykinase
1, cytosolic (pck1); EC 2.3.3.8, ATP citrate lyase (Acly); APOC2, apolipoprotein C-II (essential cofactor for the activation of lipoprotein lipase);
EC 3.1.1.34, lipoprotein lipase; EC 3.1.3.4, phosphatide phosphatase type 2c (Ppap2c); EC 1.14.13.17, cytochrome P450 7A1 (cholesterol-7-
a-monooxygenase) (Cyp7a1); EC 4.3.1.3, histidine ammonia lyase (Hal); EC 4.2.1.49, urocanase domain containing 1 (urocanate hydratase)
(Uroc1); EC 2.1.2.5, glutamate formiminotransferase (Ftcd); EC 2.1.1.8, histamine-N-methyltransferase (Hnmt); EC 1.4.4.2, glycine decarboxy-
lase (part of glycine dehydrogenase complex) (Gldc); EC 4.3.1.17, serine dehydratase (Sds); EC 4.3.1.19, serine dehydratase-like (Sdsl);
EC 2.6.1.13, ornithine aminotransferase (oat); EC 6.3.1.2, glutamate ammonia ligase (glutamine synthetase) (glul); Slc1A2, solute carrier 1A2;
Slc1A4, solute carrier 1A4; Rhbg, rhesus blood group-associated B glycoprotein.
A. Braeuning et al. Zonal gene expression in mouse liver
FEBS Journal 273 (2006) 5051–5061 ª 2006 The Authors Journal compilation ª 2006 FEBS 5055
such as cytochrome P450 oxidoreductase and receptors
activating enzymes of xenobiotic metabolism, namely
the constitutive androstane receptor and the aryl
hydrocarbon receptor, are also preferentially expressed
in hepatocytes near the central veins. Some exceptions
with preferential expression in periportal hepatocytes,
however, were also observed, such as sulfotransferase
5a1 and glutathione-S-transferase alpha 2.
Discussion
Upon separation of hepatocytes from the periportal
and perivenous zones of the liver lobule, 200 genes
or expressed sequence tags were identified, which were
differentially expressed between the two cell subpopu-
lations. These included several genes encoding enzymes
that are rate-limiting in distinct metabolic pathways of
intermediary metabolism and show well-established
zonal heterogeneity in liver [1–3], demonstrating
that they are, at least in part, regulated by zonal differ-
ences at the transcriptional level or by zonal-specific
post-transcriptional mechanisms affecting the stability
of their mRNAs.
The zonally expressed pathways showing striking
differences in mRNA levels of several genes are shown
in Figs 3 and 4. Among them are several genes enco-
ding enzymes participating in glycolysis that are prefer-
entially expressed in perivenous cells, whereas mRNAs
for key enzymes in gluconeogenesis, the antagonist
pathway to glycolysis, are primarily expressed in peri-
portal hepatocytes. These results confirm previous
observations on the zonation of glycolysis and glucone-
ogenesis in the liver, but also reveal zonal expression of
genes involved in glucose metabolism that have not
previously been reported as zonated. For example, peri-
venous localization was demonstrated for the mRNAs
of sorbitol dehydrogenase and aldehyde reductase,
which are involved in carbohydrate conversion
processes that provide glucose for further metabolism
in glycolysis. Neither of these enzymes has been pre-
viously reported to be differentially expressed between
perivenous and periportal hepatocytes. However, the
oxygen tension
glycolysis
gluconeogenesis
cholesterol
biosynthesis
bile acid synthesis
amino acid degradation
glutamine synthesis
metabolism of
xenobiotics
blood flow
fatty acid degradation
portal vein central vein
O
2
O
2
hormones,
growth factors
-catenin signaling
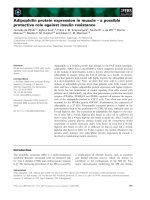
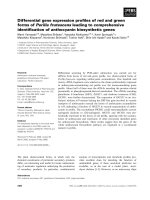
Fig. 4. Schematic representation of metabolic processes taking place in different hepatocyte subpopulations along the portocentral axis. The
figure summarizes the activities of zonated pathways shown in detail in Fig. 3 and additionally shows the gradients in oxygen tension, hor-
mones ⁄ growth factors, and b-catenin signaling that have been suspected to influence zonal gene expression in the liver [1,5,22,25].
Zonal gene expression in mouse liver A. Braeuning et al.
5056 FEBS Journal 273 (2006) 5051–5061 ª 2006 The Authors Journal compilation ª 2006 FEBS
mRNA for glucokinase, the key enzyme in initiation of
glucose degradation, was not found to be zonated in
our microarray analysis, which is in line with previous
observations that the preferential perivenous locali-
zation of glucokinase activity is regulated on a post-
translational level [7]. Other mRNAs, mainly expressed
in perivenous cells, code for 6-phosphofructo-2-kinase,
which produces fructose-2,6-bisphosphate, an allosteric
activator of the glycolytic enzyme 6-phosphofructo-1-
kinase and an inhibitor of the gluconeogenic enzyme
fructose-1,6-bisphosphatase [8]. The mRNA for the
latter enzyme was not zonated in our analysis, confirm-
ing a previous study describing homogeneous distri-
bution of 6-phosphofructo-1-kinase in the liver [9].
Dihydrolipoamide-S-transferase, the core component
of the pyruvate dehydrogenase complex, and isocitrate
dehydrogenase, an enzyme of the tricarboxylic acid
cycle, were also preferentially expressed in perivenous
hepatocytes. Perivenous zonation of citrate synthase is
in line with previous observations describing higher
perivenous activity of the enzyme in rat liver [10].
Although there are no previous reports describing
zonation of dihydrolipoamide-S-transferase, the prefer-
ential mRNA expression of isocitrate dehydrogenase
in perivenous hepatocytes is in accordance with
the known perivenous activity of this enzyme [11,12].
The only gene of the glycolytic pathway that is mainly
expressed in periportal hepatocytes is that encoding
pyruvate kinase. The metabolic capacity of the res-
pective protein, however, was found to be equally
distributed throughout the liver lobuli [13], or to be
even higher in the perivenous zone [14], suggesting a
post-transcriptional regulation mechanism for this
enzyme. On the other hand, periportal zonation
of gluconeogenesis and particularly of phosphoenol-
pyruvate carboxykinase, has been reported before [1].
Fatty acid degradation is another metabolic pathway
underlying zonal expression in liver, as two genes,
those encoding phosphatide phosphatase and apolipo-
protein C2, a cofactor for activation of lipoprotein
lipase, were found in our study to be preferentially
expressed in the periportal hepatocyte subpopulation.
Zonal-specific expression of these genes has not been
reported so far, but our findings are in line with previ-
ous observations of the periportal localization of fatty
acid degradation [15]. Bile acid synthesis from choles-
terol takes place in perivenous hepatocytes, as the key
enzyme of this metabolic pathway, cholesterol-7-a-
monooxygenase, is preferentially expressed in hepato-
cytes surrounding the central veins [16]. Our analysis
confirms previous findings on the zonation of choles-
terol-7-a-monooxygenase protein [17] and mRNA [16].
The mRNA levels for ATP citrate lyase, an enzyme
forming acetyl-CoA from citrate, thus providing sub-
strate molecules for cholesterol synthesis, were higher
in periportal hepatocytes, which is in line with a report
by Evans et al. [18] describing periportal localization
of the protein. However, another study found ATP cit-
rate lyase protein to be more active in the perivenous
zone [19]. Our microarray data, confirmed by real-time
PCR experiments, clearly demonstrate periportal local-
ization of the mRNA for this enzyme.
The metabolism of several amino acids has also been
reported to be differentially regulated in the two zones
of the liver [1–3]. Our present results indicate that his-
tidine degradation seems to take place mainly in peri-
portal hepatocytes, as mRNAs for several enzymes of
histidine catabolism, namely histidine ammonia lyase,
urocanate hydratase, glutamate formiminotransferase
and histamine-N-methyltransferase, are preferentially
expressed in periportal hepatocytes. Zonal-specific
expression of these genes in mouse liver has not been
reported in the literature so far. Comparable periportal
zonation on the mRNA level can be observed for the
Table 2. Zonated genes involved in xenobiotic metabolism. If
genes are represented by more than one probe set on the chip,
their individual log
2
ratios are shown. Genes preferentially
expressed in perivenous (pv) hepatocytes are indicated by positive
log
2
ratios, and periportal (pp) expression is indicated by negative
log
2
ratios.
Gene
Log
2
ratio(s)
pv versus pp
Cytochrome P450 2a4 ⁄ 2a5 6.43
Glutathione-S-transferase mu 3 4.36 ⁄ 2.31
Glutathione-S-transferase mu 2 4.19
Carboxylesterase 2 3.59
Glutathione-S-transferase mu 6 3.13
Cytochrome P450 2c50 ⁄ 2c54 2.98
Cytochrome P450 1a2 2.53
Cytochrome P450 2c55 2.35
Cytochrome P450 2c29 2.34
Cytochrome P450 2g1 2.00
Cytochrome P450 oxidoreductase 1.85
Cytochrome P450 2e1 1.69
Constitutive androstane receptor 1.65
Aryl-hydrocarbon receptor 1.53
Cytochrome P450 2c38 1.48
Glutathione-S-transferase alpha 3 1.34
Sulfotransferase 1B1 1.16
Sulfotransferase 1D1 1.03 ⁄ 1.01
Glutathione-S-transferase mu 1 1.01
Glutathione-S-transferase alpha 2 ) 1.09
Arsenic methyltransferase ) 1.51
Cytochrome P450 2f2 ) 2.67
Sulfotransferase 5a1 ) 3.03
Aldehyde dehydrogenase 1b1 ) 6.07
A. Braeuning et al. Zonal gene expression in mouse liver
FEBS Journal 273 (2006) 5051–5061 ª 2006 The Authors Journal compilation ª 2006 FEBS 5057
enzymes of serine ⁄ glycine metabolism: Glycine decarb-
oxylase, a component of the glycine dehydrogenase
complex that converts glycine to serine, is predomin-
antly expressed in periportal cells; the same holds true
for the enzymes of serine catabolism, namely serine
dehydratase and serine dehydratase-like. This is in
agreement with results of previous studies describing
periportal localization of serine dehydratase at the
mRNA level [20]. Enhanced serine metabolism in peri-
portal hepatocytes may contribute to the availability
of substrates for gluconeogenesis, a pathway that is
also located mainly in periportal hepatocytes [1]. By
contrast, glutamine synthesis occurs mainly in peri-
venous hepatocytes, as mRNA for GS, the key
enzyme, is specifically expressed in this hepatocyte sub-
population, which is in accordance with previous
observations [4]. Notably, mRNAs for transporters
participating in ammonia and glutamate uptake also
show preferential perivenous localization, thus provi-
ding the substrates for GS. The ammonium transporter
rhesus blood group-associated B glycoprotein has been
previously reported to be expressed only in perivenous
hepatocytes at both the protein [21] and mRNA [22]
levels. Zonation of the glutamate transporter solute
carrier 1A2 has already been established [23], whereas
the preferential perivenous localization of solute carrier
1A4 has not been described so far. The urea cycle has
been reported to be mainly localized in periportal
hepatocytes [1,2]. Our data now suggest that this
localization is based on differences in mRNA levels of
four enzymes of the urea cycle.
Whereas the zonal-specific expression of the main
enzymes of drug and xenobiotic metabolism has been
the subject of extensive research (e.g. cytochrome P450
zonation [5]), the zonal expression profiles of the more
uncommon cytochrome P450 isoforms have mostly not
been described in the literature. For example, up to
now cytochrome P450 2G1 (Cyp2g1) has been consid-
ered to be exclusively expressed in the olfactory
mucosa in mammals [24]. Whereas the mRNAs for
most xenobiotic-metabolizing enzymes are mainly
expressed in hepatocytes near the central veins, a small
number of these enzymes exhibit preferential periportal
expression. The periportal localization of these
mRNAs has not been reported in the literature so far.
The mechanisms underlying zonal gene expression in
the liver are not yet fully understood. Based on compari-
sons of mRNA ⁄ protein expression patterns of perive-
nous and periportal hepatocytes with those of liver
tumors containing activating mutations in either the
Ha-ras or ctnnb1 (catnb; b-catenin) gene, we developed
the hypothesis that two opposing signaling pathways
triggered by Ha-ras- and b-catenin-dependent factors
may determine zonal differences in gene expression in
murine liver [22]. In addition, the adenomatous poly-
posis coli (APC) tumor suppressor gene, an important
regulator of b-catenin signaling, has also been estab-
lished as a ‘zonation-keeper’ in mouse liver [25]. Further
studies, however, are required to unravel the molecular
details and interplay of the various players involved.
In summary, our findings show that several of the
well-documented zonal differences in the levels and
activities of key enzymes of various pathways of inter-
mediary metabolism can be explained, at least in part,
by corresponding differences at the mRNA level in
periportal and perivenous hepatocytes, indicating that
regulation at the transcriptional level or by mecha-
nisms controlling mRNA stability are important fac-
tors determining their zonal expression in liver. In
addition, we found that several other genes with
unknown localization in the liver show distinct expres-
sion differences between periportal and perivenous
hepatocytes. Among these are genes coding for
proteins involved in well-established zonated but also
other pathways that have not been described so far as
being differentially expressed in murine liver.
Experimental procedures
Animal experiments
For microarray analysis of mRNA expression patterns in
periportal and perivenous hepatocyte subpopulations, male
C3H ⁄ He mice were killed at 10 weeks of age and hepatocyte
fractions were isolated as described below. Mice were kept on
a 12 h dark ⁄ light cycle and were killed between 9 and 11 a.m.
to avoid circadian influences. Animals received humane
care, and protocols complied with institutional guidelines.
Isolation of hepatocytes
Periportal and perivenous subpopulations of hepatocytes
were isolated and enriched by combined digitonin ⁄ collage-
nase perfusion of the liver according to Taniai et al. [26],
with minor modifications as described previously [22]. First,
the liver was perfused for 10 min with Krebs ⁄ Henseleit buf-
fer at 37 °C. To obtain periportal hepatocyte subpopula-
tions, a 5 mm digitonin solution was infused for 10 s
through the vena cava and then immediately flushed out
from the opposite direction. To obtain perivenous hepato-
cytes, the digitonin solution was infused through the portal
vein. After digitonin treatment, the liver was perfused with
collagenase solution. Subsequently, viable hepatocytes were
separated by density gradient centrifugation. Viability of
the resulting hepatocyte fractions was always 80–90% as
determined by trypan blue staining. The efficiency of
Zonal gene expression in mouse liver A. Braeuning et al.
5058 FEBS Journal 273 (2006) 5051–5061 ª 2006 The Authors Journal compilation ª 2006 FEBS
separation of hepatocytes into periportal and perivenous
subfractions was determined by real-time RT-PCR analysis
of GS expression and western blotting for marker proteins
as described below.
Microarray analysis and statistical evaluation
of data
The Affymetrix GeneChip MOE-430A (Affymetrix, Santa
Clara, CA, USA) was used for mRNA expression profiling.
Six chips were hybridized with cRNA from three periportal
and three perivenous hepatocyte isolates, obtained from
independent liver perfusions. RNA quality was controlled
with the Laboratory-on-Chip-System Bioanalyzer 2100
(Agilent, Palo Alto, CA, USA). Data normalization and
statistical analysis was carried out essentially as previously
described [27]. To analyze expression differences in the two
cell populations, we used a threshold of 0.1 for the false
discovery rate adjusted P-values and selected only those
probe sets that showed Œlog
2
expression ratios Œ‡ 1 (equival-
ent to a ‡ 2-fold change). The former cutoff was chosen to
keep the expected proportion of false-positives below 10%.
The latter was chosen because expression differences smal-
ler than two-fold are very difficult to detect by quantitative
RT-PCR, which was used in this study for verification of
the microarray results. We additionally investigated our
dataset, however, using less stringent conditions (Œlog
2
expression ratio Œ‡ 0.5), but the results are only mentioned
in the text in those instances when genes are affected
encoding enzymes within pathways that were found to
show significant differences in mRNA levels when analyzed
at the more stringent cutoff.
Western analysis
Cells were homogenized in WCE [50 mm Hepes, 150 mm
NaCl, 10% (v ⁄ v) glycerol, 1% (v ⁄ v) Triton X-100, 1.5 mm
MgCl
2
,1mm EGTA, 100 mm NaF, 10 mm NaP
2
O
7
,
200 lm Na
3
VO
4
] buffer plus protease inhibitor cocktail
(Complete Mini, Roche, Mannheim, Germany). Protein
concentrations were estimated using the Bradford assay.
Western blotting was carried out as recently described [22]
using antibodies against GS (1 : 5000 dilution; Sigma, Tauf-
kirchen, Germany), E-cadherin (1 : 1000; Transduction
Laboratories, Lexington, KY, USA), G-protein-coupled
receptor 49 (1 : 1000; Affinity BioReagents, Golden, CO,
USA), glyceraldehyde-3-phosphate dehydrogenase (1 : 1,000;
Chemicon, Hampshire, Chandler’s Ford, UK) and cyto-
chrome P450 1A (1 : 1000; gift of R Wolf, Biomedical
Research Centre, University of Dundee, UK). Antibody
binding was visualized using appropriate alkaline phospha-
tase-conjugated secondary antibodies (1 : 10 000; Tropix,
Applied Biosystems, Weiterstadt, Germany) and CDP-Star
as a substrate. Chemoluminescence signals were monitored
by use of a CCD camera system.
Quantitative determination of mRNAs by RT-PCR
Total RNA was isolated with Trizol reagent (Invitrogen,
Karlsruhe, Germany). RNA was purified using the RNeasy
Table 3. PCR primers.
Gene
Forward
(5¢-to3¢)
Reverse
(5¢-to3¢)
Glul GCGAAGACTTTGGGGTGATA GTGCCTCTTGCTCAGTTTGTC
Oat TGGCGGTTTATACCCTGTG CATTTAGCAACCCTTTCCCT
Sds CACAGTTGAAGTGGTGGGAGA CCACAGACAGCACGATAGCC
Pfkfb1 GACCACGTTCAAAGCCGTAC TCTTCACAGAGCCCCGCATC
Pck1 ATTGAACTGACAGACTCGCCCTAT TTCCCACCATATCCGCTTCC
Cyp1a2 GAGCGCTGTATCTACATAAACCA GGGTGAACATGATAGACACTATTGT
Cyp2e1 TCCCTAAGTATCCTCCGTGA GTAATCGAAGCGTTTGTTGA
Cyp2f2 AAAGAAGCATCGAGGAGC CGAAGACGACAGAGCAGAT
Sult5a1 TCACCTCCCACTTGAACGC AACCAGGAGCCGAAGAAGC
Aldh1b1 GACCGGAGAACGCTGATACTAGA GGGATTGGGTTCGGGAGA
Cyp7a1 TCCCTGTCATACCACAAAGTCT GGTAGCAGAAGGCATACATCC
Acly GAACTTTCTCATTGAACCCTTCG CCTCAGGTGCATGGACCAAC
Ctsc GAAGTTCCCGAAGCGACATTA CACCTTCTTGCCAACAAAGC
Gpr49 AATCGCGGTAGTGGACATTC GATTCGGAAGCAAAAATGGA
Nr1i3 AACAACAGTCTCGGCTCCAAA AGCATTTCATTGCCACTCCC
Ahr GTCAAATCCTTCTAAGCGACACA AACCAGCACAAAGCCATTCA
Hes1 GACTGTGAAGCACCTCCGG GGTAGGTCATGGCGTTGATC
Ctnnbip1 ACCGCCAGTGAGGAGGAATT GGTGCAAAGGGTAAGAAGACG
Cdh1 TCTACCAAAGTGACGCTGAA GCTGATGGGAGGGATGAC
Rhbg TACAACCACGAAACCGACG CAAACTCTCCACGCCAACA
18S rRNA CGGCTACCACATCCAAGGAA GCTGGAATTACCGCGGCT
A. Braeuning et al. Zonal gene expression in mouse liver
FEBS Journal 273 (2006) 5051–5061 ª 2006 The Authors Journal compilation ª 2006 FEBS 5059
Mini Kit (Qiagen, Hilden, Germany). Five hundred nano-
grams of total RNA were reverse transcribed into cDNA
by avian myeloblastosis virus-RT (Promega, Mannheim,
Germany) using standard methods and oligo(dT)
18
and
random(dN)
6
primers. Expression analysis was performed
using the LightCycler real-time PCR system (Roche,
Mannheim, Germany). Expression of 18S rRNA was used
for normalization. The primer pairs used for PCR amplifi-
cation are given in Table 3.
Acknowledgements
We gratefully acknowledge the excellent technical
assistance of Elke Zabinsky and Silvia Vetter. We also
thank Dr R. Wolf for the gift of Cyp1A antibody.
This study was supported by the Deutsche Krebshilfe
(grant 106356).
References
1 Jungermann K & Katz N (1989) Functional speciali-
zation of different hepatocyte populations. Physiol Rev
69, 708–764.
2 Gebhardt R (1992) Metabolic zonation of the liver:
regulation and implications for liver function. Pharma-
col Ther 53, 275–354.
3 Jungermann K & Kietzmann T (1996) Zonation of par-
enchymal and nonparenchymal metabolism in liver.
Annu Rev Nutr 16, 179–203.
4 Gebhardt R & Mecke D (1983) Heterogeneous distribu-
tion of glutamine synthetase among rat liver parenchymal
cells in situ and in primary culture. EMBO J 2, 567–570.
5 Oinonen T & Lindros KO (1998) Zonation of hepatic
cytochrome P-450 expression and regulation. Biochem J
329, 17–35.
6 Lemaigre FP & Rousseau GG (1994) Transcriptional
control of genes that regulate glycolysis and gluconeo-
genesis in adult liver. Biochem J 303, 1–14.
7 Eilers F, Bartels H & Jungermann K (1993) Zonal
expression of the glucokinase gene in rat liver.
Dynamics during the daily feeding rhythm and starva-
tion–refeeding cycle demonstrated by in situ hybridiza-
tion. Histochemistry 99, 133–140.
8 Rider MH, Bertrand L, Vertommen D, Michels PA,
Rousseau GG & Hue L (2004) 6-Phosphofructo-2-kinase
⁄ fructose-2,6-bisphosphatase: head-to-head with a
bifunctional enzyme that controls glycolysis. Biochem J
381, 561–579.
9 Frederiks WM, Marx F & van Noorden CJ (1991)
Homogeneous distribution of phosphofructokinase in
the rat liver acinus: a quantitative histochemical study.
Hepatology 14, 634–639.
10 Tosh D, Alberti GM & Agius L (1988) Glucagon regu-
lation of gluconeogenesis and ketogenesis in periportal
and perivenous rat hepatocytes. Heterogeneity of hor-
mone action and of the mitochondrial redox state.
Biochem J 256, 197–204.
11 Wimmer M & Pette D (1979) Microphotometric studies
on intraacinar enzyme distribution in rat liver. Histo-
chemistry 64, 23–33.
12 Agius L & Tosh D (1990) Acinar zonation of cytosolic
but not organelle-bound activities of phosphoenolpyru-
vate carboxykinase and aspartate aminotransferase in
guinea-pig liver. Biochem J 271, 387–391.
13 Jones CG & Titheradge MA (1996) Measurement of
metabolic fluxes through pyruvate kinase, phosphoenol-
pyruvate carboxykinase, pyruvate dehydrogenase, and
pyruvate carboxylate in hepatocytes of different acinar
origin. Arch Biochem Biophys 326 , 202–206.
14 Zierz S, Katz N & Jungermann K (1983) Distribution
of pyruvate kinase type L and M2 in microdissected
periportal and perivenous rat liver tissue with different
dietary states. Hoppe Seylers Z Physiol Chem 364,
1447–1453.
15 Guzman M & Castro J (1989) Zonation of fatty acid
metabolism in rat liver. Biochem J 264, 107–113.
16 Twisk J, Hoekman MF, Mager WH, Moorman AF, de
Boer PA, Scheja L, Princen HM & Gebhardt R (1995)
Heterogeneous expression of cholesterol 7 alpha-hydro-
xylase and sterol 27-hydroxylase genes in the rat liver
lobulus. J Clin Invest 95, 1235–1243.
17 Ugele B, Kempen HJ, Kempen JM, Gebhardt R, Meijer
P, Burger HJ & Princen HM (1991) Heterogeneity of
rat liver parenchyma in cholesterol 7 alpha-hydroxylase
and bile acid synthesis. Biochem J 276, 73–77.
18 Evans JL, Quistorff B & Witters LA (1989) Zonation of
hepatic lipogenic enzymes identified by dual-digitonin-
pulse perfusion. Biochem J 259, 821–829.
19 Katz NR, Fischer W & Ick M (1983) Heterogeneous
distribution of ATP citrate lyase in rat-liver parench-
yma. Microradiochemical determination in microdis-
sected periportal and perivenous liver tissue. Eur J
Biochem
130, 297–301.
20 Ogawa H & Kawamata S (1995) Periportal expression
of the serine dehydratase gene in rat liver. Histochem J
27, 380–387.
21 Weiner ID, Miller RT & Verlander JW (2003) Localiza-
tion of the ammonium transporters, Rh B glycoprotein
and Rh C glycoprotein, in the mouse liver. Gastro-
enterology 124, 1432–1440.
22 Hailfinger S, Jaworski M, Braeuning A, Buchmann A &
Schwarz M (2006) Zonal gene expression in murine
liver: lessons from tumors. Hepatology 43, 407–414.
23 Cadoret A, Ovejero C, Terris B, Souil E, Levy L,
Lamers WH, Kitajewski J, Kahn A & Perret C (2002)
New targets of beta-catenin signaling in the liver are
involved in the glutamine metabolism. Oncogene 21,
8293–8301.
Zonal gene expression in mouse liver A. Braeuning et al.
5060 FEBS Journal 273 (2006) 5051–5061 ª 2006 The Authors Journal compilation ª 2006 FEBS
24 Ding X & Coon MJ (1994) Steroid metabolism by
rabbit olfactory-specific P450 2G1. Arch Biochem
Biophys 315, 454–459.
25 Benhamouche S, Decaens T, Godard C, Chambrey R,
Rickman DS, Moinard C, Vasseur-Cognet M, Kuo CJ,
Kahn A, Perret C et al. (2006) Apc tumor suppressor
gene is the ‘zonation-keeper’ of mouse liver. Dev Cell
10, 759–770.
26 Taniai H, Hines IN, Bharwani S, Maloney RE, Nimura
Y, Gao B, Flores SC, McCord JM, Grisham MB & Aw
TY (2004) Susceptibility of murine periportal hepato-
cytes to hypoxia-reoxygenation: role for NO and Kupf-
fer cell-derived oxidants. Hepatology 39, 1544–1552.
27 Stahl S, Ittrich C, Marx-Stoelting P, Ko
¨
hle C, Altug-
Teber O, Riess O, Bonin M, Jobst J, Kaiser S, Buchmann
A et al. (2005) Genotype–phenotype relationships in
hepatocellular tumors from mice and man. Hepatology
42, 353–361.
Supplementary material
The following supplementary material is available
online:
Table S1. Gene expression in perivenous versus peri-
portal hepatocytes.
This material is available as part of the online article
from
A. Braeuning et al. Zonal gene expression in mouse liver
FEBS Journal 273 (2006) 5051–5061 ª 2006 The Authors Journal compilation ª 2006 FEBS 5061