Báo cáo khoa học: Characterization of mutations in crucial residues around the Qo binding site of the cytochrome bc1 complex from Paracoccus denitrificans pdf
Bạn đang xem bản rút gọn của tài liệu. Xem và tải ngay bản đầy đủ của tài liệu tại đây (390.89 KB, 13 trang )
Characterization of mutations in crucial residues around
the Q
o
binding site of the cytochrome bc
1
complex from
Paracoccus denitrificans
Thomas Kleinschroth
1
, Oliver Anderka
1
, Michaela Ritter
2
, Andreas Stocker
1,2
, Thomas A. Link
2
,
Bernd Ludwig
1
and Petra Hellwig
3
1 Institut fu
¨
r Biochemie der Johann Wolfgang Goethe Universita
¨
t, Molekulare Genetik, Biozentrum, Frankfurt am Main, Germany
2 Institut fu
¨
r Biophysik der Johann Wolfgang Goethe Universita
¨
t, Frankfurt am Main, Germany
3 Institut de Chimie, UMR 7177 CNRS, Laboratoire de Spectroscopie Vibrationnelle et Electrochimie des Biomole
´
cules, Universite
´
Louis
Pasteur, Strasbourg, France
Ubiquinol–cytochrome c oxidoreductase (cytochrome
bc
1
complex; complex III) [1] is a fundamental compo-
nent of the respiratory electron transfer chains located
in the inner mitochondrial or bacterial cytoplasmic
membrane. As a minimum requirement, all bc
1
com-
plexes contain three catalytic subunits: cytochrome c
1
Keywords
bc
1
complex; FTIR spectroscopy;
Paracoccus denitrificans; proton and
electron transfer; quinones
Correspondence
P. Hellwig, Institut de Chimie, UMR 7177
CNRS, Laboratoire de Spectroscopie
Vibrationnelle et Electrochimie des
Biomole
´
cules, Universite
´
Louis Pasteur 4,
rue Blaise Pascal, 67000 Strasbourg, France
Fax: +33 390 241431
Tel: +33 390 241273
E-mail:
(Received 31 March 2008, revised 14 June
2008, accepted 28 July 2008)
doi:10.1111/j.1742-4658.2008.06611.x
The protonation state of residues around the Q
o
binding site of the cyto-
chrome bc
1
complex from Paracoccus denitrificans and their interaction
with bound quinone(s) was studied by a combined electrochemical and
FTIR difference spectroscopic approach. Site-directed mutations of two
groups of conserved residues were investigated: (a) acidic side chains
located close to the surface and thought to participate in a water chain
leading up to the heme b
L
edge, and (b) residues located in the vicinity of
this site. Interestingly, most of the mutants retain a high degree of catalytic
activity. E295Q, E81Q and Y297F showed reduced stigmatellin affinity. On
the basis of electrochemically induced FTIR difference spectra, we suggest
that E295 and D278 are protonated in the oxidized form or that their
mutation perturbs protonated residues. Mutations Y302, Y297, E81 and
E295, directly perturb signals from the oxidized quinone and of the protein
backbone. By monitoring the interaction with the inhibitor stigmatellin for
the wild-type enzyme at various redox states, interactions of the bound
stigmatellin with amino acid side chains such as protonated acidic residues
and the backbone were observed, as well as difference signals arising from
the redox active inhibitor itself and the replaced quinone. The infrared
difference spectra of the above Q
o
site mutations in the presence of stigma-
tellin confirm the previously established role of E295 as a direct interaction
partner in the enzyme from P. denitrificans as well. The protonated residue
E295 is proposed to change the hydrogen-bonding environment upon
stigmatellin binding in the oxidized form, and is deprotonated in the
reduced form. Of the residues located close to the surface, D278 remains
protonated and unperturbed in the oxidized form but its frequency shifts in
the reduced form. The mechanistic implications of our observations are
discussed, together with previous inhibitor binding data, and referred to
the published X-ray structures.
Abbreviations
bc
1
complex, ubihydroquinone–cytochrome c oxidoreductase; b
H,
high-potential b-type heme; b
L,
low-potential b-type heme; DDM, n-dodecyl
b-
D-maltoside; Q
i,
ubiquinone reduction site; Q
o,
ubiquinol oxidation site.
FEBS Journal 275 (2008) 4773–4785 ª 2008 The Authors Journal compilation ª 2008 FEBS 4773
with covalently bound c-type heme, cytochrome b with
two b-type hemes (b
L
and b
H
), and the Rieske iron sul-
fur protein with a [2Fe–2S] cluster. Crystal structures
of several mitochondrial complexes that contain addi-
tional subunits have been reported [2–5]. Recently, a
new crystal structure for a bacterial complex has been
solved [6].
The enzyme couples the electron transfer from
ubiquinol to cytochrome c to the translocation of pro-
tons across the membrane. Both bacterial and mito-
chondrial bc
1
complexes follow the same catalytic
mechanism, the so-called Q-cycle [7–9], which relies on
two separate binding sites for quinones, Q
o
and Q
i
.
The Q
o
site is located close to heme b
L
and the [2Fe–
2S] cluster, and the Q
i
site is close to heme b
H
on the
opposite side of the membrane. Although this mech-
anism is generally accepted, not all aspects of the
quinol ⁄ quinone binding and redox reaction are yet
fully understood at the molecular level, and various
models for the quinol oxidation mechanism at the Q
o
site have been discussed [10–15].
Inhibitors are an important tool for analysis of the
molecular mechanism of the bc
1
complex, and have
been extensively used to characterize the various qui-
none binding sites [16]. Depending on their binding
properties, Q
o
and Q
i
site-specific inhibitors may be
distinguished. Stigmatellin binds at the Q
o
site and
interacts with the Rieske protein and cytochrome b,
and also influences the heme b
L
spectral properties.
The crystal structure of the bc
1
complex with stigma-
tellin bound at the Q
o
site [2] shows tight and specific
binding of the inhibitor. The position of the conju-
gated trienes is stabilized by several van der Waals
interactions with cytochrome b residues. The chromone
headgroup is oriented by numerous nonpolar and a
few polar interactions, including a hydrogen bond
from the carbonyl group (4-C = O) to His155 (His188
in yeast), one of the [2Fe–2S] cluster ligands of the
Rieske protein, which is thereby fixed in a cyto-
chrome b docking position [2] (unless otherwise indi-
cated, numbering of the amino acids corresponds to
the Paracoccus denitrificans bc
1
complex). On the heme
b
L
facing side of the inhibitor, the 8-hydroxy group is
within hydrogen-bonding distance of the side chain of
cytochrome b residue Glu295 (272 in yeast). Bound
stigmatellin is thought to mimic an intermediate of
ubiquinol oxidation [2]. Based on published structures
and biochemical characterization of variants, Glu295
has been proposed to be part of the proton exit path-
way for ubiquinol oxidation [2,16].
The cytochrome bc
1
complex of P. denitrificans
represents a small bacterial version of the mitochon-
drial enzyme, lacking any additional subunits. Its 3D
structure is not yet known; however, due to extensive
sequence identity, mostly in the cytochrome b and
Rieske subunits, a similar architecture for the three
catalytic subunits between the mitochondrial and the
bacterial complex is assumed. In order to probe poten-
tial similarities and dissimilarities, we have investigated
the Q
o
site of the bc
1
complex from P. denitrificans by
a combination of site-directed mutagenesis, protein
electrochemistry and FTIR difference spectroscopy.
Reaction-induced FTIR spectroscopy is a method that
is suitable for the study of the protonation state of
acidic residues or quinone binding as described previ-
ously for several membrane proteins including bc
1
com-
plexes [17–22]. Identification of interaction partners for
stigmatellin binding in the oxidized and reduced forms
as well as the protonation state of the residues involved
in proton transfer are described and discussed in the
light of studies on bc
1
complexes from other organisms.
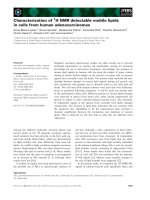
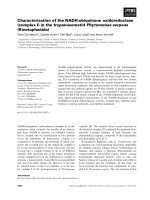
The mutated residues are highlighted in Fig. 1.
Results
Site-directed mutations in the Q
o
binding site
Mutations in conserved positions of cytochrome b at
the Q
o
site were constructed (Fig. 1). The three subun-
its of the P. denitrificans bc
1
complex are expressed in
all mutants and assembled into a stable complex that
corresponds to the wild-type enzyme as determined
by SDS–PAGE and Western blot analysis. After
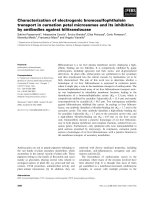
Fig. 1. 3D representation of the Q
o
site environment of the cyto-
chrome bc
1
complex based on the structure obtained from Rhodob-
acter sphaeroides [46]. Cytochrome c
1
is shown in blue,
cytochrome b in red, and the Rieske protein in green. The iron–sul-
fur cluster is shown in purple and yellow, and the bound inhibitor
stigmatellin is shown in turquoise. Heme is shown in light purple,
and the heme iron is shown in purple. Mutations of conserved
amino acids introduced in seven positions of the P. denitrificans
enzyme are indicated as follows: 1, D71 ⁄ 86 (mitochondrial ⁄ bacte-
rial complex); 2, E66 ⁄ 81; 3, D255 ⁄ 278; 4, Y132 ⁄ 147; 5, E272 ⁄ 295;
6, Y274 ⁄ 297; 7, Y279 ⁄ 302.
Infrared spectroscopic characterization of mutations in the Q
o
site T. Kleinschroth et al.
4774 FEBS Journal 275 (2008) 4773–4785 ª 2008 The Authors Journal compilation ª 2008 FEBS
solubilization, the complex was purified using a
DEAE–Sepharose column, and the cytochrome bc
1
eluted as a single peak. Samples were > 95% pure as
determined by silver staining. The ubiquinol–cyto-
chrome c oxidoreductase activities of the purified com-
plexes were measured in buffer containing n-dodecyl
b-d-maltoside and compared to that of the wild-type
enzyme (Table 1).
The activities of the E81Q, D278N, Y297F and
Y302F mutant enzymes ranged from 90% to 120% of
that of the wild-type enzyme. Significantly reduced
activity (66 and 55%) was observed for the D86N and
Y147F mutant enzymes. A drastic reduction in turn-
over was seen for the E295Q mutation, with only 10%
residual activity. The activity of the wild-type and all
mutant complexes is strongly inhibited to < 1% of
wild-type activity by the addition of 2 lm of the inhib-
itor stigmatellin. IC
50
values, defined as the inflection
point of the curve, are listed in Table 1. Interestingly
the E81Q mutant enzyme showed both a slightly
increased turnover and also an increased IC
50
value. A
distinct increase of the IC
50
value was observed for the
E295Q and Y147F mutant enzymes.
FTIR difference spectra of mutations in the Q
o
binding site
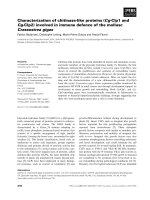
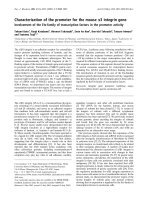
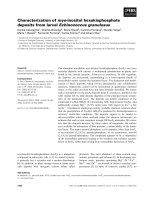
Figure 2 shows an overview of the oxidized-minus-
reduced FTIR difference spectra of the E295Q,
D278N, E81Q and D86N mutant enzymes in compari-
son with wild-type. The redox-induced FTIR difference
spectra include contributions from reorganization of
the cofactors, heme b
L
, b
H
and c
1
, the bound quinones,
individual amino acids, the backbone and coupled pro-
tonation reactions. All purified mutants retained their
bound quinones, as their spectra include the character-
istic contributions that dominate the overall spectrum
of the P. denitrificans bc
1
complex, such as the typical
contribution of the methoxy side chain at 1264 cm
)1
,
as detailed below. The number of molecules of quinone
per bc
1
monomer has been reported as 2.6–3.3 for this
type of preparation [19].
Contribution of acidic side chains
For the redox-induced FTIR difference spectra of the
E295Q, D278N and D86N mutant enzymes, the signals
in the spectral region characteristic for protonated
Table 1. Enzymatic activities and IC
50
values for stigmatellin of
purified cytochrome bc
1
mutants at the Q
o
quinone binding site.
Values are the means of triplicate measurements.
Enzyme ⁄ mutant
Percentage
of the activity
in wild-type
IC
50
fold
increase
over wild-type
Wild-type 100
a
1
b
E81Q 120 3.5
D86N 66 1.4
D278N 105 1.3
E295Q 10 4.6
Y147F 55 5.2
Y297F 90 2.0
Y302F 95 2.1
a
100% indicates a turnover number of 327 s
)1
based on one cyto-
chrome b (per monomer).
b
1 indicates an IC
50
value for the wild-
type of 131 ± 7 n
M under our experimental conditions.
1800 1700 1600 1500 1400 1300 1200
1455
1559
1474
1560
Δ Abs
0.001
1656
1654
1746 1746
1726
1724
1656
1656
1570
1724
1694
1628
1612
1561
1540
1289
1432
1496
1470
1264
1658
1746
WT
E295Q
D278N
E81Q
D86N
Wavenumber (cm
–1
)
1800 1750
D278N
(cm
–1
)
E295Q
E81Q
1743
Fig. 2. Overview of the oxidized-minus-reduced FTIR difference
spectra of wild-type and acidic side-chain mutant cytochrome bc
1
complexes from P. denitrificans obtained for a change in potential
from )0.292 to +0.708 V. The inset shows double difference spec-
tra obtained by subtracting the wild-type red-ox difference spec-
trum from that of each mutant.
T. Kleinschroth et al. Infrared spectroscopic characterization of mutations in the Q
o
site
FEBS Journal 275 (2008) 4773–4785 ª 2008 The Authors Journal compilation ª 2008 FEBS 4775
acidic residues were perturbed. The decrease is shown
in the inset to Fig. 2, showing double difference spec-
tra obtained by subtracting the spectrum of the
E295Q, D278N and E81Q variants from that of the
wild-type. Both D278N and E295Q show a decrease in
the mode at 1746 cm
)1
associated with the oxidized
form, without a complete loss of the signal (see Fig. 4
below), so both residues may contribute to this signal
or indirectly influence the contributing C = O group.
In the case of the D86N mutant enzyme, the negative
mode at 1724 cm
)1
is decreased. In contrast, the E81Q
mutation does not induce changes in this region. In
the spectral range that includes the signals for deproto-
nated acidic side chains [23–27], clear variations occur
at 1560 cm
)1
for E295Q, at 1563 cm
)1
for D86N and
at 1559 cm
)1
for D278N, at positions typical for the
d(COO
)
)
as
vibrational mode. The d(COO
)
)
s
vibra-
tional mode can be tentatively assigned to the shifts
observed between 1455 and 1423 cm
)1
. These shifts
may be attributed to the acidic residues that are per-
turbed due to the mutations or alternatively loss of
interaction with the heme propionates from the nearby
heme b.
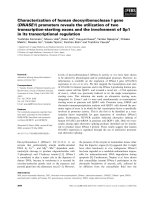
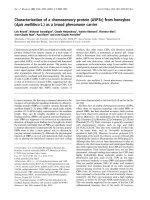
Contributions from tyrosine side chains
Figure 3 gives an overview on the oxidized-minus-
reduced FTIR difference spectra of the Y147F, Y297F
and Y302F mutant enzymes in comparison with wild-
type. The wild-type spectrum shows contributions in
the spectral range around 1516 and 1500 cm
)1
that are
characteristic of tyrosine side chains. In previously
reported model spectra of the protonated tyrosine, the
signal at approximately 1518 cm
)1
was attributed to
the m
19
(CC) ring mode. At 1249 cm
)1
, a signal com-
posed of the m
7’a
(CO) vibration and the d(COH) vibra-
tion is expected, and the position is sensitive to the
hydrogen-bonding environment [23,25,28,29]. For
deprotonated tyrosine in solution, the m
8a
⁄
8b
(CC) ring
mode was identified at 1560 cm
)1
and the m
19
(CC) ring
mode at 1499 cm
)1
, thus reflecting the sensitivity of
the ring modes to the protonation state of the phenyl
group. The m
7’a
(CO) mode was present at 1269 cm
)1
.
In the difference spectra shown in Fig. 3, changes
were only observed for the Y302F and the Y297F
mutant enzymes. These shifts are rather small as com-
pared to previously published absorption coefficients
for these modes [23,25,28,29]. In the spectra of the
Y302F mutation, the signal at 1666 cm
)1
is absent.
This spectral range typically includes contributions
from the m(C = O) mode of the backbone or proton-
ated heme propionates. Additionally, we suggest the
perturbation of arginine side chains. This is supported
by model compound studies that indicated that vibra-
tional modes are expected at 1673 cm
)1
for m(C = N),
1633 cm
)1
for d(NH
3
+
)
as
and 1522 cm
)1
for d(NH
3
+
)
s
[23,25]. For the Y302 mutant, perturbations were seen
at 1666, 1626 and 1522 cm
)1
.
Contributions of the quinones and the protein
backbone
In redox-induced FTIR difference spectra of quinones
in solution, the positive signals between 1670 and
1540 cm
)1
, as well as at 1610, 1288, 1264 and
1204 cm
)1
, correlate with the neutral quinone, while
the negative signals at 1490, 1470, 1432 and 1388 cm
)1
represent the reduced and protonated quinol form. The
mode between 1670 and 1640 cm
)1
was previously
assigned to the C = O vibration of the quinone, and
the mode at 1610 cm
)1
was attributed to the C = C
vibration [32–34]. The C–O modes of the methoxy
groups contribute to the signals at 1288 and 1264 cm
)1
.
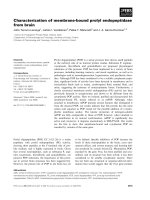
Figure 4 shows the spectra after hydrogen ⁄ deuterium
(H ⁄ D) exchange, and an enlarged view for the wild-type,
E295Q and D278N mutant enzymes before the exchange.
1522
1626
1666
1264
1516
1575
1561
1561
1520
1516
1507
1507
Δ
Abs
1540
1507
1540
1540
1800 1700 1600 1500 1400 1300 1200
1658
1644
1644
1644
1658
1656
1746 1746
1746
1644
1550
1508
1498
1520
1630
1658
1746
0.001
wt
Y297F
Y302F
Y147F
Wavenumber (cm
–1
)
Fig. 3. Overview of the oxidized-minus-reduced FTIR difference
spectra of wild-type and tyrosine side-chain mutant cytochrome bc
1
complexes from P. denitrificans obtained for a change in potential
from )0.292 to +0.708 V.
Infrared spectroscopic characterization of mutations in the Q
o
site T. Kleinschroth et al.
4776 FEBS Journal 275 (2008) 4773–4785 ª 2008 The Authors Journal compilation ª 2008 FEBS
The effect of H ⁄ D exchange has been described pre-
viously [19]. Interestingly, the strong positive feature
around 1655 cm
)1
, previously tentatively assigned to
the m(C = O) mode of neutral, fully oxidized quinones,
is perturbed in most of the mutants. The position of
this vibration is dependent on hydrogen bonding to the
C = O group, as previously found in quinone spectra
of other enzymes [32–34]. The most prominent shift
occurs for the E295Q mutation, for which an increase
of the shoulder at 1646 cm
)1
is observed (Figs 2 and 4,
insets), indicating that at least one of the involved
quinones experiences weaker hydrogen bonding. Simi-
larly, the signal at 1639 cm
)1
is significantly increased
in the H ⁄ D-exchanged sample. We note, however, that
these changes may also originate from contributions of
the protein backbone, varied due to the mutations.
Another potential explanation for the variation in
signal intensity seen for the various mutants might be
the differences in quinone content; however, other
characteristic signals of the quinone, such as the
mode at 1264 cm
)1
(1266 cm
)1
in the H ⁄ D-exchanged
sample) remain unperturbed (Fig. 3). As an alternative
explanation for the loss of signal intensity, e.g. for the
E81Q mutation, the dependence of the m(C = O) signal
for up to 50% of its intensity on the orientation of the
methoxy side chains in relation to the position of the
quinone ring should be noted, as previously reported
[36]. The change in intensity was confirmed in the
H ⁄ D-exchanged sample, for which the signals at 1655
and 1639 cm
)1
both strongly decrease due to the muta-
tion. This may indicate a change of the quinone envi-
ronment in some of the mutants. In addition, we note
some broadening of the m(C = O) signals, for example
in the case of the E295Q mutation. This may be due to
the loss of a hydrogen-bonding partner, allowing
greater rotational freedom of the C = O groups. In
order to differentiate between the effects on the protein
backbone and on the quinones, further experiments on
isotopically labeled quinones are necessary.
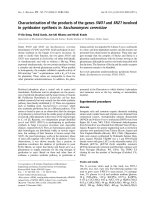
Wild-type FTIR difference spectra in the presence
of stigmatellin
Figure 5 shows the oxidized-minus-reduced FTIR
difference spectra of the wild-type cytochrome bc
1
complex from P. denitrificans obtained for a potential
step from )0.292 to +0.708 V, in comparison with
spectra obtained in the presence of a 2- or 10-fold
molar excess of stigmatellin.
Upon binding of stigmatellin, shifts reflecting the
changes within the binding site and the immediate envi-
ronment are expected, together with signals for the
inhibitor itself, which undergoes a redox reaction
[18,37]. The spectra obtained with a 10-fold excess of
stigmatellin help to identify the signals originating from
the oxidized and reduced inhibitor; signals for the inhib-
itor were observed at 1704, 1670 and 1252 cm
)1
, for the
oxidized form and several features between 1598 and
1346 cm
)1
were observed for the reduced form. These
signals are in line with the spectra identified using iso-
tope-labeled derivatives characterized in the presence of
the bc
1
complex from yeast [18]. For interpretation of
the effects of inhibitor binding, the oxidized-minus-
reduced FTIR difference spectra in the presence of a
2-fold excess of stigmatellin are discussed below,
enabling us to focus solely on contributions from the
1750 16501700 1600
D278N
E295Q
WT
1724
1726
1751
1746
1724
1693
1612
1644
1658
1746
Wavenumber (cm
–1
)
1800
1700 1600 1500 1400 1300 1200
0.001
Δ
Abs
D86N
E81Q
D278N
E295Q
WT
1448
1639
1560
1540
1266
1692
1448
1655
1657
1655
1635
1452
1448
1639
1639
1743
Wavenumber (cm
–1
)
Fig. 4. Overview of the oxidized-minus-reduced FTIR difference
spectra of wild-type and mutant cytochrome bc
1
complexes from
P. denitrificans, with samples equilibrated in D
2
O buffer. The inset
shows an enlarged view of the spectral region characteristic of pro-
tonated acidic residues as well as perturbations on the m(C = O)
vibrational mode of ubiquinone and the protein backbone for wild-
type and the D278N and E295A mutant enzymes equilibrated in
H
2
O buffer.
T. Kleinschroth et al. Infrared spectroscopic characterization of mutations in the Q
o
site
FEBS Journal 275 (2008) 4773–4785 ª 2008 The Authors Journal compilation ª 2008 FEBS 4777
inhibited protein and the bound inhibitor, but not from
the unbound inhibitor. Double difference spectra were
obtained by subtracting wild-type spectra from those
obtained in the presence of a 2-fold excess of stigmatel-
lin to further elucidate the observed shifts (Fig. 5).
Large variations were seen over the full spectral
range. The spectral region between 1760 and
1710 cm
)1
is characteristic of variations in the
m(C = O) mode for protonated acidic residues
[26,27,37]. A new positive feature appears at 1723 cm
)1
,
and a small decrease of the signal at 1744 cm
)1
is seen.
This is in line with a previous study on the yeast bc
1
complex [18]. These difference signals include contribu-
tions from several acidic residues (Fig. 5). Shifts at
approximately 1540 cm
)1
as well as at 1447 and
1428 cm
)1
indicate possible variations of a deprotonat-
ed acidic residue, like, for example, amino acid side
chains and heme propionates [39]. Further significant
shifts, not arising from contributions of the inhibitor
itself, are seen in the amide I range, i.e. at 1635, 1646
and 1670 cm
)1
, as observed previously for inhibitor
binding to the yeast bc
1
complex [18]. These may
reflect changes in the backbone that occur upon inhibi-
tor binding, such as reorientation of the Rieske
domain upon stigmatellin binding as reported previ-
ously [2,4,40–42]. In addition, the variation of the sig-
nal at 1646 and 1635 cm
)1
upon addition of
stigmatellin may at least be partially attributed to
C = O modes of the displaced quinone loosely bound
to the protein. Stigmatellin is added to the sample
without any further separation, and the displaced qui-
none should be observable in the difference spectra.
FTIR difference spectra of the mutants in the
presence of stigmatellin
Figure 6 shows the redox-induced FTIR difference
spectra of the E295Q, D278N and Y302F mutant
enzymes in the presence of a 2-fold excess of stigmatel-
lin in comparison to that of wild-type. In the amide I
range, all mutants showed a typical shift at 1646 cm
)1
upon binding of stigmatellin, as also observed for
wild-type. This shift is thought to indicate the quinone
displacement or a variation in backbone due to the
bound inhibitor. Nevertheless, major differences among
the mutants with respect to the spectroscopic binding
characteristics were seen in the double difference spec-
tra obtained by subtracting the oxidized-minus-reduced
FTIR difference spectra of the mutants recorded in the
presence and absence of stigmatellin (Fig. 7).
The redox-induced FTIR difference spectrum of the
E295 mutant in the presence of stigmatellin displays
most of the typical signals of the inhibitor binding,
except for the spectral range specific for protonated
acidic residues around 1744 cm
)1
. No obvious varia-
tion was seen here. Interestingly, a new signal arose at
1560 cm
)1
, reflecting changes in the binding pocket.
Additional variations were seen around 1637 cm
)1
in
the amide I region, possibly due to displacement of the
differently bound quinone. The signal seen at
1744 ⁄ 1723 cm
)1
in the wild-type spectrum can thus be
attributed to the E295 side chain.
1800
1700 1600 1500 1400 1300
1200
1800
1700 1600 1500 1400 1300
1200
0.002
Δ
s
b
A
A
B
8 8 5 1
7
4 4
1
2 4 2 1
8
2
4 1
0 4 5 1
8 1 6 1
5 3 6 1
6 4 6 1
0 7 6 1
8 9 6 1
4 4 7 1
3 2 7
1
0.002
Δ
s
b
A
4
0
7 1
C
3 1 5 1
4 9
2 1
6 4
3 1
3 8
3 1
4
4 4 1
7
6
4 1
5 3 5 1
3 6 5 1
0 0 6 1
2 2 6 1
3
9 6 1
4 4 6 1
0 7 6 1
2 5 2 1
Wavenumber (cm
–1
)
Wavenumber (cm
–1
)
1775
3 2 7 1
(cm
–1
)
4 4 7 1
1750 1725
Fig. 5. (A) Oxidized-minus-reduced FTIR difference spectra of the
cytochrome bc
1
complex from P. denitrificans obtained for a
change in potential from )0.292 to +0.708 V with a 2-fold excess
of stigmatellin (black line) in comparison with wild-type (gray line).
(B) Double difference spectrum (wild-type inhibited with 2-fold
excess of stigmatellin minus its inhibitor-free counterpart). The
spectral region characteristic for protonated residues is enlarged in
the inset above (A). (C) Effect of addition of a 10-fold excess of
stigmatellin (dotted line) in comparison with the spectrum obtained
for a 2-fold excess (black line), highlighting the contributions of
stigmatellin. The spectra are normalized to the a-band
(553 ⁄ 559 nm) in the visible spectrum.
Infrared spectroscopic characterization of mutations in the Q
o
site T. Kleinschroth et al.
4778 FEBS Journal 275 (2008) 4773–4785 ª 2008 The Authors Journal compilation ª 2008 FEBS
In the case of the D278N mutant enzyme, a differen-
tial signal was observed at 1750 ⁄ 1728 cm
)1
upon bind-
ing of the inhibitor. On the basis of the up-shift of the
differential signals by about 6–4 cm
)1
in comparison
with wild-type, weaker hydrogen bonding or a more
hydrophobic environment of the C = O group of the
E295 side chain can be deduced. Differential features
in the spectral range for deprotonated acidic residues
at 1588 ⁄ 1565 cm
)1
and 1446 ⁄ 1428 cm
)1
were lost in
the double difference spectra of the D278N mutant as
highlighted by arrows. The signals in the amide I range
are clearly shifted in comparison to wild-type. D278
appears to be deprotonated in the stigmatellin-bound
form, and this residue obviously influences the stigma-
tellin binding site.
In the redox-induced FTIR difference spectra of the
Y302F variant in the presence of stigmatellin (Fig. 6),
only a small amount of inhibitor is observed, but most
of the typical shifts are observed. Interestingly, the
negative signals at 1668 and 1702 cm
)1
are not
decreased as seen for wild-type and the D278N and
E295Q mutant enzymes, and instead only a broad shift
at 1707 cm
)1
was noted in the double difference spec-
tra. This indicates that, after mutation at residue
Y302, an alternative residue is involved in the proton
displacement that takes place around the Q
o
site, pos-
sibly accompanied by a small change in the backbone.
This ‘rescue’ would also explain why mutation of this
crucial residue does not lead to any significant loss in
activity. The typical shifts at approximately 1670 and
1646 cm
)1
cannot be seen in the same intensity ratio.
Discussion and Conclusions
In this study, the effects of mutations in conserved
residues of cytochrome b from the cytochrome bc
1
complex of P. denitrificans were studied. A detailed
redox-induced FTIR difference spectroscopic study of
the variants was performed in the presence and
absence of stigmatellin, and band assignments are
summarized in Table 2. Two regions were addressed:
residues in the immediate vicinity of the Q
o
binding
site, and residues E81, D86 and D278, located close to
the surface. These structural regions are analyzed and
1700 1600 1500 1400
0.0005
ΔΔ sbA
6461
88
5
1
2051
20
5
1
21
5
1
5361
3371
4471
0
571
0
6
5
1
8241
644
1
4351
7441
8
2
41
5
651
0451
2
4
51
2561
056
1
8661
0761
0761
89
6
1
2071
7071
3271
8271
ddwt
ddD278N
ddE295Q
Wavenumber (cm
–1
)
Fig. 7. Double difference spectra obtained by subtracting the oxi-
dized-minus-reduced FTIR difference spectra of the D278N and
E295Q mutations of cytochrome bc
1
in the presence of stigmatellin
from those of their inhibitor-free counterparts.
1800 1700 1600 1500 1400 1300 1200
0.001
Δ
s
bA
1651
6461
4471
6
471
2471
Y302F
E295Q
D278N
WT
Wavenumber (cm
–1
)
Fig. 6. Oxidized-minus-reduced FTIR difference spectra for the
D278N, E295Q and Y302F mutants of the cytochrome bc
1
complex
from P. denitrificans obtained for a change in potential from )0.292
to +0.708 V in the presence of stigmatellin.
T. Kleinschroth et al. Infrared spectroscopic characterization of mutations in the Q
o
site
FEBS Journal 275 (2008) 4773–4785 ª 2008 The Authors Journal compilation ª 2008 FEBS 4779
discussed below in the light of current views on the
role of the so-called PEWY loop.
Residues E81 and D86 are positioned close to the
surface of cytochrome b at a distance of approximately
29 and 20 A
˚
, respectively, from the Q
o
binding site
(see Fig. 1), as measured from the chromone head-
group of the inhibitor [2]. Their involvement in a water
chain leading up to the heme b
L
edge, and their parti-
cipation in proton exit from the quinol site has been
suggested previously on the basis of molecular dynam-
ics modeling [43] of the bc
1
structure from chicken [4].
This water chain was later experimentally visualized in
the structure for the complex from Saccharomyces
cerevisiae [2]. Interactions with the binding site may be
based on hydrogen bonding and include lipids (as sug-
gested in [2,4]). In the study presented here, decreased
activity was found for the D86N mutant enzyme. The
E81Q mutant enzyme showed a lower affinity towards
stigmatellin. The redox-induced FTIR difference spec-
tra were perturbed with respect to signals for an acidic
residue that is protonated in the reduced form, and,
interestingly, the quinone and backbone contributions
were also shifted. For both the D86N and E81Q
mutant enzymes, changes in quinone contributions
were observed in the respective difference spectra, indi-
cating an interaction between these acidic residues and
the Q
o
binding site. The observed shifts may be a sec-
ondary-order effect induced by perturbation of the
water chain that leads to the heme b
L
edge and resi-
dues of the PEWY loop, including the E295 and Y297
residues studied here.
E295 is a heavily discussed position in close proxim-
ity to the quinone binding site, as suggested by
site-directed mutagenesis [10,13,16,41–45] and X-ray
crystallography [1–3,46]. All crystallographic data were
obtained in the presence of stigmatellin under the
assumption that the inhibitor remains oxidized. In the
FTIR spectroscopic analysis of the E295 mutant in
the absence of inhibitor, signals characteristic of pro-
tonated acidic residues in the fully oxidized form are
partially lost in direct comparison to the wild-type.
Table 2. Summary of tentative assignments for the oxidized-
minus-reduced FTIR difference spectra of the P. denitrificans bc
1
complex based on recent data from potential titrations [18] and
site-directed mutants in this study. A positive symbol (+) indicates
the oxidized state, a negative symbol ()) indicates the reduced
state. In case of a composite signal, the main peak is given.
Band position (cm
)1
)
before and after
stigmatellin addition
AssignmentBefore After
1746 (+) m(C = O) D278, E295
1724 ()) m(C = O) D86 and further Asp ⁄ Glu
1723 (+) m(C = O) E295
1710 (+) m(C = O) Asp ⁄ Glu (cytochrome b
H
)
1693 (+) 1698 (+) Amide I (Rieske b-sheet)
m(C = O) heme propionates b
L
, b
H
1680 (+) m(C = O) heme propionates b
L
, b
H
, c
1
m(C = O) Gln ⁄ Asn (cytochrome b
H
)
Amide I (loop structures Rieske)
1670 (+) m(CN
3
H
5
) Arg (cytochrome b
H
)
1670 (+) Stigmatellin when added in excess
Perturbed m(C = O) heme propionates
1658 (+) Amide I (a-helical, unordered)
m(C = O) quinone
1646 ⁄ 1635 (+) Amide I
m(C = O) quinone
1644 (+) m(C = O) quinone
m
37
heme c
1
1628 ()) Amide I (Rieske b-sheet)
m(CN
3
H
5
) Arg (cytochrome b
H
)
1612 (+) m(C = C) quinone
1592 (+)
1570 (+) Amide II
m
37
heme b
L
m
38
heme c
1
1561 ()) m(COO
)
)
as
D278, E295
1565 ⁄ 1540 ()) m(COO
)
)
as
heme propionates b
L
, b
H
, c
1
m(COO
)
)
as
Asp ⁄ Glu (cytochrome b
H
)
D278, E295
1550 (+) Amide II
m
38
heme b
H
1540 ()) Amide II
m(COO
)
)
as
Asp ⁄ Glu (cytochrome b
H
)
m(COO
)
)
as
heme propionates b
L
, b
H
1520 (+) Y297, Y302
m
19
(CC) ring mode, protonated Tyr
1516 ()) Y297, Y302
m
19
(CC) ring mode, protonated Tyr
1508 (+) Amide II (Rieske)
1496 ()) Quinone ring
1470 ()) Quinone ring
1447 (+) 1447 (+) m(COO
)
)
s
D278
1432 ()) Quinone ring
1428 ()) m(COO
)
)
s
D278
1408 ()) Quinone ring
1388 ()) Quinone ring
m(COO
)
)
s
Asp ⁄ Glu (cytochrome b
H
)
1368 ()) m(COO
)
)
s
heme propionates
Table 2. (Continued)
Band position (cm
)1
)
before and after
stigmatellin addition
Assignment
Before After
1289 (+) m(C–O) methoxy group, quinone
1264 (+) m(C–O) methoxy group, quinone
m
42
heme c
1
1240 ()) m
42
heme b
H
1204 (+) Quinone
Infrared spectroscopic characterization of mutations in the Q
o
site T. Kleinschroth et al.
4780 FEBS Journal 275 (2008) 4773–4785 ª 2008 The Authors Journal compilation ª 2008 FEBS
On this basis, we suggest that the side chain is proton-
ated in the oxidized form (signal at 1746 cm
)1
) and de-
protonated in the reduced form (signal at 1561 cm
)1
).
In the presence of inhibitor, the residue remains pro-
tonated in the oxidized form, but exhibits stronger
hydrogen bonding (signal at 1723 cm
)1
). In the
reduced form, however, it is possibly deprotonated
(signal at 1565 cm
)1
). The redox-induced FTIR differ-
ence spectrum of the D278 mutant indicates the partial
contribution of this side chain to the signals of the
protonated acidic residues for the oxidized form in the
absence of the inhibitor. The shifts of the signals
attributed to E295 indicate perturbation of the hydro-
gen-bonding network in the D278N mutant.
In a recent study, the influence of the mutation
E295 in the bc
1
complex from Rhodobacter capsulatus
was assessed [50]. No obvious influence of this muta-
tion on the FTIR spectra in comparison with wild-type
was reported for either the spectral region of proton-
ated acidic residues or the spectral region characteristic
of contributions from quinones and the backbone.
While our approach targets the fully oxidized and
reduced forms of the enzyme, the data for R. capsula-
tus present the reorganizations induced by heme b
L
reduction only. Obviously, the heme b
L
redox reaction
alone does not affect this residue. We suggest that this
side chain is addressed by the quinone reaction, as also
suggested by the strong perturbations of the signals
around 1660–1630 cm
)1
. In the P. denitrificans E295Q
mutant, this residue is perturbed, and the quinones are
involved in the redox reaction. The data from both
studies may therefore be considered complementary.
However, this may not be the only conflicting evi-
dence regarding mutations at position 295. Recently,
the stigmatellin resistance of yeast mutations at this
position has been studied by various groups: whereas
conservative replacements lead to increased stigmatel-
lin resistance [48], more pronounced exchanges had no
noteworthy effects [6]. Indeed, none of the mutations
completely abolished the prominent signals characteris-
tic for protonated acidic residues. We suggest that resi-
dues D278 and E295 both contribute to the signal of
the oxidized form. Contributions from other acidic res-
idues within the enzyme cannot be excluded. The
observation that several acidic residues participate in
this spectral feature is in line with the elaborate pH
dependency previously described [19].
The tyrosine mutations appear rather unperturbed
in comparison with wild-type, despite the close prox-
imity of the tyrosines to the Q
o
binding site. Most of
the mutants studied here alter the spectral features of
the quinone, indicating a variation of the hydrogen-
bonding environment and ⁄ or structure within the
binding site. This observation is not surprising in the
light of previous data showing that mutations on the
Y302 site induce noticeable conformational changes,
perturb kinetics, and affect inhibitor as well as quinone
binding [30].
A second quinone has been discussed to be located
at the site [19,44], probably in direct interaction with
the first quinone. The exact position of this second
quinone is not clear, and it is not possible to distin-
guish which quinone is primarily perturbed by the var-
ious mutations. On the basis of previous data and the
intensity of the quinone modes, the second quinone
bound is clearly observed in the redox-induced spectra
[19]. The intensity of the typical quinone signals pre-
sented above indicates that more than one quinone is
also present in the mutants. The broadening of the
m(CO) vibration at about 1654 cm
)1
, however, indi-
cates that one of the quinones is less tightly bound.
Essential features observed for specific side chains
studied in other bc
1
complexes were also found to be
important for the bc
1
complex from P. denitrificans.
Interestingly, most of the mutants retain a high degree
of catalytic activity (see Table 1), indicating a rather
flexible binding site in the bacterial enzyme. In a recent
FTIR spectroscopic study, the infrared spectroscopic
characteristics of the E295 mutant (E272 in yeast) were
studied by a parallel approach [18]. Stigmatellin bind-
ing was found to induce a similar effect to that shown
here: a signal for a protonated acidic residue at
approximately 1724 cm
)1
appears and the original sig-
nal decreases [18]. These results are not unambiguous,
especially in light of currently discussed mechanisms
and experimental observations suggesting that E295 is
deprotonated upon inhibitor binding [2,43]. Certainly,
the suggested proton transfer via residue E295 within
the hydrogen-bonding network of a water channel
could also occur with a protonated E295 residue
[2,43,51]. The binding of quinol to the protonated resi-
due, however, is difficult to substantiate. We note that
binding of stigmatellin was previously suggested to
mimic the interaction with the quinone radical [52] and
the stable intermediate that involves binding of the
Rieske iron sulfur protein [53]. According to the cur-
rent view, stigmatellin displaces a quinol molecule [51],
and the spectra shown here (Fig. 7) reflect this interac-
tion. We suggest that the high pK seen here for E295
in the oxidized form (> 7) may shift during the cata-
lytic cycle, allowing deprotonation and thus stabiliza-
tion of the quinol.
The redox activity of the stigmatellin reported previ-
ously [18] poses a challenge for data interpretation, as
the structure of the reduced form is not clear. A recent
study [54] has suggested reduction of the C = O group
T. Kleinschroth et al. Infrared spectroscopic characterization of mutations in the Q
o
site
FEBS Journal 275 (2008) 4773–4785 ª 2008 The Authors Journal compilation ª 2008 FEBS 4781
in the stigmatellin ring to a hydroxyl group, with the
COH moiety no longer interacting with the His group
from the Rieske protein. Based on the redox potential
of the stigmatellin (P. Hellwig and C. Boudon, Institute
de Chimie, Louis Pasteur University of Strasbourg;
unpublished results), we note that the Rieske center is
exclusively affected by a change in the redox state of
the stigmatellin.
In conclusion, the redox-induced FTIR difference
spectra of the site-directed mutations in the Q
o
bind-
ing site of the bc
1
complex from P. denitrificans,a
small bacterial version of the mitochondrial enzyme,
allow specific monitoring of the protonation state of
several crucial residues in the presence and absence of
stigmatellin. Interestingly, several residues perturb the
orientation of the quinone binding site and are poten-
tial partners in a hydrogen-bonding network. D278
and E81 have been found to be critically involved in
the interaction, in addition to the highly discussed res-
idues E295 and Y302. We conclude that a strong
interaction occurs among the residues of the quinone
binding site.
Experimental procedures
Sample preparation
Mutagenesis
Mutagenesis for the Y302F protein was carried out using a
StuI ⁄ XhoI cassette excised from the wild-type fbc operon
[45], into which a StuI site was introduced between the fbcF
and fbcB open reading frames at residue 1024, and subcl-
oned into the vector pSL1180. For mutations E81Q, D86N
and Y147F, mutagenesis was performed using an NcoI ⁄
SmaI cassette from the wild-type fbc operon introduced
into the pUC18 vector.
The following primers were used: bE81Q, 5¢-CGCC
TCGGTCCAGCATATCATGCG-3¢; bD86N, 5¢-GCATA
TCATGCGCAACGTGAACGGCGGCTAC-3¢; bY147F,
5¢-GCCTTCATGGGCTTCGTGCTGCCCTGG-3¢; bD278N,
5¢-CTCGATATAGTTGTTGGGATGGCCCAG-3¢; bD295Q,
5¢-CATATCGTGCCGCAATGGTATTTCGTG-3¢; bY297F,
5¢-GTGCCGCAATGGTTCTTCCTGCCCTTC-3¢; bY302F,
5¢-GGTATTTCCTGCCCTTCTTCGCCATCCTGCG-3¢.
These were phosphorylated with T4 kinase (Fermentas, St
Leon-Rot, Germany) as specified by the manufacturer.
Mutations E81Q, D86N, Y147F and Y302F were intro-
duced into the wild-type fbc operon using the ‘Quik
Change’ mutagenesis kit from Stratagene (La Jolla, CA,
USA). The mutated cassettes were reinserted into the fbc
operon. Mutations E295Q, Y297F, and D278N were
introduced using the Altered Sites system (Promega, Man-
nheim, Germany). All mutations were confirmed by DNA
sequencing.
fbc operons encoding the wild-type or mutated P. deni-
trificans bc
1
complex were cloned into the HindIII ⁄ SacI
sites of the vector pRI2 [55]. The resulting plasmids were
conjugated into MK6, a chromosomal fbc deletion mutant
of P. denitrificans [56], resulting in strains overexpressing
the enzyme. Cell growth, membrane isolation, solubiliza-
tion and subsequent protein purification were performed
essentially as described previously [57], with the following
modifications: membranes were solubilized with n-dodecyl
b-d-maltoside (DDM; 1.2 gÆg
)1
protein), subsequently
diluted to a salt concentration of 350 mm NaCl using
50 mm Mes ⁄ NaOH (pH 6.0), 0.02% w ⁄ v DDM before
anion-exchange chromatography, and eluted using a salt
gradient between 350 and 600 mm NaCl in the above
mentioned detergent buffer (50mm Mes ⁄ NaOH, pH 6.0,
0.02% v DDM). Pooled fractions were concentrated by
ultrafiltration (Amicon Centriprep ⁄ Centricon, Milipore,
Schwalbach, Germany; exclusion limit 100 kDa), equili-
brated with the standard buffer for the FTIR experiments
(100 mm phosphate buffer pH 7, 150 mm KCl, 0.02%
DDM) by gel filtration (Sephadex G25 fine; GE Health-
care, Munich, Germany), and subsequently ultrafiltrated
again to a final bc
1
enzyme concentration of approxi-
mately 0.5–2 mm. For H ⁄ D exchange, samples were equili-
brated in a 100-fold excess of the corresponding D
2
O
buffer, re-concentrated using ultrafiltration devices (Ami-
con Microcon, exclusion limit 100 kDa), and washed twice
with the same buffer for 30 min. H ⁄ D exchange was
found to be better than 80% as determined from the shift
of the amide II mode (data not shown). For inhibition of
the Q
o
site, the concentrated samples were incubated for
1 h on ice in the presence of a 2-fold molar excess of
stigmatellin.
Activity assay
Ubihydroquinone–cytochrome c oxidoreductase activities
for the isolated wild-type and mutant preparations were
measured using decyl-ubihydroquinone (80 lm) and horse
heart cytochrome c (25 lm) as substrates in a buffer contain-
ing 50 mm Mops ⁄ NaOH pH 7.5, 1 mm EDTA, 1 mm KCN
and 0.04% DDM. The reduction of cytochrome c was fol-
lowed at 550 nm. Dilutions of the concentrated samples for
the activity measurements were made in a buffer containing
50 mm Mops ⁄ NaOH pH 7.5, 100 mm NaCl, 0.04% DDM,
5% glycerol and 0.05% BSA. To inhibit enzyme activity,
stigmatellin from a stock solution of 10 mm in ethanol was
added to a final concentration of 2 lm.
The IC
50
value was determined under activity test condi-
tions, but stigmatellin (0, 0.01, 0.03, 0.1, 0.3, 1, 3, 10 lm
final concentration from 10 mm stock in ethanol) was
added before the addition of the enzyme. V
max
was plotted
against the common logarithm (log 10) of the stigmatellin
concentration and fitted non-linearly. The IC
50
value is
defined as the inflection point of the curve.
Infrared spectroscopic characterization of mutations in the Q
o
site T. Kleinschroth et al.
4782 FEBS Journal 275 (2008) 4773–4785 ª 2008 The Authors Journal compilation ª 2008 FEBS
Electrochemistry
Ultra-thin layer spectroelectrochemical cells were used as
described previously [58,59]. To avoid irreversible protein
adhesion, the gold grid working electrode was modified by
a2mm cysteamine solution for 1 h and then washed with
de-ionized water. In order to accelerate the redox reactions,
a mixture of 17 mediators (as described previously [59] but
omitting diethyl-3-methylparaphenylenediamine and dim-
ethylparaphenylenediamine and adding quinhydrone) was
added at sub-stoichiometric concentrations of 40 lm each
to the protein solution. Aliquots of the solution (7–8 lL)
were used to fill the electrochemical cell. The cell path
length was < 10 lm, as determined at the beginning of
each experiment. All experiments were performed at 5 °C.
Potentials are given with respect to the standard hydrogen
electrode at pH 7.
Spectroscopy
FTIR and UV ⁄ visible difference spectra were simulta-
neously recorded as a function of the applied potential
using a set-up combining an infrared beam from the inter-
ferometer (modified IFS 25, Bruker, Ettlingten, Germany)
for the 4000–1000 cm
)1
range and a dispersive spectrometer
for the 400–900 nm range as reported previously [58,59].
The protein was equilibrated at an initial electrode poten-
tial, and a single-beam spectrum was recorded. Then the
final potential was applied, and a single-beam spectrum was
again recorded after equilibration. Equilibration generally
took less than 4 min for the full potential step from )0.292
to +0.708 V. The difference spectra presented here were
calculated from two single-beam spectra, with the initial
spectrum taken as reference. Typically, 128 interferograms
at 4 cm
)1
resolution were co-added for each single-beam
spectrum, and Fourier-transformed using triangular apodi-
zation and a zero filling factor of 2. Eight to ten difference
spectra were averaged. To account for differences in sample
concentration and path length, the FTIR difference spectra
were normalized to the difference signals of the a-band in
the UV ⁄ visible spectrum (not shown).
Acknowledgements
We are grateful to A. Herrmann (Institute of Biochem-
istry, University of Frankfurt) for excellent technical
assistance and W. Ma
¨
ntele (Institute of Biophysics,
University of Frankfurt) for his support at an early
stage of the experiments, and thank T. Thieme and
A. Klein (Institut fu
¨
r Biochemie, Universita
¨
t Frank-
furt, Germany) for initial contributions to the project.
Financial support from the Deutsche Forschungsgeme-
inschaft (SFB 472 and CEF, Cluster of Excellence
‘Macromolecular Complexes’), the Agence National de
Recherche (ANR), the Universite
´
Louis Pasteur (Stras-
bourg) and the Centre Nacional de la Recherche Scien-
tifique (CNRS) is gratefully acknowledged.
References
1 Berry AB, Guergova-Kuras M, Huang L & Crofts AR
(2000) Structure and function of cytochrome bc com-
plexes. Annu Rev Biochem 69, 1005–1075.
2 Hunte C, Koepke J, Lange C, Roßmanith T & Michel
H (2000) Structure at 2.3 A
˚
resolution of the cyto-
chrome bc(1) complex from the yeast Saccharomyces
cerevisiae co-crystallized with an antibody Fv fragment.
Structure 8, 669–684.
3 Iwata S, Lee JW, Okada K, Lee JK, Iwata M,
Rasmussen B, Link TA, Ramaswamy S & Jap BK (1998)
Complete structure of the 11-subunit bovine mitochon-
drial cytochrome bc
1
complex. Science 281, 64–71.
4 Zhang Z, Huang L, Shulmeister VM, Chi Y, Kim KK,
Hung LW, Crofts AR, Berry EA & Kim SH (1998)
Electron transfer by domain movement in cytochrome
bc
1
. Nature 392, 677–684.
5 Xia D, Yu CA, Kim H, Xia JZ, Kachurin AM, Zhang
L, Yu L & Deisenhofer J (1997) Crystal structure of the
cytochrome bc
1
complex from bovine heart mitochon-
dria. Science 277, 60–66.
6 Seddiki N, Meunier B, Lemesle-Meunier D & Brasseur
G (2008) Is cytochrome b glutamic acid 272 a quinol
binding residue in the bc
1
complex of Saccharomyces
cerevisiae? Biochemistry 47, 2357–2368.
7 Mitchell P (1976) Possible molecular mechanisms of the
protonmotive function of cytochrome systems. J Theor
Biol 62, 327–367.
8 Trumpower BL (1990) The protonmotive Q cycle.
Energy transduction by coupling of proton transloca-
tion to electron transfer by the cytochrome bc1 com-
plex. J Bioenerg Biomembr 23, 241–255.
9 Brandt U & Trumpower B (1994) The protonmotive Q
cycle in mitochondria and bacteria. Crit Rev Biochem
Mol Biol 29, 165–197.
10 Crofts AR (2004) The Q-cycle – a personal perspective.
Photosynth Res 80, 223–243.
11 Osyczka A, Moser CC & Dutton PL (2005) Fixing the
Q cycle. Trends Biochem Sci 30, 176–182.
12 Brandt U (1996) Bifurcated ubihydroquinone oxidation
in the cytochrome bc
1
complex by proton-gated charge
transfer. FEBS Lett 387, 1–6.
13 Ding H, Moser CC, Robertson DE, Tokito MK, Daldal
F & Dutton PL (1995) Ubiquinone pair in the Qo site
central to the primary energy conversion reactions of
cytochrome bc
1
complex. Biochemistry 34, 15979–15996.
14 Sharp RE, Gibney BR, Palmitessa A, White JL, Dixon
JA, Moser CC, Daldal F & Dutton PL (1999) Effect of
inhibitors on the ubiquinone binding capacity of the
T. Kleinschroth et al. Infrared spectroscopic characterization of mutations in the Q
o
site
FEBS Journal 275 (2008) 4773–4785 ª 2008 The Authors Journal compilation ª 2008 FEBS 4783
primary energy conversion site in the Rhodobacter cap-
sulatus cytochrome bc
1
complex. Biochemistry 38,
14973–14980.
15 Yang X & Trumpower B (1988) Protonmotive Q cycle
pathway of electron transfer and energy transduction in
the three-subunit ubiquinol–cytochrome c oxidoreduc-
tase complex of Paracoccus denitrificans. J Biol Chem
263, 11962–11970.
16 Crofts AR, Guergova-Kuras M, Huang L, Kuras R,
Zhang Z & Berry EA (1999) Mechanism of ubiquinol
oxidation by the bc
1
complex: role of the iron sulfur
protein and its mobility. Biochemistry 38, 15791–15806.
17 Baymann F, Robertson DE, Dutton PL & Ma
¨
ntele W
(1999) Electrochemical and spectroscopic investigations
of the cytochrome bc
1
complex from Rhodobacter cap-
sulatus. Biochemistry 38, 13188–13199.
18 Ritter M, Palsdottir H, Abe M, Ma
¨
ntele W, Hunte C,
Miyoshi H & Hellwig P (2004) Direct evidence for the
interaction of stigmatellin with a protonated acidic
group in the bc
1
complex from Saccharomyces cerevisiae
as monitored by FTIR difference spectroscopy and
13
C
specific labeling. Biochemistry 43, 8439–8446.
19 Ritter M, Anderka O, Ludwig B, Ma
¨
ntele W & Hellwig
P (2003) Electrochemical and FTIR spectroscopic char-
acterization of the bc
1
complex from Paracoccus deni-
trificans. Biochemistry 42, 12391–12399.
20 Iwaki M, Osyczka A, Moser CC, Dutton PL & Rich PR
(2004) ATR–FTIR spectroscopy studies of iron–sulfur
protein and cytochrome c
1
in the Rhodobacter capsulatus
cytochrome bc
1
complex. Biochemistry 43, 9477–9486.
21 Iwaki M, Yakovlev G, Hirst J, Osyczka A, Dutton PL,
Marshall D & Rich PR (2005) Direct observation of
redox-linked histidine protonation changes in the iron–
sulfur protein of the cytochrome bc
1
complex by ATR–
FTIR spectroscopy. Biochemistry 44, 4230–4237.
22 Iwaki M, Giotta L, Akinsiku AO, Scha
¨
gger H, Fisher
N, Breton J & Rich PR (2003) Redox-induced transi-
tions in bovine cytochrome bc
1
complex studied by per-
fusion-induced ATR–FTIR spectroscopy. Biochemistry
42, 11109–11119.
23 Venyaminov SY & Kalnin NN (1990) Quantitative IR
spectrophotometry of peptide compounds in water
(H
2
O) solutions. I. Spectral parameters of amino acid
residue absorption bands. Biopolymers 30, 1259–1271.
24 Barth A (2000) The infrared absorption of amino acid
side chains. Prog Biophys Mol Biol 74, 141–173.
25 Wolpert M & Hellwig P (2006) Infrared spectra and
molar absorption coefficients of the 20 alpha amino
acids in aqueous solutions in the spectral range from
1800 to 500 cm
)1
. Spectrochim Acta A Mol Biomol
Spectrosc 4, 987–1001.
26 de Grip WJ, Gillespie J & Rothschild KJ (1985) Carboxyl
group involvement in the meta I and meta II stages in
rhodopsin bleaching. A Fourier transform infrared spec-
troscopic study. Biochim Biophys Acta 809, 97–106.
27 Vogel R & Siebert F (2000) Vibrational spectroscopy as
a tool for probing protein function. Curr Opin Chem
Biol 4, 518–523.
28 Hellwig P, Pfitzner U, Behr J, Rost B, Pesavento RP,
Donk WV, Gennis RB, Michel H, Ludwig B & Ma
¨
ntele
W (2002) Vibrational modes of tyrosines in cyto-
chrome c oxidase from P. denitrificans: FTIR and elec-
trochemical studies on Tyr-D4-labeled and on
Tyr280His and Tyr35Phe mutant enzymes. Biochemistry
41, 9116–9125.
29 Hienerwadel R, Boussac A, Breton J, Diner B & Bert-
homieu C (1997) Fourier transform infrared difference
spectroscopy of photosystem II tyrosine D using site-
directed mutagenesis and specific isotope labeling. Bio-
chemistry 36, 14712–14723.
30 Crofts AR, Guergova-Kuras M, Kuras R, Ugulava N,
Li J & Hong S (2000) Proton-coupled electron transfer
at the Q(o) site: what type of mechanism can account
for the high activation barrier? Biochim Biophys Acta
1459, 456–466.
31 Buchanan S, Michel H & Gerwert K (1992) Light-
induced charge separation in Rhodopseudomonas viridis
reaction centers monitored by Fourier-transform infra-
red difference spectroscopy: the quinone vibrations.
Biochemistry 31, 1314–1322.
32 Breton J, Burie JR, Berthomieu C, Berger G & Nabe-
dryk E (1994) The binding sites of quinones in photo-
synthetic bacterial reaction centers investigated by
light-induced FTIR difference spectroscopy: assignment
of the QA vibrations in R. sphaeroides using
18
O- or
13
C-labeled ubiquinone and vitamin K1. Biochemistry
33, 4953–4965.
33 Hellwig P, Mogi T, Tomson FL, Gennis RB, Iwata J,
Miyoshi H & Ma
¨
ntele W (1999) Vibrational modes of
ubiquinone in cytochrome bo3 from Escherichia coli
identified by Fourier transform difference spectroscopy
and specific 13C labeling. Biochemistry 38, 14683–14689.
34 Breton J, Boullais C, Burie JR, Nabedryk E &
Mioskowski C (1994) Binding sites of quinones in
photosynthetic bacterial reaction centers investigated by
light-induced FTIR difference spectroscopy: assignment
of the interactions of each carbonyl of QA in Rhodob-
acter sphaeroides using site-specific
13
C-labeled ubiqui-
none. Biochemistry 33, 14378–14386.
35 Brudler R, de Groot HJ, van Liemt WB, Steggerda
WF, Esmeijer R, Gast P, Hoff AJ, Lugtenburg J &
Gerwert K (1994) Asymmetric binding of the 1- and
4-C = O groups of QA in Rhodobacter sphaeroides R26
reaction centres monitored by Fourier transform infra-
red spectroscopy using site-specific isotopically labelled
ubiquinone-10. EMBO J 13, 5523–5530.
36 Burie JR, Boullais C & Nonella M (1997) Importance
of the conformation of methoxy groups on the vibra-
tional and electrochemical properties of ubiquinones.
J Phys Chem B 101, 6607–6617.
Infrared spectroscopic characterization of mutations in the Q
o
site T. Kleinschroth et al.
4784 FEBS Journal 275 (2008) 4773–4785 ª 2008 The Authors Journal compilation ª 2008 FEBS
37 Thierbach G, Kunze B, Reichenbach H & Ho
¨
fle G
(1984) The mode of action of stigmatellin, a new
inhibitor of the cytochrome bc
1
segment of the respira-
tory chain. Biochim Biophys Acta 765, 227–235.
38 Gerwert K (1999) Molecular reaction mechanisms of
proteins monitored by time-resolved FTIR-spectros-
copy. J Biol Chem 380, 931–935.
39 Behr J, Hellwig P, Ma
¨
ntele W & Michel H (1998)
Redox dependent changes at the heme propionates in
cytochrome c oxidase from Paracoccus denitrificans:
direct evidence from FTIR difference spectroscopy in
combination with heme propionate
13
C labeling. Bio-
chemistry 37, 7400–7406.
40 Darrouzet E, Valkova-Valchanova M, Ohnishi T &
Daldal F (1999) Structure and function of the bacterial
bc
1
complex: domain movement, subunit interactions,
and emerging rationale engineering attempts. J Bioenerg
Biomembr 31, 275–288.
41 Lange C & Hunte C (2002) Crystal structure of the
yeast cytochrome bc
1
complex with its bound substrate
cytochrome c. Proc Natl Acad Sci USA 99, 2800–2805.
42 Sharp RE, Moser CC, Gibney BR & Dutton PL (1999)
Primary steps in the energy conversion reaction of the
cytochrome bc
1
complex Qo site. J Bioenerg Biomembr
31, 225–233.
43 Izrailev S, Crofts AR, Berry EA & Schulten K (1999)
Steered molecular dynamics simulation of the Rieske
subunit motion in the cytochrome bc(1) complex.
Biophys J 77, 1753–1768.
44 Bartoschek S, Johansson M, Geierstanger BH, Okun
JG, Lancaster CR, Humpfer E, Yu L, Yu CA, Grie-
singer C & Brandt U (2001) Three molecules of ubiqui-
none bind specifically to mitochondrial cytochrome bc
1
complex. J Biol Chem 276, 35231–35234.
45 Brasseur G, Saribas AS & Daldal F (1996) A compila-
tion of mutations located in the cytochrome b subunit
of the bacterial and mitochondrial bc
1
complex. Biochim
Biophys Acta 1275, 61–69.
46 Esser L, Elberry M, Zhou F, Yu C-A, Yu L & Xi D
(2008) Inhibitor-complexed structures of the cytochrome
bc
1
from the photosynthetic bacterium Rhodobacter sph-
aeroides. J Biol Chem, 283, 2846–2857.
47 Crofts AR (2004) Proton-coupled electron transfer at
the Qo-site of the bc
1
complex controls the rate of ubi-
hydroquinone oxidation. Biochim Biophys Acta 1655,
77–92.
48 Wenz T, Hellwig P, MacMillan F, Meunier B & Hunte
C (2006) Probing the role of E272 in quinol oxidation
of mitochondrial complex III. Biochemistry 45, 9042–
9052.
49 Kurowski B & Ludwig B (1987) The genes of the Para-
coccus denitrificans bc
1
complex. Nucleotide sequence
and homologies between bacterial and mitochondrial
subunits. J Biol Chem 262, 13805–13811.
50 Osyczka A, Zhang H, Mathe C, Rich PR, Moser CC &
Dutton PL (2006) Role of the PEWY glutamate in
hydroquinone–quinone oxidation–reduction catalysis in
the Q(o) site of cytochrome bc
1
. Biochemistry 45,
10492–10503.
51 Crofts AR, Lhee S, Crofts SB, Cheng J & Rose S
(2006) Proton pumping in the bc
1
complex: a new gat-
ing mechanism that prevents short circuits. Biochim Bio-
phys Acta 1757, 1019–1034.
52 Lancaster CR & Michel H (1997) The coupling of light-
induced electron transfer and proton uptake as derived
from crystal structures of reaction centres from Rhodo-
pseudomonas viridis modified at the binding site of the
secondary quinone, QB. Structure 5, 1339–1359.
53 Link TA, Haase U, Brandt U & von Jagow G (1993)
What information do inhibitors provide about the
structure of the hydroquinone oxidation site of ubihy-
droquinone:cytochrome c oxidoreductase? J Bioenerg
Biomembr 25, 221–232.
54 Klingen AR, Palsdottir H, Hunte C & Ullmann GM
(2007) Redox-linked protonation state changes in
cytochrome bc1 identified by Poisson–Boltzmann elec-
trostatics calculations. Biochim Biophys Acta 67, 204–
221.
55 Pfitzner U, Odenwald A, Ostermann T, Weingard L,
Ludwig B & Richter OM (1998) Cytochrome c oxidase
(heme aa
3
) from Paracoccus denitrificans: analysis of
mutations in putative proton channels of subunit I.
J Bioenerg Biomembr 30, 89–97.
56 Korn M (1994) Doppeldeletion of the cytochrome c oxi-
dase and reductase (cta and tbc operon) in Paracoccus
denitrificans. Diploma Thesis, J. W. Goethe-Universita
¨
t,
Frankfurt am Main, Germany.
57 Schro
¨
ter T, Hatzfeld OM, Gemeinhardt S, Korn M,
Friedrich T, Ludwig B & Link TA (1998) Mutational
analysis of residues forming hydrogen bonds in the
Rieske [2Fe–2S] cluster of the cytochrome bc
1
com-
plex in Paracoccus denitrificans. Eur J Biochem 255,
100–106.
58 Moss D, Nabedryk E, Breton J & Ma
¨
ntele W (1990)
Redox-linked conformational changes in proteins
detected by a combination of infrared spectroscopy and
protein electrochemistry. Evaluation of the technique
with cytochrome c. Eur J Biochem 187, 565–572.
59 Hellwig P, Behr J, Ostermeier C, Richter OM, Pfitzner
U, Odenwald A, Ludwig B, Michel H & Ma
¨
ntele W
(1998) Involvement of glutamic acid 278 in the redox
reaction of the cytochrome c oxidase from Paracoccus
denitrificans investigated by FT-IR spectroscopy. Bio-
chemistry 37, 7390–7399.
T. Kleinschroth et al. Infrared spectroscopic characterization of mutations in the Q
o
site
FEBS Journal 275 (2008) 4773–4785 ª 2008 The Authors Journal compilation ª 2008 FEBS 4785