Báo cáo khoa học: Increased glucose metabolism and ATP level in brain tissue of Huntington’s disease transgenic mice pdf
Bạn đang xem bản rút gọn của tài liệu. Xem và tải ngay bản đầy đủ của tài liệu tại đây (388.89 KB, 16 trang )
Increased glucose metabolism and ATP level in brain
tissue of Huntington’s disease transgenic mice
Judit Ola
´
h
1
,Pe
´
ter Klive
´
nyi
2
, Gabriella Gardia
´
n
2
,La
´
szlo
´
Ve
´
csei
2
, Ferenc Orosz
1
, Gabor G. Kovacs
3
,
Hans V. Westerhoff
4,5
and Judit Ova
´
di
1
1 Institute of Enzymology, Biological Research Center, Hungarian Academy of Sciences, Budapest, Hungary
2 Department of Neurology, University of Szeged, Hungary
3 Institute of Neurology, Medical University Vienna, Wien, Austria
4 Department of Molecular Cell Physiology, Netherlands Institute for Systems Biology, Free University, Amsterdam, Netherlands
5 Manchester Centre for Integrative Systems Biology, UK
Keywords
biosimulation; channelling; energy
metabolism; glycolysis activation;
Huntington’s disease
Correspondence
J. Ova
´
di, Institute of Enzymology, Biological
Research Center, Hungarian Academy of
Sciences, Karolina u
´
t 29, H-1113 Budapest,
Hungary
Fax: +36 1 466 5465
Tel: +36 1 279 3129
E-mail:
Website: />Note
The mathematical models described here
have been submitted to the Online Cellular
Systems Modelling Database and can be
accessed free of charge at chem.
sun.ac.za/database/olah2cc/index.html;
/>olah2cb/index.html; .
za/database/olah2hdc/index.html; http://
jjj.biochem.sun.ac.za/database/olah2hdb/
index.html
(Received 17 June 2008, revised 17 July
2008, accepted 23 July 2008)
doi:10.1111/j.1742-4658.2008.06612.x
Huntington’s disease (HD) is a progressive neurodegenerative disorder
characterized by multifarious dysfunctional alterations including mitochon-
drial impairment. In the present study, the formation of inclusions caused
by the mutation of huntingtin protein and its relationship with changes in
energy metabolism and with pathological alterations were investigated both
in transgenic and 3-nitropropionic acid-treated mouse models for HD. The
HD and normal mice were characterized clinically; the affected brain
regions were identified by immunohistochemistry and used for biochemical
analysis of the ATP-producing systems in the cytosolic and the mitochon-
drial compartments. In both HD models, the activities of some glycolytic
enzymes were somewhat higher. By contrast, the activity of glyceraldehyde-
3-phosphate dehydrogenase was much lower in the affected region of the
brain compared to that of the control. Paradoxically, at the system level,
glucose conversion into lactate was enhanced in cytosolic extracts from the
HD brain tissue, and the level of ATP was higher in the tissue itself. The
paradox could be resolved by taking all the observed changes in glycolytic
enzymes into account, ensuing an experiment-based detailed mathematical
model of the glycolytic pathway. The mathematical modelling using the
experimentally determined kinetic parameters of the individual enzymes
and the well-established rate equations predicted the measured flux and
concentrations in the case of the control. The same mathematical model
with the experimentally determined altered V
max
values of the enzymes did
account for an increase of glycolytic flux in the HD sample, although the
extent of the increase was not predicted quantitatively. This suggested a
somewhat altered regulation of this major metabolic pathway in HD tissue.
We then used the mathematical model to develop a hypothesis for a new
regulatory interaction that might account for the observed changes; in HD,
glyceraldehyde-3-phosphate dehydrogenase may be in closer proximity
(perhaps because of the binding of glyceraldehyde-3-phosphate dehydro-
genase to huntingtin) with aldolase and engage in channelling for
Abbreviations
3-NP, 3-nitropropionic acid; CK, creatine kinase; DHAP, dihydroxyacetone phosphate; GAP, glyceraldehyde-3-phosphate; GAPDH,
glyceraldehyde-3-phosphate dehydrogenase; GDH, glycerol-3-phosphate dehydrogenase; GFAP, glial fibrillar acidic protein; GLUDH,
glutamate dehydrogenase; HD, Huntington’s disease; HK, hexokinase; LDH, lactate dehydrogenase; PK, pyruvate kinase.
4740 FEBS Journal 275 (2008) 4740–4755 ª 2008 The Authors Journal compilation ª 2008 FEBS
Huntington’s disease (HD) is a progressive neurode-
generative disorder, which is inherited in an autosomal
dominant fashion [1]. It affects approximately one in
10 000 individuals. The disease is characterized by
motor and cognitive symptoms as well as personality
changes [2]. In HD, the neurodegeneration predomi-
nantly afflicts the medium spiny neurones in the stria-
tum, although loss of neurones in the deep layers of
the cerebral cortex has also been reported [3].
At the genetic level, HD is caused by the expansion
of the CAG repeat from 36 times up to 180 times. This
repeat codes for long stretches of polyglutamine in the
N-terminal region of huntingtin protein [4]. Various
disease mechanisms have been suggested, including
transcriptional dysregulation, protein misfolding and
degradation, oxidative stress, excitotoxic processes,
impairment in intracellular transport or mitochondrial
function, and perturbation of synaptic transmission
[5,6]. However, the relationship between the expression
of mutant huntingtin protein and the dysfunction of
mitochondria that manifests itself in the energy impair-
ment suggested for HD [7] is not understood in detail.
Data from post mortem tissues (caudate and putamen
of the striatum) of HD patients [8,9] suggest decreased
activities of mitochondrial respiratory chain complexes.
However, the data referring to in vivo ATP, lactate,
creatine and phosphocreatine levels, as measured by
NMR in HD patients, are conflicting [10–12]. In a
recent study, striatal glucose metabolism has been
reported to be normal or reduced in presymptomatic
HD individuals, whereas striatal hypometabolism has
been observed consistently in symptomatic HD
patients. Thalamic and cerebellar hypermetabolism as
well as cortical hypometabolism and hypoperfusion
have also been seen in early stage and symptomatic
HD patients with positron emission tomography or
single-photon emission computed tomography [13].
In vitro binding of glyceraldehyde-3-phosphate dehy-
drogenase (GAPDH; EC 1.2.1.12), a glycolytic
enzyme, to the polyglutamine tail of the mutant pro-
tein has been reported [14]. However, the functional
consequences of this interaction are unclear. Various
scenarios have been proposed concerning the effect of
the CAG expansion on the GAPDH-related events,
including changes in the enzyme level or enzymatic
activity leading to cell death [15]. The activity of GAP-
DH was measured in HD post mortem brain [8,15]
and, even if it decreased in some specific brain regions,
the decrease was small [15]. Significantly decreased
GAPDH activity was detected in fibroblasts from HD
patients, specifically after the cells had been insulted in
various ways [16,17]. In HD transgenic mice, overex-
pression and nuclear translocation of the enzyme was
demonstrated in discrete populations of brain neurones
[18]. It has been suggested that the nuclear transloca-
tion and associated cytotoxicity of mutant huntingtin
is mediated by GAPDH and the ubiquitin-E3-ligase
Siah1 [19]. Because of the indications that GAPDH
may be involved in the pathology of HD, in the pres-
ent study we examined its role in HD tissue with an
emphasis on its metabolic roles.
The development of three different HD (neurotoxin-
treated, knock-in and transgenic) mouse models has
been a milestone in the research of the disease [20].
The mice administered with neurotoxin 3-nitropropionic
acid (3-NP) display characteristics of HD, including
clinical symptoms and striatal pathology [21,22]. The
first successful mouse model of HD was that of the R6
mouse, which was generated by introducing and over-
expressing exon 1 of the human gene encoding
huntingtin with long CAG repeat expansions [23].
Low weight, diabetes, clasping, tremor and convulsions
are characteristics of the R6 ⁄ 2 line. The behavioural
anomalies are followed by an early death at
10–13 weeks. Pathological examination of the brain
revealed inclusions in the nucleus of most brain neuro-
nes as early as 7 weeks of age, which were preceded by
an abnormal location of huntingtin (i.e. in the nucleus)
[20]. A commonly used transgenic animal model is the
N171-82Q mouse, which expresses the first 171 amino
acids of human huntingtin with 82 polyglutamine
repeats exclusively in brain, with the level of the trans-
gene product remaining lower than the level of the
endogenous full-length huntingtin [24]. These animals
suffered a shortened lifespan, progressive behavioural
symptoms and other characteristics resembling the
pathology of HD patients. The phenotype begins at
approximately 90 days of age and, on average, death
occurs approximately 45 days later [24,25]. These
mouse models offer the possibility to test the idea that
HD is indeed associated causally with altered activity
or concentration of GAPDH.
glyceraldehyde-3-phosphate. By contrast to most of the speculation in the
literature, our results suggest that the neuronal damage in HD tissue may
be associated with increased energy metabolism at the tissue level leading
to modified levels of various intermediary metabolites with pathological
consequences.
J. Ola
´
h et al. Energy metabolism in HD transgenic mice
FEBS Journal 275 (2008) 4740–4755 ª 2008 The Authors Journal compilation ª 2008 FEBS 4741
Mitochondrial dysfunction and the associated
impairment of energy metabolism are among the main
reasons thought to underlie the pathogenesis of HD. It
has been proposed to be directly connected with the
impairment of energy metabolism in HD [5,6].
Reduced ATP production was suggested to be due to
the inhibition of the activities of mitochondrial com-
plexes of electron transport; the inhibition of the activ-
ity of complex II was indeed observed in brain of
mouse treated with 3-NP [22].
In the present study, a kinetic analysis of both
glycolysis and the mitochondrial respiratory chain is
presented comparing affected with non-affected regions
of the brain of N171-82Q transgenic and 3-NP treated
mice. The results obtained from an integrated experi-
mentation and modelling reveal and suggest relations
between the changes in morphology, glycolytic flux,
ATP production and ATP levels.
The mathematical models described here have been
submitted to the Online Cellular Systems Modelling
Database and can be accessed free of charge at
/>html; . ac.za/database/ol ah2cb/index.
html; />index.html; />index.html.
Results
Characterization of the HD mouse model: clinical
symptoms, protein expression and identification
of the affected brain areas
In our experiments, N171-82Q transgenic and normal
control mice [24] were used. The transgenic mice devel-
oped a progressive neurological disorder starting at
12–16 weeks of age, and exhibited an uncoordinated
gait, hypoactivity, stereotypic movements and shaking-
like tremor. In the end-stage (20–24 weeks of age), the
mice lost weight and appeared to be less responsive to
stimuli and severely hypokinetic. Chronic, systemic
administration of 3-NP to normal mice resulted in an
initial motor hypoactivity followed by occasional peri-
ods of hyperactivity with abnormal movements, includ-
ing irregular tremor, head bobbing, head tilting and
circling.
The levels of the endogenous (wild-type) huntingtin
protein and the transgene product were examined by
western blotting using anti-huntingtin serum raised
against the first 17 amino acids of the N-terminal part
of the protein. We found that the N171-82Q mutant
protein was expressed in the brain homogenates. How-
ever, its level was significantly lower than that of the
mouse wild-type (data not shown) in accordance with
the data available in the literature [24].
The affected and the unaffected brain tissues as well
as the whole brain of the HD and of control mice were
used for our studies. The affected brain regions were
identified by immunohistochemistry using anti-ubiqu-
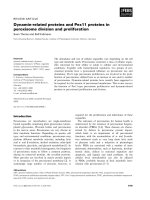
itin and anti-huntingtin sera (Fig. 1). In the control
mice, neither huntingtin nor ubiquitin immunoreactive
nuclear inclusions were detected. Nuclear inclusions
were found in the granular layer of the cerebellum of
the transgenic mice (Table 1 and Fig. 1A,B) in agree-
ment with the literature [24]. Significant numbers of
inclusions were detected in the hippocampus (Table 1).
Some of these nuclear inclusions were huntingtin and
ubiquitin immunopositive in four out of five animals
AB
CD
EF
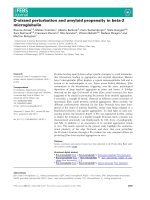
Fig. 1. Immunohistochemistry for (A) huntingtin, (B) ubiquitin and
(C–F) GFAP in the transgenic mice examined. Representative pho-
tographs of the (A, B, F) granular layer of the cerebellum, (C) hippo-
campus, (D) frontal cortex and (E) striatum. Magnification: ·400 (A,
B), ·100 (C–F). Arrows indicate representative dark brown anti-hun-
tingtin and anti-ubiquitin immunoreactive nuclear inclusions visible
in blue nuclei stained with hematoxylin nuclear stain. Anti-GFAP
immunopositive, reactive astrocytes, which should be stained
brown, were not demonstrated in the frontal cortex, nor the basal
ganglia and the cerebellar cortex. (D–F) Note the usual GFAP immu-
nopositivity of nonreactive fibrillary astrocytes in the white matter.
WM, white matter; CC, corpus callosum; Mol, molecular layer;
Gran, granular layer of the cerebellum.
Energy metabolism in HD transgenic mice J. Ola
´
h et al.
4742 FEBS Journal 275 (2008) 4740–4755 ª 2008 The Authors Journal compilation ª 2008 FEBS
in the striatum and in a single animal in the frontal
cortex (Table 1). Prominent reactive astrogliosis, a
characteristic feature of the early neuronal damage in
HD [26], was demonstrated in the hippocampus by
anti-glial fibrillar acidic protein (GFAP) immuno-
staining (Fig. 1C); this was mild in the frontal cortex
(Fig. 1D). Virtually no such immunoreactivity was
found in the striatum (Fig. 1E) and cerebellar cortex
(Fig. 1F). On the basis of these data, the posterior por-
tion, which includes the major part of the striatum,
thalamus and hippocampus, was used to represent the
HD-affected region. By contrast, neither inclusion for-
mation nor early neuronal damage befell for the ante-
rior portion of the brain, which includes the frontal
cortex and minor part of the striatum, whereas the cer-
ebellum contained large numbers of inclusions without
evidence of neuronal damage.
The neurotoxin 3-NP-administered mice had some
features characteristic for HD, including clinical symp-
toms and striatal pathology, as described previously
[21].
The glycolytic enzymes
Glucose is the major Gibbs energy source of brain. It
is metabolized primarily via glycolysis. To evaluate the
effect of the expression of the mutant huntingtin pro-
tein on the molecular basis of glycolysis, we measured
the activities of the glycolytic enzymes (Table 2). Cell-
free extracts were prepared from the affected (poster-
ior) and unaffected (anterior and cerebellum) regions
of the HD, from the neurotoxin-administered as well
as from the control mice. In some cases, extracts were
prepared from the whole brain tissue as well.
The activities of three glycolytic enzymes [i.e. hexo-
kinase (HK; EC. 2.7.1.1), enolase (EC 4.2.1.11) and
pyruvate kinase (PK; EC. 2.7.1.40)] were slightly
higher in the posterior region of the transgenic HD
mice (Table 2), whereas no change was detected in the
unaffected regions (data not shown). In the 3-NP mice,
the activity of HK had increased more than in the
transgenic mice (Table 2).
Table 1. Semiquantitative scoring of reactive astrogliosis as
detected by GFAP immunostaining and of the number of nuclear
inclusions detected by ubiquitin and huntingtin immunostaining. ),
none; +, mild ⁄ occasional; ++, moderate; +++, severe ⁄ many. HD-3,
Huntington diseased animal, number 3 from the transgenic strain.
Region ⁄ alteration HD-1 HD-2 HD-3 HD-4 HD-5 Control
Reactive gliosis
Frontal cortex ) + ) ++)
Hippocampus +++ ++ +++ +++ +++ )
Striatum ))))))
Thalamus ))))))
Cerebellum ))))))
Brainstem )))++)
Nuclear inclusion
Frontal cortex + )))))
Hippocampus ++ + ++ ++ + )
Striatum + ) +++)
Thalamus ))))))
Cerebellum
a
+++ +++ +++ +++ ++ )
Brainstem ))))))
a
Granular layer of cerebellum.
Table 2. V
max
activities determined experimentally in posterior brain homogenates from the two mouse models of HD. Data are the means
of three to five different sets of experiments (three to five different animals) and the means ± SEM are shown. Differences were analysed
using Student’s t-test. ND, not determined. GPI, glucose-6-phosphate isomerase (EC 5.3.1.9); PFK, phosphofructokinase (EC 2.7.1.11); TPI,
triosephosphate isomerase (EC. 5.3.1.1).
Enzyme
(lmolÆg
)1
Æmin
)1
)
Mice treated with 3-NP Transgenic mice expressing N171-82Q
Control 3-NP Control N171-82Q
CFLP strain
N171-82Q ⁄ B6C3F1 strain, wild-type littermates
as control
HK 40 ± 12 70 ± 6 (P < 0.01) 11.4 ± 1.5 16.9 ± 1.6 (P < 0.05)
GPI 3290 ± 420 3210 ± 390 ND ND
PFK 420 ± 52 566 ± 61 (P < 0.10) 247 ± 50 256 ± 14
Aldolase 287 ± 35 234 ± 49 276 ± 40 238 ± 25
TPI 13800 ± 1400 13200 ± 1100 11100 ± 1090 10990 ± 1100
GAPDH 1180 ± 190 857 ± 63 (P < 0.10) 676 ± 30 388 ± 17 (P < 0.005)
Enolase ND ND 682 ± 23 868 ± 70 (P < 0.05)
PK 868 ± 130 639 ± 64 (P < 0.10) 358 ± 41 520 ± 67 (P < 0.10)
LDH 3110 ± 270 3390 ± 300 2490 ± 110 2030 ± 290
GDH ND ND 170 ± 25 165 ± 19
J. Ola
´
h et al. Energy metabolism in HD transgenic mice
FEBS Journal 275 (2008) 4740–4755 ª 2008 The Authors Journal compilation ª 2008 FEBS 4743
GAPDH
GAPDH was of special interest because it has been
reported to bind to the polyglutamine repeat of the
mutant huntingtin protein [14]. Indeed, GAPDH activ-
ity in the cell-free extracts from the affected (posterior)
region of both the transgenic mice and the neurotoxin-
treated animals was 30–50% lower than in the cell-free
extracts from the same regions of the control animals
(Table 2). Consistent with this, a smaller (15%)
decrease was detected in the GAPDH activities of the
whole brain homogenates of the diseased animals (data
not shown).
Because GAPDH activity was lower in the HD tis-
sues, we expected the concentration of the substrate of
this reaction to be increased in HD. In extracts of the
posterior brain region of control and HD mice in the
presence of excess ATP, NAD
+
, inorganic phosphate
and glucose, we determined the total concentration
of the triosephosphates [glyceraldehyde-3-phosphate
(GAP) and dihydroxyacetone phosphate (DHAP)].
Because of the small amount of posterior tissue of the
HD animals (used also for the immunohistochemistry
and for the optimization of the assay conditions), the
concentrations could only be determined at two time
points (35 and 120 min). In line with our expectation,
we found the total concentration to be increased in HD
(i.e. from some 18 lm to 24 lm at 35 min and 31 lm
at 120 min after addition of glucose; Fig. 2B). For the
second time point, the increase was highly significant
(P < 0.01).
Glycolysis at the system level: a surprise
The decrease in GAPDH activity accompanied by an
increase in triosephosphate concentrations suggested
that the difference between healthy and HD tissue
might well be understood in terms of the effect on
GAPDH activity and the consequences thereof.
Through sequestration of GAPDH, the increased
0.35
AB
CD
0.25
Absorbance at 340 nmPyruvate (µM)
DHAP + GAP (µ
M)
0.15
0
20 40 60 80
Time (min)
100 120
020406080
Time (min)
100 120
0
20 40 60 80
Time (min)
100
120 0 20 40 60 80
Time (min)
100
120
0.20
25
15
20
20
5
0
0.30
40
30
20
10
0
Lactate (µM)
800
600
400
200
0
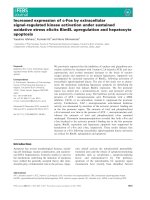
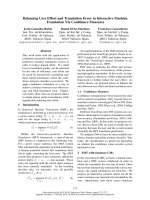
Fig. 2. Flux measurements (the conversion of glucose to lactate) and simulation in the posterior brain extracts of control and N171-82Q
transgenic mice. (A) The NADH absorbance in the control (solid line) and the transgenic N171-82Q (dashed line) mice. (B) Triosephosphate
formation, (C) pyruvate formation and (D) lactate production in the case of the control and the transgenic N171-82Q mice. (B–D) Measured
(circle for control, triangle for transgenic N171-82Q mice) and simulated (solid line for control, dashed line for transgenic N171-82Q mice)
curves are shown. The dotted lines show the results of the simulation for the transgenic N171-82Q mice when only the measured activities
of the glycolytic enzyme activities were taken into account (Table 2). The formation of metabolites (B–D) was followed by the two-step
method when, after HClO
4
precipitation and neutralization, the metabolites were determined by enzymatic assay. The protein concentration
was (A) 0.14 mgÆmL
)1
or (B–D) 0.28 mgÆmL
)1
in the cuvette. At least three different sets of experiments were carried out; the SEM for the
determination was ± 15% within each set of experiments.
Energy metabolism in HD transgenic mice J. Ola
´
h et al.
4744 FEBS Journal 275 (2008) 4740–4755 ª 2008 The Authors Journal compilation ª 2008 FEBS
expression level of huntingtin would lead to inactiva-
tion or degradation of the enzyme. The inhibition of
GAPDH would then also lead to a decreased glyco-
lytic flux and a decreased level of ATP, compromising
the affected cells energetically. We decided to test this
scenario. The glycolytic flux and the level of ATP,
however, are systemic properties (i.e. consequences
of the simultaneous activity of many enzymes) and
this required a different, more system biological
perspective.
The addition of glucose to the cell-free cytosolic
extract of normal and HD tissue should not only acti-
vate HK, but also set the glycolytic pathway in motion,
by filling the subsequent metabolite pools, ultimately
leading to the production of lactate. After a transient
period that is necessary to fill up the metabolite pools, a
(quasi-)steady state should be attained, in which the
metabolic intermediates become constant over time.
Because the product lactate is not taken away from the
medium in a cytosolic extract, its concentration should
increase with time. To the extent that glycolytic reac-
tions are sensitive to back pressure from lactate, as is the
lactate dehydrogenase reaction, their substrate concen-
trations also should increase with time. The results for
the control tissue (Fig. 2B–D, circles) are in line with the
above expectations. There was a substantial production
of lactate. The intermediate preceding lactate (i.e. pyru-
vate) increased in parallel, but to much lower levels,
whereas the intermediates DHAP and GAP, higher up
in the glycolytic chain, increased within 30 min to a
steady and low level of approximately 18 lm. Under
these conditions, the NADH ⁄ NAD
+
ratio reflects the
balance between the NADH oxidizing and the NAD
+
reducing reactions. As shown by the solid line in
Fig. 2A, during the first 60 min, there appeared to be a
net accumulation of NADH, in parallel to the accumu-
lation of pyruvate. This is in line with expected slight
deceleration of lactate dehydrogenase with increased
lactate concentrations. Thereafter, NADH decreased
somewhat with time.
The extract from the HD tissue exhibited qualita-
tively the same behaviour, with two exceptions. First,
expecting that the decreased activity of GAPDH had
led to a decreased glycolytic flux, we were surprised
to find that the rates of production of lactate and
pyruvate were approximately two-fold higher than in
the non-HD extracts. The flux almost doubled from
approximately 11 lmolÆg
)1
Æmin
)1
of lactate, but
remained well below the V
max
of the glycolytic
enzymes, becoming closest to that of hexokinase,
which increased from 11.4 to 16.9 lmolÆg
)1
Æmin
)1
(Table 2). Second, in HD, DHAP and GAP continued
to increase with time, as did the NADH.
Is the enhanced glycolytic flux consistent with
the altered enzyme activities?
The above experimental observation of an increased
flux through the glycolytic pathway, and presumably
also through the GAPDH step itself, appeared to be at
odds with the decreased GAPDH activity also
observed in the HD case. On the other hand, the activ-
ities of other glycolytic enzymes appeared to be
increased in HD and, after all, the flux is a collective
property of all the enzymes in the pathway. To exam-
ine this issue further, we needed a systems biology
approach [27–29]. We developed an experiment-based
mathematical model for the biosimulation of the glu-
cose metabolism in the cytosol of mouse brain. The
model included the kinetic parameters of the glycolytic
enzymes in normal brain tissues as established by our-
selves (Table 2) and others (Doc. S4). The rate equa-
tions of the individual enzyme reactions were also
taken from previous publications by ourselves and oth-
ers (Doc. S4). Together, the information used in the
model corresponds to the best possible knowledge
available in the current literature.
We first examined whether the fluxes and concen-
trations observed under normal conditions were in
line with what should be expected from the measured
activities of the individual enzymes. We computed
the time course of the formation of triosephosphates,
pyruvate and lactate in the control sample by using
the V
max
values of the glycolytic enzymes determined
experimentally (Table 2) at excess glucose, NAD
+
and ATP concentrations. Because we noticed that the
NADH was consumed by a side reaction, such as the
glycerol-3-phosphate dehydrogenase (GDH; EC.
1.1.1.8) catalysed reaction, we also determined the
V
max
value of this reaction in brain tissues (in this
case, there was no difference regardless of whether
control or HD samples were used) (Table 2). The
reactions with these kinetic parameters were included
in the basic model as well. As shown in Fig. 2B–D,
all three progress curves computed with the same
parameter set corresponded well to the values of the
measured metabolite concentrations for the control
case (full circles). Although the test with only six
data points (which is all we conducted in view of
sample limitations) is of limited strength, this finding
suggests that the model is appropriate to describe the
changes of the metabolite concentrations in time in
cytosolic extract.
We next considered whether the changes in enzyme
levels observed in HD could be responsible for the
paradoxical increase in glycolytic flux and reduced
activity of GAPDH. We computed the rate of the
J. Ola
´
h et al. Energy metabolism in HD transgenic mice
FEBS Journal 275 (2008) 4740–4755 ª 2008 The Authors Journal compilation ª 2008 FEBS 4745
formation of the same three metabolites [i.e. triose-
phosphates (Fig. 2B), pyruvate (Fig. 2C) and lactate
(Fig. 2D)] by using the V
max
values of the glycolytic
enzymes determined experimentally for the HD brain
sample (Table 2). The computed fluxes (Fig. 2B–D,
dotted lines) were significantly higher than that of
the control, consistent with the data presented in
Fig. 2A. This suggested that a decreased activity of
GAPDH was consistent with an increase in flux.
Because hexokinase had a much higher control coeffi-
cient with respect to the glycolytic flux (not shown),
its increase more than compensated for the decrease
in GAPDH activity. We conclude that the increased
glycolytic flux in HD is consistent with the reduced
GAPDH activity.
Activity of mitochondrial complexes
In the intact tissue, some of the pyruvate should be
oxidized by pyruvate dehydrogenase complex in the
mitochondria rather than by lactate dehydrogenase
(LDH; EC. 1.1.1.27), with the carbon then entering
the tricarboxylic acid cycle and the corresponding
redox equivalents being oxidized by the mitochon-
drial respiratory chain. We therefore determined the
activities of the mitochondrial complexes in homo-
genates of mitochondria isolated from the brains of
control and HD mice. Due to the limited availability
of posterior section material, whole brain tissues
were used for these experiments. As shown in
Table 3, there was no decrease in the activities of
the mitochondrial complexes in the case of the trans-
genic HD mice. Complex I activity was increased sig-
nificantly and the activities of other complexes
appeared unchanged. As expected, the activity of
complex II was reduced (to 20%) in mice treated
with 3-NP. The activity of glutamate dehydrogenase
(GLUDH; EC. 1.4.1.2), a mitochondrial marker
enzyme, was increased by approximately 50% in
both the 3-NP treated and the transgenic mice. We
conclude that HD per se may not be accompanied
by a reduced activity of the mitochondrial respira-
tory chain, but that an increase of GLUDH may be
part of the pathology. Potentially, an increased mito-
chondrial compartment, defined in terms of GLUDH
activity, compensates for decreased activities of com-
plexes II-IV per mitochondrion.
ATP level
The increased glycolytic activity at constant activity of
the mitochondrial respiratory chain would suggest an
increased activity of ATP synthesis. To examine
whether this increased activity was reflected by an
increased level of ATP, we determined the ATP con-
centration in the homogenate of the posterior brain
regions of control and transgenic N171-82Q mice by
enzymatic assay. The ATP concentration in the control
sample was almost 3 lmolÆg
)1
of protein, which is sim-
ilar to the concentration previously reported [30]. As
shown in Table 4, the ATP concentration was two-fold
higher in the HD sample. Significantly higher ATP
concentrations were established in several experiments
using either affected or whole brain extracts of the HD
mice compared to normal mice. Due to the limited
availability of HD brain sample, the ADP could not
be measured.
As further indicators of energy metabolism, we
looked at creatine and creatine kinase (CK; EC
2.7.3.2). We found that the CK activity was slightly
increased in HD tissue. This was accompanied by a
decrease in the creatine concentration in the transgene
mice compared to the control (Table 4).
Table 3. Mitochondrial complex activities in the different mouse
models of HD. Data are the means of three to five different sets of
experiments (individual mice), and the means ± SEM are shown.
Differences were analysed using Student’s t-test. In the case of
3-NP treated mice, two or three mice were investigated. ND, not
determined.
Whole brain
homogenate,
(lmolÆg
)1
Æmin
)1
) Control
Mice
treated
with 3-NP
Transgenic mice
expressing
N171-82Q
GLUDH 24 ± 4 38 ± 3
(P < 0.05)
37 ± 0.6 (P < 0.05)
Complex I 26 ± 3 26 ± 3 35 ± 2 (P < 0.05)
Complex II 141 ± 15 27 ± 2
(P < 0.005)
157 ± 27
Complex I ⁄ III 28 ± 6 ND 25 ± 4
Complex II ⁄ III 195 ± 13 ND 191 ± 10
Complex IV 1060 ± 220 ND 969 ± 34
Table 4. Metabolite concentrations and CK activity in the trans-
genic mouse model of HD. Data are the means of three to five
measurements. Usually three to five different sets of experiments
were carried out and the means ± SEM are shown. Differences
were analysed using Student’s t-test.
Posterior brain
homogenate Control
Transgenic mice
expressing N171-82Q
CK (lmolÆg
)1
Æmin
)1
) 2040 ± 220 2308 ± 190
Creatine (lmolÆg
)1
protein) 149 ± 11 116 ± 20 (P < 0.10)
Lactate (lmolÆg
)1
protein) 402 ± 95 336 ± 81
ATP (lmolÆg
)1
protein) 2.8 ± 0.4 6.4 ± 1.4 (P < 0.05)
Energy metabolism in HD transgenic mice J. Ola
´
h et al.
4746 FEBS Journal 275 (2008) 4740–4755 ª 2008 The Authors Journal compilation ª 2008 FEBS
Learning from an iteration between modelling
and experimentation
Although Fig. 2 shows that the increased in glycolytic
flux was consistent with the decreased GAPDH activ-
ity, the correspondence between experimental and
modelling results for the HD case was incomplete. In
particular, the increase in HD of the pyruvate was
smaller, and the increase in lactate flux was stronger
than predicted on the basis of the changes in V
max
.
We examined the possibility that not only the expres-
sion levels of the same isoenzymes was altered in HD,
but also different isoenzymes had been brought to
expression, or that our in vitro V
max
changes were not
quite representative of the flux changes in the cyosolic
extract. As summarized in Table 5, a further increase
in the V
max
values of all glycolytic enzymes, or of
only HK, did not result in good fits for lactate and
pyruvate. An increase of the V
max
of GAPDH to that
of the control sample without, or with, an increase of
HK activity was also unsuccessful. Subsequently, we
reduced the K
m
values of GAP for GAPDH, which
resulted in positive alterations. The optimal parameter
set for the computation of the concentrations of the
three glycolytic intermediates was obtained when the
K
m
values of GAP for the GAPDH and aldolase (EC
4.1.2.13) were decreased, and the V
max
value of HK
reaction was increased (model 6b) to the same extent
as observed with the sample of neurotoxin-treated
mice (Table 2). Tables 2 and 5 show the parameters
used for successful simulation of the three metabolites
(triosephosphates, pyruvate and lactate) measured
with control and HD samples under test tube condi-
tions.
Prediction of the steady-state flux and
intermediate concentrations in the posterior
regions of intact brain in normal and HD mice
The availability of an in silico representation of the
glycolytic pathway in both normal and HD brain
offers the potential for prediction of other properties
that have not been or cannot be measured. First, we
computed the conversion of glucose to pyruvate with
the equations and parameter sets found to be optimal
to describe the experimentally determined data for the
normal and HD brain tissue extracts. We were con-
fronted with the fact that the respective V
max
had been
measured in diluted extracts; to correct for the dilu-
tions, the concentrations (V
max
values) of the indivi-
dual enzymes as determined in the cytosolic extract
were increased 100-fold, which corresponds to an
in vivo concentration of approximately 30 gÆL
)1
of
cytosolic protein. The concentrations and ratios of
nucleotides, NAD
+
⁄ NADH (1 mm ⁄ 0.1 mm) and
ATP ⁄ ADP (2 mm ⁄ 0.2 mm) were kept constant at levels
corresponding to the intracellular ones [31]. The
glucose concentration (2 mm) was also kept constant
corresponding to equilibrated influx of glucose. A
constant efflux rate constant and first-order kinetics
were assumed for pyruvate transport from the cyt-
oplasm into the mitochondrium, which ensured a
Table 5. Searching for the optimal parameter set for computation of the changes of glycolytic metabolites measured experimentally. Rows
refer to subsequent models in the optimization series. The ‘basic’ model was evaluated using the rate equations and the experimentally
determined kinetic parameters of the individual enzymes (see Table 2 and Doc. S4). The criteria for the goodness of simulation is based
upon the deviation of the simulated metabolite concentrations from the measured ones: good and very good indicate semi-quantitatively less
than 15% and 5% deviations, respectively. The reasons why the simulations are not satisfactory for a given metabolite concentration in
models 1–5 are shown qualitatively. There is no significant difference between models 6a and 6b, and both of them are suitable for the sim-
ulation of the measured metabolite concentrations. For details, see Experimental procedures and (Doc. S4).
Varied parameters in HD model as
compared to the ‘basic’ model
Effects of varied parameters on the goodness of simulation
DHAP + GAP Pyruvate Lactate
1. All measured V
max
increased by 30% Good Too high Little low
2. V
max
(HK) increased by 30% Good Too high Too low
3. V
max
(GAPDH) two-fold increase Little low Good Too low
4. 2 and 3 Good Too high Little low
5a K
m
GAP
(GAPDH) from 20 to 5 lM Too low Too low Too low
5b K
m
GAP
(GAPDH) from 20 to 5 lM
K
m
GAP
(aldolase) from 300 to 75 lM
Too low Too low Too low
6a 2 and 5a Good Very good Very good
6b 2 and 5b Good Very good Very good
J. Ola
´
h et al. Energy metabolism in HD transgenic mice
FEBS Journal 275 (2008) 4740–4755 ª 2008 The Authors Journal compilation ª 2008 FEBS 4747
realistic steady-state concentration of pyruvate (80 lm)
in the cytosol. Figure 3A shows the predicted time
courses of the glycolytic pathway reaching the steady-
state under in vivo conditions for the control and HD
brain tissues. Because of the enhanced protein concen-
trations, there is a much reduced lag phase compared
to that shown in Fig. 2. The steady-state flux is again
predicted to be enhanced by a factor of 1.8 in the
case of the HD brain compared to that of the normal
control.
Next, we analysed the consequences of the increased
intracellular ATP level measured in the HD sample
(Table 4). The simulation predicted that the two-fold
increase in the ATP concentration did not alter the
steady-state flux of glycolysis (data not shown). We
found that further variation of the concentrations
of ADP (0.2–2 mm), NADH (0.1–1 mm) and NAD
+
(1–2 mm) lead to an indistinguishable alteration in the
glycolytic flux (data not shown).
The model used for prediction of the glycolytic
fluxes also rendered it possible to estimate the steady-
state metabolite levels. Figure 3B shows the changes of
metabolite concentrations in the HD brain relative to
the normal one. Comparison of the metabolite patterns
calculated for the normal and HD brains revealed that:
(a) the doubling of the ATP concentration should
result in an enormous increase of all metabolite levels
related to GAPDH and aldolase and (b) the absence
of the reduction of K
m
of GAP for GAPDH and
aldolase should cause an elevation of all metabolite
levels related to these enzymes. Therefore, the appar-
ently modest alterations in the activities of the glyco-
lytic enzymes should be expected to affect the pattern
of glycolytic intermediates. This might lead to signifi-
cant alterations of related pathways.
Discussion
HD, one of the most extensively studied neurological
disorders, is representative of a number of inherited
diseases. The initiation of the disease process depends
on the size of polyglutamine tails [32]. The cognitive
and psychiatric decline is caused by the demise of
neurones, most frequently in the caudate nucleus of
the striatum within the basal ganglia of the brain.
Nevertheless, we found the granular layer of the cere-
bellum to be enriched in nuclear inclusions without
evidence of neuronal loss, indicating that there is no
complete correlation between the presence of inclu-
sions and neuronal damage. Recently, Arrasate et al.
[33] demonstrated that inclusion body formation could
act as a coping response to the presence of mutant
huntingtin because it prolonged neuronal survival by
1.5
A
B
1.2
0.9
Steady-state rate of PK (mM·min
–1
)
0.6
0.3
0.0
2500
1500
Steady-state metabolite concentrations
100%*(HD-C)/C
2000
1000
400
300
200
100
0
G6P
F6P FBP DHAP GAP BPG P3G P2G PEP Pyr
0 204060
Time (min)
80
100
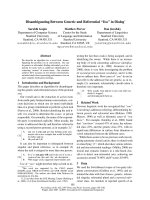
Fig. 3. Simulation of the glycolysis. (A) The steady-state flux of
glucose conversion to lactate was simulated with the ‘optimal’
parameter set and rate equations shown in Table 2, Table 5
(model 6b for the HD brain) and the Supporting information
(Doc. S4) for the control (solid line) and the transgenic N171-82Q
mice (dashed line). Simulation for the transgenic mice (dotted line)
was also performed with a parameter set containing only the alter-
ations detected in the activities of HK, GAPDH, enolase and PK.
The concentrations of ATP (2 m
M), ADP (0.2 mM), NAD (1 mM)
and NADH (0.1 m
M) were kept constant. (B) The steady-state con-
centrations of the metabolites in the HD sample relative to those
of the control were computed for the transgenic mice at reduced
K
m
(GAP) for GAPDH and aldolase, and increased V
max
for HK
(Table 5, model 6b) at 2 m
M ATP concentration (white columns)
and at 4 m
M ATP concentration (black columns). The simulation
was also carried out for the transgenic mice when no reduction in
the K
m
(GAP) for GAPDH and aldolase was included at 2 mM ATP
concentration (striped columns). The steady-state metabolite levels
in the case of control mice were 5.45, 0.85, 241, 23.8, 1.93, 20.8,
18.4, 2.58, 6.79 and 89.6 l
M for glucose-6-phosphate (G6P), fruc-
tose-6-phosphate (F6P), fructose 1,6-bisphosphate (FBP), DHAP,
GAP, 1,3-bisphosphoglycerate (BPG), 3-phosphoglycerate (P3G),
2-phosphoglycerate (P2G), phosphoenolpyruvate (PEP) and pyru-
vate, respectively.
Energy metabolism in HD transgenic mice J. Ola
´
h et al.
4748 FEBS Journal 275 (2008) 4740–4755 ª 2008 The Authors Journal compilation ª 2008 FEBS
reducing the intracellular level of the toxic, diffuse
form of mutant protein. The expression of the mutant
huntingtin protein generally leads to mitochondrial
dysfunction via direct or indirect effects. Decreased
mitochondrial ATP production is considered to be a
dominant characteristic of mitochondrial dysfunction
[34]. Studies on STHdh
Q111
striatal cells suggested that
the polyglutamine track implicated a dominant role of
huntingtin in mitochondrial energy metabolism by reg-
ulating the mitochondrial ADP-phosphorylation in a
Ca
2+
-dependent process [35]. The significantly
increased activity of the CK system was considered as
a compensatory mechanism for the decreased ATP
level [36]. Dietary creatine supplementation delayed
the behavioural and neuropathological phenotype and
extended survival in N171-82Q mice [37], and creatine
has also been shown to be protective in mitochondrial
toxin models of HD [38]. In the striatum of HD
patients, a decreased creatine level was found [11],
which correlated with both clinical symptoms and
CAG repeat number. These results parallel ours,
namely, a modest increase in the activity of CK and a
small decrease in the creatine level in the HD animal
(Table 4). However, these small alterations could not
result in significant increased ATP concentration that
we found in brain tissue of HD transgenic mice
compared to the control. The CK reaction is a side
reaction to ATP synthesis only, and is unsuitable for
long-time buffering of energetics.
In normal brain, the ATP level is controlled by ATP
producing and ATP consuming processes. The main
Gibbs energy (ATP) source in brain is glucose, which
is metabolized by glycolysis in the cytosol to pyruvate,
from which the terminal oxidation machinery in the
mitochondrial compartment produces the major
amount of ATP. Because we found much more signifi-
cant alterations in the activities of the glycolytic
enzymes (Table 2) than in the mitochondrial complexes
(Table 3), we focused on an analysis of the kinetic
parameters of the glycolytic enzymes, and on glycolytic
flux, which should ultimately parallel both glycolytic
and mitochondrial ATP production.
The enzyme GAPDH has been proposed to play a
central role in causing the energy defect of HD brain
[14]. Various scenarios have been suggested regarding
the possible nature of the involvement of GAPDH and
the CAG expansion of the mutant huntingtin protein.
One such scenario is that the interaction between poly-
glutamine-containing proteins and GAPDH results in
a reduced activity of this energy-metabolizing enzyme,
leading to cell death in susceptible brain areas due to
decreased energy stores [15]. In another scenario,
the aberrant huntingtin-GAPDH interaction leads to
overexpression of the enzyme and to cell death by
apoptosis [15].
In the present study, we compared the activity of
GAPDH in the posterior region, including hippocam-
pus, striatum and thalamus (Table 1 and Fig. 1) of
HD transgenic and 3-NP-treated mice, with that of the
corresponding region of control mice. The activity
measurements carried out at substrate saturation (V
max
conditions) showed that the GAPDH activity
decreased by approximately 50% in both mouse mod-
els (Table 2). No difference was detected when the
unaffected regions of the HD and control animals were
compared (data not shown).
The decreased activity of the GAPDH due to the
expression of mutant huntingtin protein that we
observed is supported by the results obtained from
fibroblast experiments (J. Ola
´
h, J. Rasko
´
, F. Uler,
J. Ova
´
di, unpublished results). The fibroblast cells were
established from HD patients with different CAG
repeat extensions. We found that the GAPDH activity
was reduced by 20–55% with respect to the control,
without clear correlation between the extension of
CAG repeats and decrease of GAPDH activity. This
result is consistent with that reported from other
laboratories [16,17]. Thus, we suggest that the presence
of the mutant huntingtin protein in HD transgenic
mice, and the neurotoxin treatment in wild-type mice
causes the substantial loss of GAPDH activity.
These findings apparently contradict those obtained
with postmortem brain tissues [8,15]. In morpholo-
gically affected and unaffected regions of the post
mortem brain in the case of CAG repeat disorders, the
activity of GAPDH bound to the mutant proteins [15]
was normal or near normal. One way to interpret these
data is that the inhibition of GAPDH by its inter-
action with the mutant huntingtin protein does not
persist in post mortem brain tissue due to the revers-
ibility of the inhibition.
Despite the fact that the activity of GAPDH was
found to be decreased in both mouse models, we mea-
sured a higher glycolytic flux in the case of the HD
sample compared to the control (Fig. 2). This finding
was verified by measuring the glycolytic flux in differ-
ent brain regions of HD mice (posterior, anterior and
cerebellum). The most affected (posterior) region
exhibited the fastest glycolytic flux, and other regions
showed modest but still higher flux compared to that
of the corresponding regions of the control (data
not shown). This finding is consistent with the results
of a recent study where glucose metabolism varied
depending on the region used for measurements
[13]. Using positron emission tomography, decreased
striatal glucose metabolism, thalamic and cerebellar
J. Ola
´
h et al. Energy metabolism in HD transgenic mice
FEBS Journal 275 (2008) 4740–4755 ª 2008 The Authors Journal compilation ª 2008 FEBS 4749
hypermetabolism were detected in the case of HD
patients. Thus, we propose that the characteristic
enhancement of the initial conversion rate of glucose
coupled with NAD
+
⁄ NADH conversion could be a
marker for early diagnosis of HD. Indeed, increased
metabolism was recently explored in the R6 ⁄ 2 mouse
model of HD as detected by the increased oxygen
consumption, which was coupled with weight loss [39].
We also noticed weight loss in HD mice during the
development of the disease.
Our results appeared to be internally inconsistent
when focusing on GAPDH alone: the level of this
enzyme was decreased, leading to the observed increase
in triosephosphates. However, a decrease in glycolytic
flux and ATP levels might be expected if this were the
sole initial change in HD. The mathematical modelling
based upon the measured kinetic parameters of the
individual enzymes determined experimentally
(Table 2) and the rate equations of the enzyme reac-
tions (Doc. S4) rendered it possible to examine this
molecule-based expectation in terms of the possible
network effects. Our calculations revealed that the
altered activities of the glycolytic enzymes determined
in the affected region of HD transgenic mice should
enhance the rate of the glycolytic flux compared to the
control, even though the GAPDH activity was
decreased rather than increased in HD. The minor
increased activity of hexokinase should be expected to
have more effect on the flux because that enzyme has
a higher flux control coefficient than GAPDH.
ATP levels were up rather than down in HD tissues.
Taken together, the findings of reduced GAPDH activ-
ity, increased glycolytic flux and increased ATP suggest
that the previous hypotheses [14,15], in which reduced
GAPDH function lead to decreased energy metabo-
lism, reduced ATP levels and hence the further pathol-
ogy of HD, may not apply to our experimental model
system, and perhaps not to HD either.
To learn more from the experimental data, we
engaged in inverse modelling, aiming to find changes
in regulation that might explain the slight differences
between the experimental and modelling results. The
optimal parameter set that appropriately described the
time-dependent concentration of the three metabolites,
triosephosphates, pyruvate and lactate, contained the
reduction of K
m
values of GAP for GAPDH and
aldolase. The reduction of these K
m
values predicted
by simulation could not be detected in the individual
enzyme assays. This situation occurred at the system
level when the intermediate could be directly trans-
ferred from the active site of the donor enzyme to that
of the acceptor enzyme without its diffusion into the
bulk solution [40]. The hypothesized channelling of
GAP derived by the heterologous enzyme association,
aldolase ⁄ GAPDH, could be promoted by the sticking
of GAPDH to the polyglutamine tail of the mutant
huntingtin protein, as proposed previously [14]. We
have no direct evidence for the direct interaction of
GAPDH and mutant huntingtin, nor for the micro-
compartmentation of GAP in pathological brain; how-
ever, the in vitro binding data [14] and our
experimental-based modelling may provide a plausible
explanation for the mechanism manifests itself only in
the HD brain tissue.
The mathematical modelling made it possible to pre-
dict the metabolic state and the steady-state flux of
glucose metabolism at more physiological conditions
(i.e. at higher protein concentrations) than used in the
test tube experiments. The biosimulation referring to
steady-state conditions at high protein concentrations
suggested that HD could result in a significant shift in
the metabolic state of the brain tissue in the case of
the transgenic mice (Fig. 3), which could then affect
other cellular processes. For example, the elevation of
hexosephosphate concentrations may influence the pen-
thosephosphate pathway by increasing the rate of the
reaction catalysed by glucose-6-phosphate dehydroge-
nase (EC 1.1.1.49). Jenkins et al. [41,42] investigated
the impact of CAG repeat length, huntingtin protein
length and protein context on cerebral metabolism in
HD. They found significant alterations in N-acetyl-
aspartate, glutamine, glutamate and glucose levels and
suggested that the development of the disease could be
related to a fundamental perturbation of the metabolic
status. The different energy state found for the HD-
affected brain could influence many ATP-related meta-
bolic, signalling, membrane and proteolytic processes.
The data obtained in the present study did not
reveal decreased mitochondrial complex activities in
the N171-82Q mouse model. This observation is in
accordance with those of Guidetti et al. [43], who
obtained similar data with full-length mutant hunting-
tin cDNA transgenic mice. Examination of the neostri-
atum and cerebral cortex in human presymptomatic
and pathological grade 1 HD cases also showed no
change in the activity of mitochondrial complexes
I–IV; reduced activities of mitochondrial complexes
were found only in late-stage HD brains [43]. These
data may indicate that the mitochondrial dysfunction
established in HD mice is not necessarily concomitant
with the reduced activity of mitochondrial complexes.
It could be suggested that the mitochondrial energy
impairment is a consequence, rather than a cause, of
early neuropathological changes. It should be noted
that, in the 3-NP-treated mouse model, and in
accordance with other reports [44], the activity of
Energy metabolism in HD transgenic mice J. Ola
´
h et al.
4750 FEBS Journal 275 (2008) 4740–4755 ª 2008 The Authors Journal compilation ª 2008 FEBS
mitochondrial complex II was depressed. This was
accompanied by alterations in the activities of some
glycolytic enzymes that were not identical to those
obtained with transgenic mouse (Table 2), despite the
fact that the 3-NP induced striatal pathology
resembled the observed pathology in HD patients [21].
Finally, one more issue that needs to be discussed is
the relation of the damaged neurones and the
enhanced ATP concentration at the tissue level demon-
strated in the present study. The higher ATP concen-
tration might be explained by faster glycolytic flux in
HD brain relative to the control. This does not mean,
however, that this situation exists in the vulnerable
striatal neurones in HD. Our studies were performed
with brain tissues containing different types of neuro-
nal cells as well as a large excess of glial cells. Astro-
cytes, a sub-type of the glial cells (outnumbering the
neurones by ten to one), play a critical role as an
important Gibbs energy source, with interactions
between neurones and astrocytes being critical for
brain energy metabolism [45]. Despite the fact that glu-
cose is the primary energy source for both neurones
and astrocytes [46], neurones can utilize glial-produced
lactate as an additional energy substrate in special situ-
ations [47]. The appearance of the ‘sick’ neuronal cells
may switch on signaling process(es) resulting in
enhanced intracellular (glial) ATP levels. Therefore, a
plausible explanation for our finding of an increased
ATP level in HD brain, as previously shown in a stria-
tal cell line [35], is that the reduced neuronal ATP level
could be compensated ⁄ overcompensated by the activ-
ity ⁄ activation of the ATP producing machinery of the
astrocytes at the tissue level. In a recent review, activa-
tion of microglia was reported in HD patients, which
could result in a self-propagating inflammatory cascade
leading to apoptosis, or might play a protective role
by promoting neurogenesis [48]. Microglial activation
often precedes any reaction of other cell types in the
brain. NO-mediated inhibition of cellular respiration
was followed by mitochondrial depolarization and cell
death in neurones, but hyperpolarization in astrocytes,
and an increase in the energy state at the expense of
glycolytically generated ATP, prevented apoptotic
death in astrocytes [49].
Experimental procedures
Animals
All animal experiments were carried out in accordance with
the European Union Guide for the Care and Use of Labo-
ratory Animals and were approved by the local animal care
committee. For ethical reasons, the number of experiments
was restricted (see below). 3-NP (Sigma, St Louis, MO,
USA) was dissolved in NaCl ⁄ P
i
(10 mm phosphate buffer,
pH 7.4, containing 120 mm NaCl) and injected intraperito-
neally at a dose of 50 mgÆkg
)1
into CFLP mice (twice a
day). Mice from the same strain received NaCl ⁄ P
i
vehicle
and were used as a control. Mice were sacrificed after the
seventh 3-NP injection. Transgenic mice expressing a
cDNA encoding an N-terminal fragment (171 amino acids)
of human huntingtin with 82 glutamine residues were used
in these studies [24]. Transgenic breeder pairs, purchased
from Jackson Laboratories (Bar Harbor, ME, USA), were
bred locally. Male transgenic mice from the N171-82Q line
were then bred with female B6C3F1 mice (background
strain). As controls, wild-type littermates were used. The
offsprings were genotyped with a PCR assay on tail DNA
[24]. The mice were housed under standard conditions with
free access to water and food. Mice were sacrificed at the
age of 20 weeks. The brains were rapidly removed and cut
into two hemispheric pieces. Both halves of the brains were
cut at the level of the chiasma opticum. Three portions
were separated: (a) the frontal cortex and anterior part of
the striatum; (b) the posterior part of the striatum, hippo-
campus, thalamus, parietal and occipital cortices; and (c)
the cerebellum with brainstem; referred to as anterior, pos-
terior and cerebellum, respectively. The brain pieces were
kept at )70 °C. For the dissection, mouse brain matrices
were used for slicing the exact intervals. In the case of mice
treated with 3-NP, the same separation process was applied
to compare the two mouse models of the disease.
Antibody, cytochrome c
2+
and c
3+
solutions
The huntingtin antibody directed against the first 17 amino
acids of the N-terminal part of the huntigtin was kindly
provided by L. Jones (University of Wales, College of Med-
icine, Cardiff, UK). It recognizes both mutant and normal
huntingtin. Cytochrome c
3+
was dissolved in phosphate
buffer (10 mm potassium phosphate, pH 7.0). The solution
(approximately 1 mgÆmL
)1
) was reduced with a few mgs of
potassium ascorbate. Excess ascorbate was removed by
dialysis against the above phosphate buffer for 18–24 h at
4 °C. The reduced cytochrome c
2+
was stored at )20 °C.
Preparation of extracts
Cytosolic extract
Cell free extracts were prepared from brain tissues by
homogenization at 4 °C using a Potter-homogenizer in buf-
fer A [50 mm Tris, pH 7.4, containing 120 mm NaCl,
10 lm 4-(2-aminoethyl) benzenesulfonyl fluoride hydrochlo-
ride, 1 lgÆmL
)1
of pepstatin, 1 l g ÆmL
)1
of leupeptin] at a
1 : 1.5 ratio (w ⁄ w) of tissue and buffer, then centrifuged at
15 000 g for 20 min at 4 °C. The supernatant was used as
cytosolic fraction for glycolytic enzyme assays. The activity
J. Ola
´
h et al. Energy metabolism in HD transgenic mice
FEBS Journal 275 (2008) 4740–4755 ª 2008 The Authors Journal compilation ª 2008 FEBS 4751
of the cytosolic marker LDH was determined in the super-
natant.
Crude mitochondrial extract
Brain tissues were homogenized in buffer B [20 mm potas-
sium phosphate, pH 7.6, containing 150 mm KCl, 1 mm
EDTA, 10 lm 4-(2-aminoethyl) benzenesulfonyl fluoride
hydrochloride, 1 lgÆmL
)1
of pepstatin, 1 lgÆmL
)1
of leu-
peptin] at a 1 : 4 ratio of tissue and buffer, and centrifuged
at 1000 g for 5 min at 4 °C. The supernatant was further
centrifuged at 14 000 g for 25 min at 4 °C. The pellet of
the second centrifugation was enriched in mitochondria
used for assays of the activity of mitochondrial complexes.
The ‘intactness’ of the mitochondria was tested by measur-
ing the activity of GLUDH as mitochondrial marker.
Protein determination
Routine measurements of protein concentration were
performed using the Bradford method [50].
Enzyme kinetic measurements
Cytosolic enzyme assays
Measurements of enzyme activities were based on the pro-
duction of NADPH ⁄ NADH, or consumption of NADH,
using auxiliary enzyme systems, if necessary. The experi-
ments were carried out in buffer C (100 mm Tris, pH 8.0,
containing 10 mm phosphate and 10 mm MgCl
2
)at25°C
using a Cary 100 spectrophotometer (Varian Inc., Palo
Alto, CA, USA) at 340 nm. Glycolytic enzyme activities
were determined as previously described [51]. The GAPDH
assay was carried out in standard buffer containing 5 mm
arsenate, 4 mm NAD
+
and 2 mm GAP as substrate. CK
activity assay was performed at 340 nm in buffer D
(100 mm Tris, pH 7.0, containing 10 mm phosphate and
10 mm MgCl
2
). The reaction mixture contained 1 mm crea-
tine phosphate, 1 mm NADP
+
,1mm glucose, plus glucose-
6-phosphate dehydrogenase and HK as auxiliary enzymes.
The reaction was initiated by adding 2 mm MgADP.
Mitochondrial respiratory chain complex activity
assays
The experiments were carried out in buffer E (50 mm potas-
sium phosphate, pH 7.5) at 37 °C by a Cary 100 spectro-
photometer as described previously [52] with some
modifications (Doc. S1).
Flux measurements
The conversion of glucose via the glycolytic pathway was
measured in cytosolic extract (see above) at 25 °C in buf-
fer C containing 4 mm NAD
+
,2mm glucose and 2 mm
MgATP. The extract was preincubated with NAD
+
and
MgATP for 5 min, and then the reaction was started by
adding glucose to the reaction mixture. The reaction was
followed spectrophotometrically at 340 nm by monitoring
NADH production, and by determining the concentrations
of the triosephosphates, pyruvate and lactate. The reaction
was stopped at various times by addition of ice cold
HClO
4
. After neutralization of the samples, the concentra-
tions of the metabolites were determined by enzymatic
assays (for details see Doc. S2).
Determination of ATP and creatine levels
HClO
4
was added to the cell free extract of brain prepared
from different brain areas of transgenic mice or mice trea-
ted with 3-NP. After neutralization, the ATP level was
determined in buffer C in the presence of 1 mm glucose,
1mm NADP
+
, HK and glucose 6-phosphate-dehydroge-
nase as auxiliary enzymes. The creatine level was measured
in 200 mm glycine buffer at pH 9.6, containing 2 mm
MgATP, 0.25 mm NADH and 2 mm phosphoenolpyruvate,
with CK, PK and LDH as auxiliary enzymes.
Simulation tools
All the numerical simulations were performed with the
mathematica for students software package, version 4.2
(Wolfram Research; ). The well-
established rate equations of the glycolytic enzymes used
for computation of the glycolytic pathway are presented in
the Supporting information (Doc. S4). These have been
submitted to the model bases JWS ⁄ Silicon cell (http://
www.jjj.bio.vu.nl) and BioModels. For the simulation of
the extract experiments (Fig. 2), the experimentally
observed V
max
were used. For the simulation of the glyco-
lytic pathway at near-physiological circumstances (Fig. 3),
protein concentrations 100-fold higher than used in the test
tube experiments were introduced into the model and con-
stant concentrations of glucose, NAD
+
, NADH, ATP and
ADP were applied. The high (30 mgÆmL
)1
) protein concen-
tration was estimated on the grounds that the concen-
trations of the prepared cytosolic extracts were
10–15 mgÆmL
)1
after an at least two- to three-fold dilution.
Immunohistochemistry
4% Paraformaldehyde fixed, paraffin-embedded material
from the half-brain (see above) of five of each transgenic
and control mice were used for neuropathological evalua-
tion. The other half of the brain was deep frozen. In addi-
tion to hematoxylin and eosin and luxol-cresyl violet
routine stainings, for immunohistochemistry, anti-ubiquitin
(1 : 200, rabbit-polyclonal; Dako, Glostrup, Denmark),
Energy metabolism in HD transgenic mice J. Ola
´
h et al.
4752 FEBS Journal 275 (2008) 4740–4755 ª 2008 The Authors Journal compilation ª 2008 FEBS
anti-huntingtin (1 : 100, rabbit-polyclonal; courtesy of
Lesley Jones, University of Wales College of Medicine,
Cardiff, UK) and anti-GFAP (rabbit-polyclonal; Dako,
Glostrup, Denmark) sera were applied. As a secondary
system, we used the Envision detection kit (Dako).
Acknowledgements
We are grateful to Lesley Jones (University of Wales
College of Medicine, Cardiff, UK) for providing the
anti-huntingtin serum. This work was supported by
Hungarian National Scientific Research Fund Grants
OTKA T-046071 and T-067963 to J. Ova
´
di, T-049247
to F.O., and PD 76793 to J. Ova
´
di; FP6-2003-LIFE-
SCIHEALTH-I: BioSim and NKFP-MediChem2 1 ⁄ A ⁄
005 ⁄ 2004 to J. Ola
´
h; and by RET-NORT 08 ⁄ 2004 and
ETT 215 ⁄ 2006 to P.K. and L.V.; as well as by various
grants from EPSRC, BBSRC, NGI, NWO and the
FP7 program to H.V.W.
References
1 Purdon SE, Mohr E, Ilivitsky V & Jones BD (1994)
Huntington’s disease: pathogenesis, diagnosis and treat-
ment. J Psychiatry Neurosci 19, 359–367.
2 Walker FO (2007) Huntington’s disease. Lancet 369,
218–228.
3 DiFiglia M, Sapp E, Chase KO, Davies SW, Bates GP,
Vonsattel JP & Aronin N (1997) Aggregation of hun-
tingtin in neuronal intranuclear inclusions and dystro-
phic neurites in brain. Science 277, 1990–1993.
4 The Huntington’s Disease Collaborative Research
Group (1993) A novel gene containing a trinucleotide
repeat that is expanded and unstable on Huntington’s
disease chromosomes. Cell 72, 971–983.
5 Perez-De La Cruz V & Santamaria A (2006) Integrative
hypothesis for Huntington’s disease: a brief review on
experimental evidence. Physiol Res 56, 513–526.
6 Landles C & Bates GP (2004) Huntingtin and the molec-
ular pathogenesis of Huntington’s disease. Fourth in
molecular medicine review series. EMBO Rep 5, 958–963.
7 Beal MF (2000) Energetics in the pathogenesis of neu-
rodegenerative diseases. Trends Neurosci 23, 298–304.
8 Browne SE, Bowling AC, MacGarvey U, Baik MJ, Ber-
ger SC, Muqit MM, Bird ED & Beal MF (1997) Oxida-
tive damage and metabolic dysfunction in Huntington’s
disease: selective vulnerability of the basal ganglia. Ann
Neurol 41, 646–653.
9 Gu M, Gash MT, Mann VM, Javoy-Agid F, Cooper
JM & Schapira AH (1996) Mitochondrial defect in
Huntington’s disease caudate nucleus. Ann Neurol 39,
385–389.
10 Jenkins BG, Koroshetz WJ, Beal MF & Rosen BR
(1993) Evidence for impairment of energy metabolism
in vivo in Huntington’s disease using localized 1H
NMR spectroscopy. Neurology 43, 2689–2695.
11 Sanchez-Pernaute R, Garcia-Segura JM, del Barrio
Alba A, Viano J & de Yebenes JG (1999) Clinical cor-
relation of striatal 1H MRS changes in Huntington’s
disease. Neurology 53, 806–812.
12 Hoang TQ, Bluml S, Dubowitz DJ, Moats R, Kopyov
O, Jacques D & Ross BD (1998) Quantitative proton-
decoupled 31P MRS and 1H MRS in the evaluation of
Huntington’s and Parkinson’s diseases. Neurology 50,
1033–1040.
13 Ma Y & Eidelberg D (2007) Functional imaging of
cerebral blood flow and glucose metabolism in Parkin-
son’s disease and Huntington’s disease. Mol Imaging
Biol 9, 223–233.
14 Burke JR, Enghild JJ, Martin ME, Jou Y-S, Myers
RM, Roses AD, Vance JM & Strittmatter WJ (1996)
Huntingtin and DRPLA proteins selectively interact
with the enzyme GAPDH. Nat Med 2, 347–350.
15 Kish SJ, Lopes-Cendes I, Guttman M, Furukawa Y,
Pandolfo M, Rouleau GA, Ross BM, Nance M, Schut
L, Ang L et al. (1998) Brain glyceraldehyde-3-phos-
phate dehydrogenase activity in human trinucleotide
repeat disorders. Arch Neurol 55, 1299–1304.
16 Cooper AJ, Sheu KF, Burke JR, Strittmatter WJ &
Blass JP (1998) Glyceraldehyde-3-phosphate dehydro-
genase abnormality in metabolically stressed Hunting-
ton disease fibroblasts. Dev Neurosci 20, 462–468.
17 Mazzola JL & Sirover MA (2001) Reduction of glycer-
aldehyde-3-phosphate dehydrogenase activity in Alzhei-
mer’s disease and in Huntington’s disease fibroblasts.
J Neurochem 76, 442–449.
18 Senatorov VV, Charles V, Reddy PH, Tagle DA &
Chuang DM (2003) Overexpression and nuclear accu-
mulation of glyceraldehyde-3-phosphate dehydrogenase
in a transgenic mouse model of Huntington’s disease.
Mol Cell Neurosci 22, 285–297.
19 Bae BI, Hara MR, Cascio MB, Wellington CL, Hayden
MR, Ross CA, Ha HC, Li XJ, Snyder SH & Sawa A
(2006) Mutant huntingtin: nuclear translocation and
cytotoxicity mediated by GAPDH. Proc Natl Acad Sci
USA 103, 3405–3409.
20 Menalled LB & Chesselet MF (2002) Mouse models
of Huntington’s disease. Trends Pharmacol Sci 23,
32–39.
21 Klivenyi P, Starkov AA, Calingasan NY, Gardian G,
Browne SE, Yang L, Bubber P, Gibson GE, Patel MS
& Beal MF (2004) Mice deficient in dihydrolipoamide
dehydrogenase show increased vulnerability to MPTP,
malonate and 3-nitropropionic acid neurotoxicity.
J Neurochem 88, 1352–1360.
22 Brouillet E, Conde F, Beal MF & Hantraye P (1999)
Replicating Huntington’s disease phenotype in experi-
mental animals. Prog Neurobiol 59, 427–468.
J. Ola
´
h et al. Energy metabolism in HD transgenic mice
FEBS Journal 275 (2008) 4740–4755 ª 2008 The Authors Journal compilation ª 2008 FEBS 4753
23 Mangiarini L, Sathasivam K, Seller M, Cozens B, Har-
per A, Hetherington C, Lawton M, Trottier Y, Lehrach
H, Davies SW et al. (1996) Exon 1 of the HD gene with
an expanded CAG repeat is sufficient to cause a pro-
gressive neurological phenotypes in transgenic mice.
Cell 87, 493–506.
24 Schilling G, Becher MW, Sharp AH, Jinnah HA, Duan
K, Kotzuk JA, Slunt HH, Ratovitski T, Cooper JK,
Jenkins NA et al. (1999) Intranuclear inclusions and
neuritic aggregates in transgenic mice expressing a
mutant N-terminal fragment of huntingtin. Hum Mol
Genet 8, 397–407.
25 Klivenyi P, Bende Z, Hartai Z, Penke Z, Nemeth H,
Toldi J & Vecsei L (2006) Behaviour changes in a trans-
genic model of Huntington’s disease. Behav Brain Res
169, 137–141.
26 Hedreen JC & Folstein SE (1995) Early loss of neostria-
tal striosome neurons in Huntington’s disease. J Neuro-
pathol Exp Neurol 54, 105–120.
27 Teusink B, Passarge J, Reijenga CA, Esgalhado E, van
der Weijden CC, Schepper M, Walsh MC, Bakker BM,
van Dam K, Westerhoff HV et al. (2000) Can yeast
glycolysis be understood in terms of in vitro kinetics of
the constituent enzymes? Testing biochemistry. Eur
J Biochem 267, 5313–5329.
28 Snoep JL, Bruggeman F, Olivier BG & Westerhoff HV
(2006) Towards building the silicon cell: a modular
approach. Biosystems 83, 207–216.
29 Westerhoff HV, Kolodkin A, Conradie R, Wilkinson
SJ, Bruggeman FJ, Krab K, van Schuppen JH, Hardin
H, Bakker BM, Mone
´
MJ et al. (2008) Systems biology
towards life in silico: mathematics of the control of
living cells. J Math Biol [Epub ahead of print].
30 Wu J, Takeo T, Wakui M, Ellsworth K & Fisher RS
(2003) Intracellular energy failure does not underlie
hyperthermic spreading depressions in immature rat
hippocampal slice. Brain Res 987, 240–243.
31 Aubert A & Costalat R (2002) A model of the coupling
between brain electrical activity, metabolism, and hemo-
dynamics: application to the interpretation of functional
neuroimaging. Neuroimage 17, 1162–1181.
32 Gusella JF & MacDonald ME (2000) Molecular genet-
ics: unmasking polyglutamine triggers in neurodegenera-
tive disease. Nat Rev Neurosci 1, 109–115.
33 Arrasate M, Mitra S, Schweitzer ES, Segal MR &
Finkbeiner S (2004) Inclusion body formation reduces
levels of mutant huntingtin and the risk of neuronal
death. Nature 431, 805–810.
34 Marcinek DJ (2004) Mitochondrial dysfunction
measured in vivo. Acta Physiol Scand 182, 343–352.
35 Seong IS, Ivanova E, Lee JM, Choo YS, Fossale E,
Anderson M, Gusella JF, Laramie JM, Myers RH,
Lesort M et al. (2005) HD CAG repeat implicates a
dominant property of huntingtin in mitochondrial
energy metabolism. Hum Mol Genet 14, 2871–2880.
36 Kasparova
´
S, Sumbalova
´
Z, Bystricky´ P, Kucharska
´
J,
Liptaj T, Mlyna
´
rik V & Gvozdja
´
kova
´
A (2006) Effect
of coenzyme Q10 and vitamin E on brain energy meta-
bolism in the animal model of Huntington’s disease.
Neurochem Int 48, 93–99.
37 Andreassen OA, Dedeoglu A, Ferrante RJ, Jenkins BG,
Ferrante KL, Thomas M, Friedlich A, Browne SE,
Schilling G, Borchelt DR et al. (2001) Creatine increase
survival and delays motor symptoms in a transgenic
animal model of Huntington’s disease. Neurobiol Dis 8,
479–491.
38 Matthews RT, Yang L, Jenkins BG, Ferrante RJ,
Rosen BR, Kaddurah-Daouk R & Beal MF (1998)
Neuroprotective effects of creatine and cyclocreatine in
animal models of Huntington’s disease. J Neurosci 18,
156–163.
39 van der Burg JM, Bacos K, Wood NI, Lindqvist A,
Wierup N, Woodman B, Wamsteeker JI, Smith R,
Deierborg T, Kuhar MJ et al. (2008) Increased meta-
bolism in the R6 ⁄ 2 mouse model of Huntington’s
disease. Neurobiol Dis 29, 41–51.
40 Ova
´
di J (1995) Cell Architecture and Metabolic Channel-
ing. Springer-Verlag, New York, NY.
41 Jenkins BG, Andreassen OA, Dedeoglu A, Leavitt B,
Hayden M, Borchelt D, Ross CA, Ferrante RJ & Beal
MF (2005) Effects of CAG repeat length, HTT protein
length and protein context on cerebral metabolism
measured using magnetic resonance spectroscopy in
transgenic mouse models of Huntington’s disease.
J Neurochem 95, 553–562.
42 Jenkins BG, Klivenyi P, Kustermann E, Andreassen
OA, Ferrante RJ, Rosen BR & Beal MF (2000) Nonlin-
ear decrease over time in N-acetyl aspartate levels in
the absence of neuronal loss and increases in glutamine
and glucose in transgenic Huntington’s disease mice.
J Neurochem 74, 2108–2119.
43 Guidetti P, Charles V, Chen EY, Reddy PH, Kordower
JH, Whetsell WOJ, Schwarcz R & Tagle DA (2001)
Early degenerative changes in transgenic mice express-
ing mutant huntingtin involve dendritic abnormalities
but no impairment of mitochondrial energy production.
Exp Neurol 169, 340–350.
44 Saulle E, Gubellini P, Picconi B, Centonze D, Tropepi
D, Pisani A, Morari M, Marti M, Rossi L, Papa M
et al. (2004) Neuronal vulnerability following inhibition
of mitochondrial complex II: a possible ionic mecha-
nism for Huntington’s disease. Mol Cell Neurosci 25,
9–20.
45 Ova
´
di J & Orosz F (2007) Energy metabolism in con-
formational diseases. In Biosimulation in Drug Develop-
ment (Bertau M, Mosekilde E & Westerhoff H, eds),
pp. 233–257. Wiley, Weinheim.
46 Chih CP, Lipton P & Roberts ELJ (2001) Do active
cerebral neurons really use lactate rather than glucose?
Trends Neurosci 24, 573–578.
Energy metabolism in HD transgenic mice J. Ola
´
h et al.
4754 FEBS Journal 275 (2008) 4740–4755 ª 2008 The Authors Journal compilation ª 2008 FEBS
47 Pellerin L & Magistretti PJ (1994) Glutamate uptake
into astrocytes stimulates aerobic glycolysis: a mecha-
nism coupling neuronal activity to glucose utilization.
Proc Natl Acad Sci USA 91, 10625–10629.
48 Tai YF, Pavese N, Gerhard A, Tabrizi SJ, Barker RA,
Brooks DJ & Piccini P (2007) Imaging microglial activa-
tion in Huntington’s disease. Brain Res Bull 72, 148–151.
49 Almeida A, Almeida J, Bolanos JP & Moncada S
(2001) Different responses of astrocytes and neurons to
nitric oxide: the role of glycolytically generated ATP in
astrocyte protection. Proc Natl Acad Sci USA 98,
15294–15299.
50 Bradford MM (1976) A rapid and sensitive method for
the quantitation of microgram quantities of protein
utilizing the principle of protein-dye binding. Anal
Biochem 72, 248–254.
51 Beutler E, Blume KG, Kaplan JC, Lo
¨
hr GW, Ramot B
& Valentine WN (1977) International Committee for
Standardization in Haematology: recommended
methods for red-cell enzyme analysis. Br J Haematol
35, 331–340.
52 Barrientos A, Kenyon L & Moraes CT (1998) Human
xenomitochondrial cybrids. Cellular models of
mitochondrial complex I deficiency. J Biol Chem 273,
14210–14217.
Supporting information
The following supplementary material is available:
Doc. S1. Assays of the activities of the mitochondrial
respiratory chain complexes.
Doc. S2. Determination of metabolite concentrations
to follow fluxes.
Doc. S3. Western blot.
Doc. S4. Rate equations and kinetic parameters used
for the simulation.
This supplementary material can be found in the
online version of this article.
Please note: Wiley-Blackwell are not responsible for
the content or functionality of any supplementary
material supplied by the authors. Any queries (other
than missing material) should be directed to the
corresponding author for the article.
J. Ola
´
h et al. Energy metabolism in HD transgenic mice
FEBS Journal 275 (2008) 4740–4755 ª 2008 The Authors Journal compilation ª 2008 FEBS 4755