Báo cáo khoa học: The calcium-binding domain of the stress protein SEP53 is required for survival in response to deoxycholic acid-mediated injury pdf
Bạn đang xem bản rút gọn của tài liệu. Xem và tải ngay bản đầy đủ của tài liệu tại đây (1.68 MB, 18 trang )
The calcium-binding domain of the stress protein SEP53
is required for survival in response to deoxycholic
acid-mediated injury
Joanne Darragh
1,
*, Mairi Hunter
1
, Elizabeth Pohler
2
, Lenny Nelson
2
, John F. Dillon
1
,
Rudolf Nenutil
3
, Borek Vojtesek
3
, Peter E. Ross
1
, Neil Kernohan
1
and Ted R. Hupp
2
1 Division of Pathology and Neurosciences, University of Dundee, UK
2 University of Edinburgh Cancer Centre, CRUK Cell Signalling Unit, UK
3 Masaryk Memorial Cancer Institute, BRNO Czech Republic
Human cancers develop through a multistage process
involving morphological changes in tissue, mutations
in oncogenes and tumour suppressor genes, and epi-
genetic programmes that give rise to enhanced survival
in a stressed microenvironment [1]. The development
of human cancer is proving to be a tissue-specific pro-
cess involving an interaction between mutated cells
and the unique conditions within a particular local
matrix and microenvironment. Such local cellular
stresses include hypoxia, acidification, pro-oxidants
from the diet, genome instability and altered autocrine
responses. This evolutionary path relies on the devel-
oping tumour cell to repair, survive and overcome
intrinsic tumour-suppressing signals that normally are
used to kill abnormal cells and maintain tissue integ-
rity. The mechanisms underlying tissue-specific
responses to local environment in cancer development
are largely undefined.
Keywords
Barrett’s apoptosis; calcium; deoxycholic
acid; SEP53; stress response
Correspondence
T. R. Hupp, University of Edinburgh Cancer
Centre, CRUK Cell Signalling Unit, South
Crewe Road, Edinburgh EH4 2XR, UK
E-mail:
*Present address
MRC Protein Phosphorylation Unit,
University of Dundee, UK
(Received 12 December 2005, revised 2
February 2006, accepted 28 February 2006)
doi:10.1111/j.1742-4658.2006.05206.x
Stress protein responses have evolved in part as a mechanism to protect
cells from the toxic effects of environmental damaging agents. Oesophageal
squamous epithelial cells have evolved an atypical stress response that
results in the synthesis of a 53 kDa protein of undefined function named
squamous epithelial-induced stress protein of 53 kDa (SEP53). Given the
role of deoxycholic acid (DCA) as a potential damaging agent in squamous
epithelium, we developed assays measuring the effects of DCA on SEP53-
mediated responses to damage. To achieve this, we cloned the human
SEP53 gene, developed a panel of monoclonal antibodies to the protein,
and showed that SEP53 expression is predominantly confined to squamous
epithelium. Clonogenic assays were used to show that SEP53 can function
as a survival factor in mammalian cell lines, can attenuate DCA-induced
apoptotic cell death, and can attenuate DCA-mediated increases in intracel-
lular free calcium. Deletion of the highly conserved EF-hand calcium-bind-
ing domain in SEP53 neutralizes the colony survival activity of the protein,
neutralizes the protective effects of SEP53 after DCA exposure, and per-
mits calcium elevation in response to DCA challenge. These data indicate
that the squamous cell-stress protein SEP53 can function as a modifier of
the DCA-mediated calcium influx and identify a novel survival pathway
whose study may shed light on mechanisms relating to squamous cell
injury and associated cancer development.
Abbreviations
Bis-I, bisindolylmaleimide I; Bis-V, bisindolylmaleimide V; CA, cholic acid; CDCA, chenodeoxycholic acid; DCA, deoxycholic acid; HRP, horse
radish peroxidase; LCA, lithocholic; PKC, protein kinase C; PPI, proton pump inhibitor; SEP53, squamous epithelial-induced stress protein of
53 kDa; UDCA, ursodeoxycholic acid; YFP, yellow fluorescent protein.
1930 FEBS Journal 273 (2006) 1930–1947 ª 2006 The Authors Journal compilation ª 2006 FEBS
In developing physiologically relevant models of
stress protein dysregulation in developing human can-
cers, a key clinical model that is giving novel molecular
mechanistic insight is adenocarcinoma of the oesopha-
gus [2]. This cancer is one of the fastest rising cancers
in the west, is taking the place of squamous cell carci-
noma as a more common type of oesophageal cancer,
and is associated in part with stresses induced by
environmental damaging agents including acid and
bile reflux [3–5]. Furthermore, the transition from
squamous epithelium to adenocarcinoma appears to
proceed through the well-characterized epithelial inter-
mediate (named Barrett’s) and is associated with
increases in proliferation due to an acidified microenvi-
ronment [5]. In addition to acid as a key microenviron-
mental stress implicated in disease progression, bile is
present within the lumen of the gut and is a naturally
occurring agent that may act in different ways to facili-
tate carcinogenesis [6,7]. In particular bile acids such
as deoxycholic acid (DCA) can stimulate cell prolifer-
ation, migration, DNA damage and apoptosis in gut
epithelial cells [8–15].
Cells of the normal human oesophageal squamous
epithelium are under relatively unique environmental
pressures being exposed to thermal stresses, pro-oxi-
dants, and refluxed acid and bile adducts. These cells
have therefore presumably evolved specific mechanisms
to tolerate and repair injury induced by exposure to
these and other damaging agents that are relatively
unique to this tissue. We have defined previously the
stress-responsive pathways in normal squamous oeso-
phageal epithelial cells using a ‘functional proteomics’
approach. The first studies indicated that ex vivo
stressed squamous cells in organ culture did not syn-
thesize the classic stressed-induced protein HSP70 after
stress, suggesting a novel type of stress response in this
cell type [16]. Further ex vivo organ culture in conjunc-
tion with specific stresses, including ethanol and heat
shock, identified using mass-spectrometric methods a
novel class of stress protein in normal squamous
epithelium; these include SEP70, squamous epithelial-
induced stress protein of 53 kDa (SEP53) and gluta-
mine–glutamyl transferase [17]. SEP70 is induced by
acidified extracellular conditions and is a glucose-regu-
lated protein [17]. SEP53 was originally cloned as
a gene expressed in normal oesophagus but downregu-
lated in oesophageal cancers and was named Clone 1
open reading frame 10 [18]. The SEP53 gene is located
on chromosome 1q21 within a group of proteins
named the epidermal differentiation complex fused-
gene family that it silenced as part of a general mech-
anism that apparently suppresses genes from this locus
in cancer cells [19,20]. The function and regulation of
SEP53 are not yet clear. In this study, we present data
indicating that SEP53 can function as a survival factor
and that it does so in part by attenuating DCA-medi-
ated calcium release and cell death. SEP53 is a rapidly
evolving gene with < 50% identity to its murine ortho-
logue suggesting that the antiapoptotic activity of
SEP53 is evolving in relation to selection pressures
resulting from environmental stress in squamous epi-
thelium.
Results
SEP53 protein is expressed in human squamous
epithelium
Having previously shown, using a functional proteo-
mics approach, that SEP53 is one of the major pro-
teins induced by ex vivo stress to normal squamous
epithelium [17], we needed to confirm that the SEP53
protein is in fact expressed in normal human squa-
mous epithelium of the oesophagus. We first needed to
develop antibodies to SEP53 and the human SEP53
gene was cloned into a bacterial and insect cell-expres-
sion system for the purification and acquisition of
full-length protein for immunization, and to develop a
panel of monoclonal antibodies (MAb). A tryptic
digest of pure full-length SEP53 protein (Fig. 1A, lane
1) gave rise to a ladder of bands (as in Fig. 1A, lane 2)
that was used to define the number of unique MAb
clones. Three distinct classes of MAbs were grouped
according to binding activity to different tryptic frag-
ments (Fig. 1A, lanes 2, 4, 6, 8, and 10). Class A MAb
produced a unique pattern of immunoreactive bands
(Fig. 1A, lane 2) that was distinct from Class B MAb
(Fig. 1A, lane 4), whilst the Class C MAb epitope was
destroyed by the trypsinization as effectively no ladder
of bands was produced (Fig. 1A, lane 6, 8 and 10).
We next investigated whether SEP53 protein was
expressed in squamous epithelium using these immuno-
chemical reagents. The SEP53 protein is highly
expressed in normal squamous epithelium under condi-
tions in which Anterior Gradient-2 is relatively low
(Fig. 1B, Normal). As a control for the integrity of the
Barrett’s cell population, the Anterior Gradient-2 pro-
tein is confirmed to be highly overexpressed in Barr-
ett’s samples [21] compared with normal squamous
epithelium from the same patient (Fig. 1D, Barrett’s
versus Normal). SEP53 immunostaining can also be
observed in the suprabasal layer of squamous epithe-
lium (Fig. 1F), where immunoreactivity is generally
cytoplasmic granular staining with minor epimembra-
nous staining in maturing and mature squamous cells.
Furthermore, SEP53 is variably expressed in Barrett’s
J. Darragh et al. SEP53 attenuates deoxycholate-mediated injury
FEBS Journal 273 (2006) 1930–1947 ª 2006 The Authors Journal compilation ª 2006 FEBS 1931
where Anterior Gradient-2 protein is relatively high
(Fig. 1B, Barrett’s). However, this expression of SEP53
enriched in biopsies endoscopically defined as Barrett’s
epithelium might be due to a contamination of normal
squamous epithelium in the biopsy. The variable
expression of the acid- and glucose-regulated SEP70
protein [17] (Fig. 1C, Barrett’s), under conditions
where SEP53 protein is variable (Fig. 1B, Barrett’s),
highlights heterogeneity in the Barrett’s samples with
respect to all three stress proteins. Nevertheless, the
SEP53 protein is in fact expressed in normal human
squamous epithelium and this prompted us to continue
studying the gene to define a possible molecular func-
tion for the protein in stress-responsive pathways.
Developing cell models to examine effects of
DCA on cell death
SEP53 was originally identified as a protein synthes-
ized ex vivo after heat or ethanol stress [17]. The
physiological stress the SEP53 responds to in cells is,
however, undefined, as heat exposure to the oesopha-
gus and ethanol are unlikely to be evolutionary adap-
tations. The oesophagus is an organ that is commonly
exposed to bile acids and the structure of normal oeso-
phageal epithelium is altered by bile exposure [22].
Developing knowledge of the effects that these chemi-
cals may have on oesophageal epithelial cells and
apoptotic pathways might be relevant to understanding
the molecular function of SEP53. We were therefore
interested in determining whether the SEP53 gene had
any effects on modifying DCA-induced cell stresses.
However, prior to examining the effects of DCA on
SEP53-mediated apoptotic responses, we wanted to
confirm that DCA was in fact a significant constituent
of gastric fluid.
To analyse gastric fluid samples for bile acid con-
tent, bile acids were extracted, derivatized and then
analysed by gas chromatography. The relative retent-
ion times of peaks present in the gastric fluid sample
A
Classes of SEP53 MAB
B
C
D
E
F
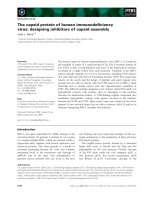
Fig. 1. Development of a panel of monoclonal antibodies (MAbs) to the major squamous-cell specific stress protein SEP53. (A) Characteriz-
ation of SEP53 MAb. Purified SEP53 protein (1 lg) was incubated without (lanes 1, 3, 5, 7 and 9) or with (10 ng, lanes 2, 4, 6, 8 and 10)
trypsin in a buffer containing 25 m
M Hepes (pH 7.5) and at 30 °C for 5 min. Reactions were quenched with SDS sample buffer and protein
was separated on a 12% SDS polyacrylamide gel. Protein was immunoblotted and probed with different antibodies (1 lgÆmL
)1
) giving rise
to the three classes, as indicated. The arrows highlight the unique proteolytic fragments produced that are recognized by the respective
antibodies. (B–E) Expression of SEP53 in normal squamous epithelium. Lysates were obtained from normal and Barrett’s tissue (defined
endoscopically and histochemically) from the same patient (as indicated by the numbering between the panels) and protein was immunoblot-
ted for (B) SEP53 protein, (C) SEP70 protein, (D) AG-2 protein and (E) loading controls for squamous and Barrett’s biopsies (ink stain immu-
noblot to normalize for protein loading), as indicated. (F) Immunostaining in normal squamous oesophageal epithelium shows SEP53
expression predominantly in the suprabasal layer of the epithelium in cytoplasmic or perinuclear regions.
SEP53 attenuates deoxycholate-mediated injury J. Darragh et al.
1932 FEBS Journal 273 (2006) 1930–1947 ª 2006 The Authors Journal compilation ª 2006 FEBS
were calculated (Fig. 2A) and the relevant bile acid
peaks identified by comparison with values from the
standard mix of pure lipids (data not shown). Bile
acids were detected in 92% (158 ⁄ 172) of patient sam-
ples and the concentration and ⁄ or composition of the
bile acid pool varied considerably between patient
samples (Fig. 2B). In samples with detectable levels,
the concentration of total bile acids ranged from 1 lm
to 6.4 mm, with a mean of 323 lm (Fig. 2B). In total,
31% of samples contained no or low concentrations of
bile acids, with 32% having high concentrations in
excess of 200 lm, and the remaining 37% of cases
having concentrations ranging between 20 and 200 lm
(Fig. 2C,D). The majority of patient samples contained
a mixture of bile acids (as well as cholesterol, Fig. 2E),
including DCA, chenodeoxycholic acid (CDCA),
ursodeoxycholic acid (UDCA), lithocholic acid (LCA)
and cholic acid (CA), with both conjugated and
unconjugated (Fig. 2B,E) forms being identified. The
primary bile acids, CA and CDCA, with mean concen-
trations of 118 and 112 lm, respectively, were present
in a higher concentrations than the secondary bile
acids, with the mean concentration of DCA being
63 lm and LA levels averaging 17 lm (Fig. 2B). The
proportion of DCA to CA in gastric juice was higher
than anticipated (Fig. 2E), as in normal duodenal
fluid the DCA levels have been found to be one fifth
of cholate [23].
DCA was present in gastric samples and the range
of DCA was from 1 lm to over 1.5 mm (Fig. 2B). The
physiological levels of DCA that are associated with
injury are not known, as patients fast before entering
the clinic for sample collection. Furthermore, it is not
known whether chronic exposure to low levels that are
not acutely toxic induces a worse or better indicator
than single supratoxic acute doses over time. Despite
this heterogeneity in bile levels in gastric fluid, it is dif-
ficult to extrapolate to in vivo concentrations, however,
8%
23%
37%
32%
<1 uM
1-20 uM
20-200 uM
> 200 uM
36%
53%
9%
2%
2%
Cholesterol
40%
Lithocholic
3%
Deoxy cholic
12%
Chenodeoxy cholic
21%
Ursodeoxy cholic
Cholic
22%
A
Bile Acid Rt (Min) RRt Std ratio
Cholesterol 4.31 0.40 1.69
Lithocholic 5.55 0.52 1.65
Deoxycholic 6.35 0.59 1.11
Chenodeoxycholic 7.19 0.67 1.15
Ursodeoxycholic 7.84 0.73 1.63
Cholic 8.89 0.83 1.16
7-Ketolithocholate 10.74 1.00 1.00
B
CD
E
Bile Acid Range u
M
(cong) Mean u
M
(cong) Range u
M
(uncong) Mean u
M
(uncong)
CA 1–2447 118 1–211 5
CDCA 1–3655 112 1–121 3
DCA 1–1592 63 1–115 3
LCA 1–515 17 1–82 2
UDCA 1–860 13 1–720 5
Total 1–6386 323 1–978 18
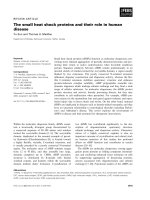
Fig. 2. Concentration of naturally occurring
bile acids. (A) Data from a representative
chromatogram indicating the retention times
of each bile acid. Peaks: 1, cholesterol; 2,
LCA; 3, DCA; 4, CDCA; 5, UDCA; 6, CA; 7,
7-ketolithocholic acid (internal standard). The
retention (R
t
) times and relative retention
times (RR
t
) of the bile acid standards are
shown and were used as a standard to
quantify the bile acids from patients. Stand-
ard ratios represent the peak area of each
1mgÆmL
)1
standard compared with the
peak area of the internal standard. (B) Sum-
mary of the range of the total bile acid con-
centrations found in gastric fluid samples.
(C) Percentage of patients with bile acid
concentrations as indicated. (D) Percentage
of patients with unconjugated bile acids con-
centrations as indicated. (E) Ratio of bile
acids to the levels of cholesterol present in
gastric fluid samples. The range, mean and
median concentrations of cholesterol are as
indicated. Cholesterol made up 40% of all
the components measured in gastric fluid,
while the various bile acids contributed
60%, giving a bile acid to cholesterol ratio
of 3 : 2.
J. Darragh et al. SEP53 attenuates deoxycholate-mediated injury
FEBS Journal 273 (2006) 1930–1947 ª 2006 The Authors Journal compilation ª 2006 FEBS 1933
using rabbit oesophageal mucosa as a model, the epi-
thelium concentrates bile acids up to 7· lumenal con-
centrations [24]. Thus, given the range of DCA in
patients (1 lm to > 1 mm) and given that bile can be
concentrated from the lumen up to 7· [24], the poss-
ible concentration of DCA in cells might be from 7 lm
to 10 mm. Furthermore, Zhang et al. [25] evaluated
the range of bile acids (as in Fig. 2) and found that
$ 500 lm of selected bile acids were required to give
rise to significant apoptosis. These latter levels were in
the range we used (Figs 2 and 3) and given this, we
titrated DCA from low lm to > 1 mm to determine
whether it was toxic in our cell assays and whether it
was modified by SEP53.
We next evaluated the effects of these key bile acids
present in gastric fluid on the cell-cycle parameters a
set of relatively well-characterized oesophageal cancer
cell lines (OE21, KYSE 30, OE 19 and OE33), partic-
ularly to determine whether DCA was able to signifi-
cantly induce injury. In the presence of DCA up to a
concentration of 500 lm, no significant apoptotic
response was obtained in the OE21 or KYSE 30 squa-
mous cell lines [Fig. 3A and C versus Fig. 4G (OE21
cells)], in contrast to the oesophageal cancer Eca109
AB
C
D
IJ
KL
N
M
OP
QR
F
E
GH
SEP53 attenuates deoxycholate-mediated injury J. Darragh et al.
1934 FEBS Journal 273 (2006) 1930–1947 ª 2006 The Authors Journal compilation ª 2006 FEBS
cell line in which this dose gives rise to 22% apop-
totic cells [25]. The adenocarcinoma cell lines (OE 19
and OE33 cells) did, however, demonstrate a dose-
dependent death response following exposure to DCA
(Fig. 3B,D versus control Fig. 4A,G). The production
of these sub-G1 fragments detected by FACS after
DCA exposure was confirmed to be apoptotic by char-
acteristic nuclear morphology changes (Fig. 4M,N and
Q,R). Titration of DCA up to 500 lm demonstrated a
dose-dependent increase in sub-G1 fragments which
can be observed selectively in OE33 and OE19 cells
(Fig. 3E) and is consistent with data published recently
in a different oeopshageal cancer cell line [25].
DCA-mediated apoptosis is mediated by a
PKC-dependent pathway and is p53 independent
One of the principal biological functions of the
tumour-suppressor protein p53 is as a mediator of
apoptosis in response to cellular stress and DNA dam-
age [26]. Because DCA can induce DNA damage [14],
the role of p53 in mediating DCA-dependent apoptosis
was investigated using a pair of isogenic p53
+
and
p53
–
cell lines [27], in order to determine whether we
needed to consider the p53 status in dissecting DCA-
mediated signalling. The HCT116 (p53
+
) isogenic cell
line was incubated with increasing concentrations of
DCA (0–500 lm) for 6 h and the resultant stressed
cells were then fixed, stained with PI and the mean
(± SEM) (n ¼ 3) percentage of apoptotic cells meas-
ured by flow cytometry (Fig. 3F–H). Under these con-
ditions, apoptosis was elevated, in a dose-dependent
manner, from 2 to 58% of the cell population as
defined by sub-G1 fragments. Both of the HCT116
(p53
+
and p53
–
) cell lines were equally sensitive to
DCA-induced apoptosis (data not shown) indicating
that DCA-induced apoptosis does not require signal-
ling via p53 in these colonic cell lines. Furthermore,
because the OE33 and OE19 cell lines have mutant
p53 (data not shown), p53-independent apoptosis oper-
ates under these conditions.
In order to define a positive mechanism for DCA-
mediated apoptosis in OE33 versus OE21 cells, we
evaluated a set of common protein kinase inhibitors
for an attenuation of the response in OE33 cells (data
not shown). One striking observation was made using
the protein kinase C (PKC) inhibitor bisindolylmalei-
mide I (Bis-I), which inhibited DCA-dependent apop-
tosis (Fig. 3I). The control inactive version of the
inhibitor bisindolylmaleimide V (Bis-V) was unable to
block the apoptosis (Fig. 3J), demonstrating the selec-
tivity in the response. Because the PKC pathway was
being activated to induce apoptosis in the OE33 cell
line, but not in the OE21 cell line, we reasoned that
differential activation of key components of the PKC
pathway, the pro-apoptotic GSK3 or pro-survival
PKB kinases might account for the altered DCA-medi-
ated apoptotic response [28,29]. Consistent with this,
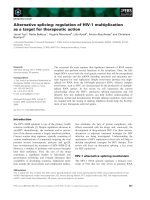
Fig. 3. Cell-cycle parameters in deoxycholic acid-treated cells. (A–D) Effects of bile on cell cycle parameters. Representative FACS profiles of
each cell line stressed with 500 l
M deoxycholic acid for 6 h are shown with untreated controls from the same experiment for OE33 in
Fig. 4A and for O21 in Fig. 4G. Histograms show the number of cells on the y-axis against the level of fluorescence (FL3-H) on the x-axis,
with the different stages of the cell cycle highlighted [sub-G1 (apoptotic), G1, S and G2–M]. The percentage figures indicate the number of
cells in the sub-G1 peak (apoptotic), which are similar for the two adenocarcinoma cell lines (OE33 and OE19). The squamous cell carcinoma
lines (OE21 and KYSE30) retained a normal DNA profile following the deoxycholic acid stress. (E) Titration of DCA. Cells were treated and
processed as in (A–D) and the sub-G1 cell number was quantified (% apoptosis) and plotted as a function of cell line and level of DCA added
(from 0 to 500 l
M). (F–H) p53 independence in apoptosis induced by DCA. In addition to analysing the effects of DCA stress on the OE
oesophageal cell (A–E), HCT116 (p53 wild-type and p53-null) colon cancer cells were used to examine p53 dependence in apoptosis.
HCT116 cells were incubated with 250 and 500 l
M DCA for 6 h. Cells were then fixed, stained with PI and sub-G1 peaks quantitated by
flow cytometry, as indicated. (I, J) Attenuation of DCA-induced apoptosis by a PKC inhibitor. OE33 cells were treated as indicated without
chemical, with DMSO control, with DCA (I), Bis-I (1 l
M) or (J) Bis-V (1 lM), and DCA with Bis-I (1 lM) or Bis-V(1 lM). The apoptotic cell
number was quantified by FASC (as indicated in Fig. 3A–D). (K–R) Analysis of GSK3-PKB modification in DCA-treated OE33 and OE21 cells.
(K–N) DCA stimulates GSK3 activation and mediates PKB attenuation in OE33 cells. Following serum starvation, OE33 cells were stressed
without or with 500 l
M DCA for 6 h followed by a treatment of 100 ngÆmL
)1
EGF for 10 min. The cells were lysed, and the lysate was then
subjected to electrophoresis on a 4–12% NuPAGE gel, transferred to nitrocellulose and 20 lg immunoblotted with either a (K) phospho-PKB
antibody or (L) the antibody specific for the native form of PKB. Blots were reprobed for actin (lower bands) to show equal loading of
protein. Cell lysates were also used to determine the levels of (M) phosphorylated GSK3a and b and (N) total cellular levels of GSK3b. (O–R)
Deoxycholic acid increases GSK3 inactivation and maintains PKB phosphorylation in OE21 cells. Following serum starvation, OE21 cells were
stressed without or with 500 l
M DCA for 6 h followed by a treatment of 100 ngÆmL
)1
EGF for 10 min. The cells were lysed, and the lysate
was then subjected to electrophoresis on a 4–12% NuPAGE gel, transferred to nitrocellulose and 20 lg immunoblotted with either a (O)
phospho-PKB antibody or (P) the antibody specific for the native form of PKB. Blots were reprobed for actin (lower bands) to show equal
loading of protein. Cell lysates were also used to determine the levels of (Q) phosphorylated GSK3a and b and (R) total cellular levels of
GSK3b.
J. Darragh et al. SEP53 attenuates deoxycholate-mediated injury
FEBS Journal 273 (2006) 1930–1947 ª 2006 The Authors Journal compilation ª 2006 FEBS 1935
M
OE33
R
Q
OE33 + DCA
OE33 cells OE33 + DCA
O
OE21 cells
P
OE21 + DCA
N
BA
C
D
FE
25%
23%
Control
Tauro-Deoxycholic Acid
Cheno-Deoxycholic Acid
Urso-Deoxycholic AcidCholic Acid
Lithocholic Acid
3%
1%
3%
6%
1%
1%
1% 1%
1%
2%
Tauro-Deoxycholic Acid
Urso-Deoxycholic Acid
K
I
GH
J
L
Control
Cheno-Deoxycholic Acid
Cholic Acid
Lithocholic Acid
Fig. 4. Cell-cycle parameters in bile acid-treated cells. (A–F) Apoptosis after bile acid exposure in OE33 cells. Under normal growth condi-
tions (A), apoptotic debris is rarely identified among OE33 cells following staining with the nuclear dye Cytox. Addition of 500 l
M of the indi-
cated bile acid (B–F) for 6 h leads to changes in cell-cycle parameters as indicated. (G–L) Reduced apoptosis after bile acid exposure in
OE21 cells. Addition of 500 l
M of the indicated bile acid (H–L) for 6 h leads to little changes in cell-cycle parameters as indicated. The (%) of
cells in apoptosis is indicated in the top left corner of each panel. Characterization of nuclear morphology following DCA stress. (M–P) Mor-
phology of OE cells. OE33 (M, N) and OE21 (O, P) cells were treated with DCA (500 l
M) for 6 h. Cells were then fixed, the nuclei stained
with Cytox and the fluorescence measured using confocal microscopy. Control OE33 cells were dividing, but following the DCA stress, small
early apoptotic nuclei (red arrow), and late apoptotic nuclear fragments (white arrows) were visualized. In OE21 cells treated with DCA, no
nuclear fragmentation was visualized, and only a few sparse small apoptotic nuclei were present (white arrow). (Q, R) Electron microscopic
analysis of OE33 oesophageal cells treated with DCA. OE33 cells (Q) were treated with 500 l
M DCA for 6 h and analysed by electron micro-
scopy. OE33 cells showed characteristic signs of apoptosis following the DCA stress, as shown by their small, isolated, spherical shape (R).
The multiple regions of darkly stained nuclei also indicate that nuclear condensation and fragmentation has occurred in these cells. OE21
cells retained normal histology following DCA stress, indicating they were nonapoptotic (data not shown).
SEP53 attenuates deoxycholate-mediated injury J. Darragh et al.
1936 FEBS Journal 273 (2006) 1930–1947 ª 2006 The Authors Journal compilation ª 2006 FEBS
DCA attenuated phosphorylation of the normally pro-
survival PKB at the activating site of PKB in OE33
cells (Fig. 3K, lane 4 versus 2). By contrast, basal inac-
tivating phosphorylation of GSK3 was reduced in
OE33 cells (Fig. 3M, lane 4 versus 2). The opposite
occurs in the OE21 cells: DCA did not block phos-
phorylation of PKB in the resistant OE21 cells
(Fig. 3O, lane 4 versus 2), although GSK phosphorylat-
ion actually increased in OE21 cells (Fig. 3Q, lane 4
versus 2). The data suggest that the GSK3–PKB–PKC
Fig. 5. SEP53 enhances colony survival in tumour cell lines. (A–D) Survival activity in tumour cell lines. H1299 cells (p53-null) (A, B) and
A375 cells (wt p53) (C, D) were transfected with the indicated DNA vector (1 lg) and one day after transfection, cells were split and
plated in media containing Geneticin to select for cell containing vector DNA. After three weeks, the number of cells was determined by
fixing cells and staining with dye: vector only, p53 and SEP53. (E). Homology of SEP53 to other genes imbedded in the epidermal differ-
entiation complex on chromosome 1q21 including THH, REP, PFG, HORN and BBBAS. Amino acid and DNA homology (%) are as indica-
ted. (F). Homology of the EF-hand domain between members of the Homo sapiens epidermal differentiation complex loci. (G). Deletion of
the calcium-binding EF-hand domain of SEP53 inhibits its activity in a clonogenic assay. H1299 cells (p53-null) were transfected with the
indicated YFP-DNA vector (1 lg) and one day after transfection, cells were split and plated in media containing Geneticin to select for cell
containing vector DNA. After three weeks, the number of cells were determined by fixing cells and staining with dye and quantified in
(H). The lower molecular mass of DCa–YFP–SEP53 compared with full-length SEP53 is depicted in (I). Individual colonies from a different
plate (vector only, SEP53 transfected or YFP–SEP53 transfected) were cloned and propagated for use in the assays described in other
experiments.
J. Darragh et al. SEP53 attenuates deoxycholate-mediated injury
FEBS Journal 273 (2006) 1930–1947 ª 2006 The Authors Journal compilation ª 2006 FEBS 1937
pathway axis, rather than p53, is a primary mediator
of the differential apoptotic response of the two cell
lines.
Gastric fluid contains a mixture of different bile
acids in addition to DCA (as in Fig. 2B). These have
different biochemical properties and in terms of biolo-
gical effect they have been shown to vary in their abil-
ity to induce apoptosis in colorectal cancer cell lines,
although DCA is the prime bile used in generalized
research [11,13,25,30]. Therefore, the effect of several
conjugated and unconjugated bile acids on the induc-
tion of apoptosis in both the sensitive OE33 and resist-
ant OE21 oesophageal cell lines was investigated
(Fig. 4). The sensitivity of the adenocarcinoma cell
line, OE33 to deoxycholic acid-induced apoptosis was
abrogated when this bile acid was conjugated to tau-
rine (taurodeoxycholic acid; Fig. 4B versus Fig. 4D).
Similarly the addition of CA, a trihydroxy bile acid or
ursodeoxycholic (UDCA) a 3a:7b dihydroxy bile acid
had no damaging effect on OE33 cells (Fig. 4C,D).
However, CDCA and LA did induce apoptosis in the
OE33 cell line, with the percentage of sub-G1 cells
increasing to 25 and 23%, respectively (Fig. 4E,F).
Furthermore, the levels of apoptosis induced by these
two bile acids were similar to levels obtained following
a DCA stress in this same cell line (25%, Fig. 3D,E
versus Fig. 4A). OE21 cells remained resistant to all
bile acids studied, irrespective of their hydrophobicity
(Fig. 4G–L). Thus, CDCA, DCA and LA were the
three most potent cell death-inducers and the mean
concentration of these in gastric fluid was 112, 63 and
17 lm, respectively. The data indicate that DCA is in
fact the second-most abundant toxic effector, exerts a
similar toxicity to the other two bile acids, and affirms
its use as a model damaging agent.
SEP53 functions as a survival factor in a
clonogenic assay
The key stresses thought to predominate in oesopha-
geal squamous epithelium and cause tissue injury
include heat shock [31], low pH [5] and DCA [14]. We
examined specifically whether SEP53 protein modifies
the DCA death response, as this is proving to be a
physiologically relevant DNA damaging agent [14,25].
We had first analysed a range of tumour cell lines for
SEP53 protein levels and have not found one cell that
expressed the protein including the OE panel described
here (data not shown). This may relate to the fact that
the SEP53 gene is located on chromosome 1q21 within
a group of proteins named the epidermal differenti-
ation complex fused-gene family and that this locus
might be silenced by chromatin remodelling as part of
a general mechanism that suppresses genes from this
locus in cancer cells [19,20]. Furthermore, the OE
oesophageal cancer cell lines were not easily transfected
with the SEP53 gene to make protein, so alternate
model cells had to be used to study SEP53 gene func-
tion. For example, although the transfected SEP53
gene can be transcribed into a stable RNA species in
OE19 or OE33 cells (Fig. 6A, left, lanes 3 and 5), we
could not detect SEP53 protein in these OE cell panels
(data not shown). This contrasts with, for example,
HCT116 cells, in which untagged or HIS-tagged
SEP53 protein could be easily detected in wild-type
p53 or p53-null cells (Fig. 6A, middle, lanes 2, 3, 6
and 7 versus 1 and 5). We first chose the H1299 cell as
a model because it is well characterized with regards to
its apoptotic pathway, is p53-null (which is not
required for DCA-induced death) (Fig. 5), does not
express endogenous SEP53 protein (data not shown),
has been used previously to characterize the Barrett’s
oesophageal antigen Anterior Gradient-2 [21], and can
express transfected SEP53 protein (see below). Using
this cell model, the transfection of the tumour suppres-
sor p53 gene into cells can suppress the number of
colonies formed, relative to vector DNA only control
(Fig. 5A,B), whereas SEP53 enhances colony forma-
tion in this assay (Fig. 5A,B), indicating that SEP53
can function like a survival factor rather than a growth
suppressor like p53. The survival activity is apparently
not modified by p53 because A375 cells containing a
wild-type p53 pathway also exhibit similar enhanced
survival in response to DCA -mediated cell death
(Fig. 5C,D). The survival-promoting activity of SEP53
is consistent with its role as a stress-induced protein
where cells might recruit the protein to maintain cell
integrity.
The mechanism whereby SEP53 functions as a survi-
val factor is not defined, but is consistent with the
function of other unrelated stress proteins. In order to
begin to develop a mechanism to explain how SEP53
functions as a survival factor, we thought that analy-
sing the functional domains of SEP53 might gives clues
to the signalling pathways linked to its function. The
SEP53 gene is located on chromosome 1q21 within a
group of proteins – the ‘fused gene’ family. These pro-
teins are of similar structure to SEP53 containing an
N-terminal EF-hand calcium-binding domain and
multiple C-terminal amino acid repeat sequences.
Using a protein BLAST search, several proteins on the
1q21 locus demonstrated limited homology to SEP53
(Fig. 5E). The greatest similarity between these
proteins was within the first 90 amino acids, which
contain the two helix–turn–helix sequences of the
EF-hand calcium-binding motifs. The calcium-binding
SEP53 attenuates deoxycholate-mediated injury J. Darragh et al.
1938 FEBS Journal 273 (2006) 1930–1947 ª 2006 The Authors Journal compilation ª 2006 FEBS
sites of the proteins all share 45–50% identity with
SEP53’s calcium-binding site (Fig. 5B). The EF-hand
in SEP53 homologues is also well conserved (data not
shown), although the remaining 80% of the protein
has < 30% identity with its murine counterpart. This
bioinformatics analysis suggests that calcium binding
might be central to the function of SEP53 and as such
we analysed whether deletion of the calcium-binding
domain of SEP53 alters its specific activity in the
clonogenic assay. Yellow fluorescent protein (YFP)-
H
1
2
9
9
c
o
n
H
1
2
9
9
S
E
P
5
3
SEP53
actin
SEP53 expression in cancer cells
Left panel (RT-PCR of transfected SEP53 in OE cells) Middle panel (Protein expression in transfected HCT116 cells) Right panel (Protein expression in transfected H1299 cells)
S
E
P
5
3
c
o
n
t
r
o
l
c
o
n
t
r
o
l
S
E
P
5
3
SEP53 amplimer
OE19
OE21
o
c
t
nrol
n
a
t
i
v
e
S
E
P
5
3
H
I
S
-
S
E
P
5
3
G
S
T
-
S
E
P
5
3
c
o
n
t
r
o
l
n
a
t
i
v
e
S
E
P
5
3
H
I
S
-
S
E
P
5
3
G
S
T
-
S
E
P
5
3
c
o
n
t
r
o
l
n
a
t
i
v
e
S
E
P
5
3
H
I
S
-
S
E
P
5
3
G
S
T
-
S
E
P
5
3
HCT116
p53
+
/
+
HCT116
p53
-
/
-
HCT116
p21
-
/
-
c
o
n
t
r
o
l
n
a
t
i
v
e
S
E
P
5
3
H
I
S
-
S
E
P
5
3
G
S
T
-
S
E
P
5
3
c
o
n
t
r
o
l
n
a
t
i
v
e
S
E
P
5
3
H
I
S
-
S
E
P
5
3
G
S
T
-
S
E
P
5
3
c
o
n
t
r
o
l
n
a
t
i
v
e
S
E
P
5
3
H
I
S
-
S
E
P
5
3
G
S
T
-
S
E
P
5
3
HCT116
p53
+
/
+
HCT116
p53
-
/
-
HCT116
p21
-
/
-
1 2 3 4 5 6 7 8
12 3 4 5 1 2
A
D
F
E
DCA with Ethanol
0
10
20
30
40
50
60
70
80
90
00.51 2 4
Fixed DCA + increasing
Ethanol (%)
Cell iv baility( %)
con
Sep-53
C
Ethanol only
0
20
40
60
80
100
120
00.51 2 4
Ethanol (%)
Cell V iab ility( %)
con
Sep-53
B
Deoxycholic acid only
0
20
40
60
80
100
120
01246
Hours of incubation with DCA
Ce V lliabytili%( )
con
Sep-53
Deletion of the Calcium binding
domain attenuates SEP53
function after DCA exposure
0
10
20
30
40
50
60
70
80
SEP53- SEP53+ Dca- Dca+
stable cell
g
enot
y
pe
C
e
l
lV
iab
l
iyti%()
SEP53
∆ca-SEP53
Actin
SEP53 and ∆Ca-SEP53 protein
expression in stable cells
1 2
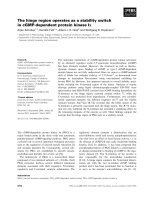
Fig. 6. Cell viability in response to DCA damage is enhanced by SEP53. (A) SEP53 gene expression in transfected tumour cell lines. Vector
or SEP53 gene (1 lg) was transfected into: (a) left panel, OE190 and OE21 cells; (b) middle panel, HCT116 cells; and (c) right panel, H1299
cells. In the left panel, SEP53 protein production could not be observed (data not shown), but RNA was isolated for RT-PCR analysis where
the expression of the gene can be detected (lanes 5 and 3 versus 2 and 4). In the middle panel, SEP53 expression vectors were used in
HCT116 cells without a tag (lanes 2 and 6), with a HIS-tag (lanes 3 and 7), or GST tag (lanes 4 and 8) and immunoblotted with the SEP53
antibody. In the right panel, SEP53 protein was detected in H1299 cells, relative to the control. (B–D) Viability of H1299 cells after exposure
to selected stresses. The H1299 panel without or with SEP53 protein (see immunoblot in the Fig. 6A, right panel) was treated with the indi-
cated combination of (B) fixed concentrations of DCA over the indicated time (500 l
M), (C) increasing concentrations of ethanol (for 6 h), or
(D) combination of fixed DCA (500 l
M) and increasing concentrations of ethanol for 2 h. Viability was determined as indicated in Experimen-
tal procedures using Trypan Blue. (E). Development of stable cell lines expressing wt SEP53 and DCa–SEP53. H1299 cells (p53-null) were
transfected with the indicated DNA vector (1 lg) and one day after transfection, cells were split and plated in media containing Geneticin to
select for cell containing vector DNA (as in Fig. 5A,G). After three weeks, the number of cells was determined by fixing cells and staining
with dye. Individual colonies from a different plate: (a) YFP-vector only (SEP53-negative clones); (b) YFP–SEP53 (lane 1); and (c) DCa–YFP–
SEP53 (lane 2) were cloned, propagated, and amount of SEP53 quantified by immunoblotting as indicated. (F) Deletion of the EF-hand
domain inhibits the survival activity of SEP53. Cell panels were exposed to DCA and processed to analyse for toxicity by Trypan Blue stain-
ing. The data reflect cell survival (%) as a function of genotype: from left SEP53
– ⁄ –
, SEP53
+
, DCa-SEP53
– ⁄ –
,andDCa-SEP53
+
.
J. Darragh et al. SEP53 attenuates deoxycholate-mediated injury
FEBS Journal 273 (2006) 1930–1947 ª 2006 The Authors Journal compilation ª 2006 FEBS 1939
fusion constructs of wild-type SEP53 was transfected
into cells and this fusion protein induced a similar
survival activity to untagged SEP53 in a clonogenic
survival assay relative to YFP-control (Fig. 5G,H).
Deletion of the calcium-binding domain in SEP53
strikingly reduced the survival activity, possibly into a
dominant negative form of the protein that actually
functioned as a growth suppressor, relative to the con-
trol (Fig. 5G,H).
SEP53 functions as a survival factor after DCA
exposure in a viability assay
Another standard assay was used to evaluate SEP53
function as a stress protein, involving alterations in cell
viability as measured by Trypan Blue exclusion. When
SEP53
neg
⁄ H1299 cells were exposed to increasing con-
centrations of DCA, there was a time- and dose-
dependent increase in nonviable cells within 4–6 h
(Fig. 6B). However the SEP53
+
⁄ H1299 cells had a
higher degree of resistance to DCA-induced toxicity
(Fig. 6B), especially at 4 and 6 h post treatment, again
consistent with SEP53 functioning like a classic stress
protein and promoting cell survival under a stressful
stimuli. We examined a range of treatments and ⁄ or
chemicals relevant to acid-reflux disease control for
SEP53-modified effects alone and in combination with
DCA (data not shown). These include pro-oxidizing
agents, chemicals that alter chromatin deacetylation
and methylation, thermal stresses, ethanol, heavy
metals and acidified versions of such treatments. In
particular, ethanol may be an associated risk factor for
tissue injury, however, ethanol alone at up to 4% (v ⁄ v)
does not effect cell viability in SEP53
+ ⁄ neg
cells
(Fig. 6C). However, the combined action of ethanol
with fixed DCA is more toxic than DCA alone
(Fig. 6D) and SEP53 overproduction reduces the toxic
effect of this treatment (Fig. 6D). Together, these date
demonstrate that SEP53 can function as a survival
factor, in particular modifying the DCA-viability
response.
Because deletion of the calcium-binding domain of
SEP53 attenuated is activity as a survival factor in a
clonogenic assay, we also evaluated whether the
response to DCA required the calcium-binding
domain. Stable cells overexpressing full-length YFP–
SEP53 fusion protein and the YFP–DCa:SEP53 variant
were also constructed in order to analyse differences in
DCA response in a nontransient cell system. An exam-
ple of the set of cell clones acquired is given in
Fig. 6E, and one representative pair was used expres-
sing equivalent levels of both full-length YFP–SEP53
fusion protein and the YFP–DCa:SEP53 variant. In
response to DCA challenge, the full-length YFP–
SEP53 stable cell enhanced cell survival as defined
by Trypan Blue staining (Fig. 6F), similar to that
observed in transient systems or in stable cells overpro-
ducing the untagged version of the protein. By con-
trast, the YFP–DCa:SEP53 variant was unable to
protect cells from death induced by exposure to DCA
(Fig. 6F). Finally, SEP53 was also able to attenuate
DCA-induced apoptotic response in HCT116 cells
(Fig. 3F–H), from 33 to 16% apoptotic cells (data not
shown). This attenuation was lost using the transfected
DCa:SEP53 (data not shown), which is again consis-
tent with a survival activity of the protein.
The mechanism whereby SEP53 protects cells from
DCA-mediated injury is not clear and we sought to
define such a mechanism. DCA is known to induce
DNA damage [14], but whether DNA damage-inde-
pendent pathways are linked to SEP53 function is fur-
ther undefined. The mechanism underlying the effects
of the calcium-binding domain in SEP53 on its pro-
tective function was examined by determining whether
SEP53 alters calcium-signalling pathways in cells. For
example, SEP53 might function as a sensor of calcium
perturbation and this might recruit the protein to func-
tion in a protective pathway.
Fura-2 can be used to quantify the concentration of
free calcium in cells (Fig. 7A,B). Stresses that activate
cell death often induce the release of calcium that acts
like a signalling molecule and triggers apoptotic cas-
cades [32,33]. Although not reported previously, DCA
induces release of calcium in cells in a dose-dependent
manner up to $ 40 nm (Fig. 7C). Furthermore, in cells
overexpressing SEP53, there was an attenuation in the
release of calcium in response to DCA (Fig. 7C). By
contrast, cells expressing the YFP–DCa:SEP53 variant
were unable to prevent the release of calcium in
response to DCA (Fig. 7D). These data together pro-
vide a correlation between the protective function of
SEP53 in response to DCA, calcium release suppressed
by SEP53, and its highly conserved calcium-binding
domain.
Discussion
Tissue-specific stress responses control cell injury, dis-
ease development, and related cancer progression rates.
The environmental agents that play a role in cancer
development are defined in only a few types of cancers,
including those of the skin, breast and gut, mainly
because patients present with complications represent-
ing intermediates that can be analysed by endoscopy.
The oesophageal squamous epithelium is one such tis-
sue amenable to study and is subject to damage from
SEP53 attenuates deoxycholate-mediated injury J. Darragh et al.
1940 FEBS Journal 273 (2006) 1930–1947 ª 2006 The Authors Journal compilation ª 2006 FEBS
refluxate containing deoxycholate and related bile acids
that might play a role in promoting normal tissue
injury [22]. In this report, we cloned the uncharacter-
ized squamous cell-specific stress gene SEP53, devel-
oped antibodies to the gene product, examined its
expression, and developed cell lines to determine whe-
ther the gene product had protective effects from DCA
damage in vitro.
Cellular stress protein responses play a key role in
minimizing cell injury and maintaining tissue integrity
in response to damaging levels of an environmental
agent. As such, the integrity of this system plays a role
in modifying progression of diseases associated with
ageing, DNA or protein damage and chronic injury.
Although the HSP genes are evolutionarily conserved
and presumably have a ubiquitous function in all cellu-
lar repair processes [38], a surprising observation in
metazoans is that there is a relatively high degree of
cell and tissue specificity in HSP and related stress-acti-
vated transcription factor induction [39–44]. Consistent
with this, our initial analysis of the basic stress
response in squamous epithelium indicated that the
-1.5 -1.0 -0.5 0.0
-1.00
-0.75
-0.50
-0.25
0.00
0.25
0.50
0.75
1.00
1.25
log([Ca
2+
]
free
r
2
=1
y=0.958x+0.95
x intercept = -0.9921
K
d
=0.102
nm
1000
2000
0
0.017
0.038
0.065
0.100
0.150
0.225
0.351
0.602
1.35
Em=510 nm
Wavelength (nm)
eroulFsecE ecnxaticnoit
300 350 400 450
nm
0
0
0.017
0.038
0.065
0.100
0.150
0.225
0.351
0.602
1.35
39 n
M free
Calcium
Em=510 nm
Wavelength (nm)
eroulFsecE ecnxaticnoit
A
Emission Spectra for FURA-2 calibration
B
Calibration plot for FURA-2
Log (bound/free)
C
SEP53 reduces calcium release
after DCA treatment
0
5
10
15
20
25
30
35
40
45
50
0.25 0.5 1
DCA concentration (m
M
)
Incr esaei snCalcium
noccentrtaion( n
M
)
con
Sep-53
D
The calcium binding domain of
SEP53 is required to suppress
calcium release
0
5
10
15
20
25
SEP53- SEP53+ Dca- Dca+
stable cell genotype
In
r
c
i
sesaena
c
l
c
i
u
m
o
cn n
e
ctr
t
aion(
n
M
)
Fig. 7. The EF-hand domain of SEP53 is required to suppress calcium release after DCA exposure. (A, B) Calibration for Fura-2 was devel-
oped as described in the Experimental procedures. (C) DCA-induced calcium release is attenuated by SEP53. The SEP53
– ⁄ –
and SEP53
+
cell
pair was exposed to increasing concentrations of DCA for 6 h and cells were analysed for free calcium changes based on the calibration in
(A) and (B). (D) Deletion of the EF-hand domain permits DCA-induced calcium release. Cell panels as indicated were exposed to DCA and
processed to analyse for free calcium changes based on the calibration in (C) and (D). The data reflect changes in calcium release (in nano-
molar concentrations) as a function of genotype: from left SEP53
– ⁄ –
, SEP53
+
, DCa–SEP53
– ⁄ –
and DCa–SEP53
+
.
J. Darragh et al. SEP53 attenuates deoxycholate-mediated injury
FEBS Journal 273 (2006) 1930–1947 ª 2006 The Authors Journal compilation ª 2006 FEBS 1941
classic HSP70 was strikingly downregulated after
stresses like heat shock or ethanol exposure [16]. Many
tissues also exhibit uncoupled HSP gene expression
and HSP protein induction many hours after stresses
including hyperthermia as well as endotoxin exposure
[45–47]. Some animals do not show any evidence of
HSP gene expression after stress in some cell types
[48–52], similar to the squamous epithelium as
summarized above. In Drosophila melanogaster, Mal-
pighian tubules an atypical stress response and can
remarkably induce a novel HSP60 family member after
heat shock, but only in this tissue type [44], indicating
that some cells have evolved unique stress responses pre-
sumably due to unique microenvironmental pressures.
The mechanisms underlying this tissue and cell-speci-
fic control on rates of stress protein induction in metazo-
ans is not clear. We therefore used a functional
proteomics approach with normal oesophageal squa-
mous epithelium, a relatively unique tissue with respect
to the types of environmental agents to which it is
exposed. Three major proteins were identified as stress
proteins and of these, the SEP53 has the most unre-
solved function [17]. As such, we focused on the study of
this gene product because identifying its function might
give more insight into squamous cellular stress
responses. The SEP53 gene was originally cloned as a
gene named C1orf10 (clone 1 open reading frame 10)
expressed in normal but not oesophageal cancers [18],
whereas we identified it independently as a protein
induced by heat shock or ethanol treatment ex vivo in
normal squamous epithelium [17]. A more recent study
has indicated that the protein is expressed by immunoh-
istochemical methods in skin keratinocytes and it was
speculated that the protein may play a role in epidermal
differentiation [53]. In this report we provide the first
functional information to explain why SEP53 protein
might be induced by stress in the oesophagus: it can
function as a survival factor that might allow cells to tol-
erate normally lethal levels of DCA. SEP53 protein
expression will presumably help maintain the barrier
function in squamous epithelium in response to injury.
The mechanism whereby DCA can induce cell injury
was recently shown to involve in part DNA damage
[14]. Our study also shows that free calcium concentra-
tions are elevated after exposure to DCA (Fig. 7) and
that the apoptotic response requires a PKC-dependent
pathway (Fig. 3). The fact that SEP53 can attenuate
DCA-mediated elevations in calcium (Fig. 7) suggest
that it can at the least function in between the signal cas-
cade initiated by exposure and the trigger that releases
calcium leading to PKC-dependent apoptosis.
What will the biological relevance of SEP53 entail?
Because the gene is not well-conserved during evolu-
tion, being, as far as we can tell, confined to mammals
with the murine homologue being only $ 50% identi-
cal, it is not clear whether SEP53 will function in
DCA responses in other species. Because microarray
analyses from genomic consortium indicate that mu-
rine SEP53 is expressed in cervical squamous epithe-
lium and skin (data not shown), it might have evolved
initially a ‘barrier’ function in tissues other than the
oesophagus. The N-terminal calcium-binding domain
of SEP53 is highly conserved suggesting this is central
to its function. Accordingly, viral infection or oxidant
stresses in cervix, bladder or skin that effect calcium
release might reflect the conditions under which SEP53
evolved originally. The response to DCA in human
cells might have been acquired later in evolution, and
because the toxic effects of bile in humans might also
lead to calcium release (Fig. 7), the highly conserved
calcium-binding domain of SEP53 might play an
important role in this sensing. In relation to this, our
previous proteomics approach comparing normal
squamous to Barrett’s epithelium noted a relatively
high level of calcium-binding proteins differentially
expressed [21], which might relate to the importance of
calcium signalling in oesophageal epithelial homeosta-
sis. Future research in this area will involve identifying
novel SEP53-binding proteins that can in turn be
evaluated biologically to ascertain how SEP53 pro-
tein might function as a protective stress-responsive
protein.
Experimental procedures
Chemicals and reagents
Unless otherwise stated, all chemicals and reagents were
purchased from Sigma-Aldrich (Gillingham, UK). Bis-
indolylmaleimide I (Bis-I) and the negative control bis-
indolylmaleimide V (Bis-V) were from Calbiochem. All
solvents and acids were obtained from BDH (Merck Ltd,
Dorset, UK). Tissue culture medium, sterile NaCl ⁄ P
i
, fetal
bovine serum (FBS), Trypsin EDTA and Lipofectamine
were all purchased from Gibco BRL (Paisley, UK).
Analysis of bile acids in gastric juice by gas
chromatography
Aspirates of gastric fluid were obtained at endoscopy from
172 patients being investigated for GORD following
informed consent and with the approval of the local Tay-
side Medical Ethics Committee. Gastric juice aspirates were
collected from patients during a routine upper gastro-intes-
tinal (GI) endoscopy at Ninewells Hospital and Medical
School, Dundee, UK. All patients were participating in the
SEP53 attenuates deoxycholate-mediated injury J. Darragh et al.
1942 FEBS Journal 273 (2006) 1930–1947 ª 2006 The Authors Journal compilation ª 2006 FEBS
Barrett’s Oesophagus Risk Evaluation Database (BORED)
study, which was approved by the Tayside Medical Ethics
Committee. As part of this study, written consent was given
to obtain pinch biopsies, gastric juice aspirates and blood
from all patients. In addition, questionnaires giving detailed
information on patient age, sex, medical and drug prescri-
bing history, alcohol consumption and diet were provided.
An endoscopy examination was carried out to obtain tissue
for diagnosis, during which gastric juice was aspirated from
the gastric fundic region using a suction trap, and then
stored at )20 °C until analysed. Gastric juice samples were
taken during a routine diagnostic endoscopic procedure.
Although all patients had symptoms of gastro-oesophageal
reflux disease, 52 patients had no indicators of disease by
endoscopy. Forty-eight patients had oesophagitis with vary-
ing degrees of severity and 60 patients were diagnosed with
Barrett’s oesophagus. Clinical information was unavailable
for 12 of the patients. No significant difference was found
when total and unconjugated bile acid concentrations of
gastric juice were compared for the 3 patient groups (data
not shown and published in the PhD thesis of J Darragh,
University of Dundee). Similar levels of bile acids were
detected in each group, however, a small number of
patients displayed unusually high concentrations. The con-
centrations of cholesterol, CA, CDCA, DCA, LCA and
UDCA were analysed individually with regard to the differ-
ent patient groups. The presence of a particular bile acid
was not associated with disease state as determined by
one-way anova (data not shown and published in the PhD
thesis of J Darragh, University of Dundee). Although no
difference in specific bile acid concentrations was observed
between the various diagnostic groups, the ratio of the sec-
ondary bile acid DCA and its hydroxylated primary precur-
sor CA was determined for each group to determine any
possible changes in proportion. In addition possible chan-
ges in the proportion of conjugated to unconjugated bile
acids were analysed. No statistically significant change in
bile acid ratios was found (data not shown and published
in the PhD thesis of J Darragh, University of Dundee). The
effect of proton pump inhibitor (PPI) medication on bile
acid levels was also investigated. The total bile acid concen-
trations of patients who had, and had not taken PPIs
within a month of endoscopy were compared. Furthermore,
the change in the conjugated to unconjugated bile acid ratio
was determined for these two groups. No significant differ-
ence in either concentration or composition of bile acids
was demonstrated following analysis with a Student’s
paired t-test. It is, however, important to note that the
numbers of patients in each group differed considerably, as
only 42 patients were not on any PPI treatment compared
with 113 patients on medication. Gastric juice samples were
taken during a routine diagnostic endoscopic procedure.
The bile acid composition of the samples was determined
by gas chromatography using a method described previ-
ously [34]. Known concentrations (0.5, 1, 2 mgÆmL
)1
)of
standard CA, CDCA DCA, UDCA and LCA bile acids
were used for calibration (Fig. 1A,B). For detection by gas
chromatography, bile acids had to be initially hydrolysed to
remove glycine and taurine conjugates, and subsequently
extracted and derivatized [34].
Cell culture
Cell lines were cultured in a 95% O
2
,5%CO
2
incubator at
37 °C in the indicated medium: H1299 cells (lung carcinoma
cells were a gift from D Lane, University of Dundee, UK)
were cultured in RPMI 1640, 25 mm Hepes, 2 mml-gluta-
mine, and 10% FBS; A375 cells (melanoma cells were a gift
from J Blaydes Vogelstein, Southampton University, UK)
were maintained in Dulbecco’s modified Eagle’s medium and
10% FBS; and HCT116 cells (p53
+
and p53
–
derivative
colon carcinoma cells were a gift from B Vogelstein, Johns
Hopkins University, USA) were maintained in McCoys’s
media containing 10% FBS. All human oesophageal cancer
cell lines were obtained from the European Collection of Cell
Cultures (ECACC), Salisbury, UK, and grown in RPMI.
OE19 (ECACC no. 96071721) and OE33 (ECACC no.
96070808) cells were derived from adenocarcinomatous
tumours of the oesophagus, whereas the OE21 (ECACC no.
96062201) and KYSE30 (ECACC no. 94072011) cell lines
were derived from oesophageal squamous carcinoma. Cells
were transfected at 70% confluency with DNA as indicated
and the plasmid DNA solution was diluted to a final concen-
tration of 5 lgÆmL
)1
in prewarmed serum-free medium. Tfx
reagent (Promega Corp., Madison, WI) was thawed at room
temperature and added to the DNA ⁄ medium mixture, with
4.5 lL of Tfx added for every 1 lg of DNA used (a charge
ratio of 3 : 1, Tfx ⁄ DNA). The DNA ⁄ Tfx reaction mixture
was incubated for 15 min at room temperature, made up to
3 mL with serum-free medium, and then added to each flask
of medium-free cells. Cells were then placed in the 37 °C
incubator for 1 h to enable the transfection to occur. Follow-
ing the 1 h incubation, 3 mL of medium containing 20%
fetal calf serum (FCS) was added to the cells, giving a final
concentration of 10% FCS. To develop colony formation
assays, cells were transfected with 1 lg of DNA per well and
24 h post transfection, equal numbers of cells were seeded
into 10 cm plates with Geneticin (antibiotic G418) selection
at 1 mgÆmL
)1
. Colonies were fixed with methanol (10 min at
room temperature) and stained with a 1 ⁄ 20 (v ⁄ v) dilution of
Geisma stain for 20 min at room temperature. To create sta-
ble cell lines expressing SEP53 protein, H1299 cells were
transfected with 1 lg DNA (untagged SEP53 or tagged:
pEYFP–C ⁄ N, pEYFP–C ⁄ N–DCa:SEP53 and pEYFP–
C ⁄ N:SEP53). When single colonies reached 1–2 mm in size,
colonies were trypsinized using cloning cylinders (Sigma,
UK). Trypan Blue staining was carried out as described
[35]. FACS analysis was performed as described previ-
ously [36]. A FACScan flow cytometer system (Becton
Dickinson, Europe) was used to count the individual cells
J. Darragh et al. SEP53 attenuates deoxycholate-mediated injury
FEBS Journal 273 (2006) 1930–1947 ª 2006 The Authors Journal compilation ª 2006 FEBS 1943
(30 000 events). The flow cytometer measured the following
parameters: forward light scatter (FCS), side light scatter
(NaCl ⁄ Cit) and fluorescence of the DNA–PI complex at
620 nm using the FL3 lens.
Immunochemical methods
Pinch biopsies were obtained from patients during a routine
upper GI endoscopy at Ninewells Hospital and Medical
School, Dundee, UK. All patients were taking part in the
BORED study, which was approved by Tayside Medical
Ethics Committee. All patients gave informed consent before
samples were taken. Samples were snap frozen in liquid nitro-
gen and stored at )70 °C until analysis. Frozen cell pellets
were developed as described previously [21]. Protein concen-
trations were determined by the method of Bradford [37].
Antibodies used for immunoblotting and fluorescent micros-
copy include: a -b-actin (Abcam, Cambridge, UK), a-SEP53
polyclonal (Moravian Biotechnologies, Czech Republic.),
a-SEP53 monoclonals [developed in this study and unless
indicated the MAbs immunoblotted for SEP53 were 4.1
(Class B), since it was of highest titre when grown as ascites
and could detect cleaved SEP53 (as could class A)], DO1
(a-p53), PKB ⁄ AKT IgG, phospho-specific PKB ⁄ AKT IgG,
and phospho-specific GSK3 IgG were from Cell Signalling
Technology (UK), anti-GSK3 IgG was from BD Transduc-
tion Laboratories, Europe. Horseradish peroxidase (HRP)-
anti-mouse (Dako Ltd, Ely, UK), HRP-anti-rabbit (Dako),
and Alexa-FluorÒ 594 anti-mouse sera (Molecular Probes,
Invitrogen, Paisley, UK). Stained slides were viewed with an
Eclipse E600 microscope (Nikon, Kingston upon Thames,
UK). Fluorescent micrographs were produced using spot
advanced software (Diagnostic Instruments, Sterling
Heights, MI).
Recombinant SEP53 gene construction
Total RNA was isolated from normal oesophageal tissue
(RNeasy Mini Kit, Qiagen, Crawley UK) and 1 lg used for
reverse transcription using Omniscript and oligo(dT)
15
pri-
mer (Qiagen). The sequences of the oligonucleotides used
in the amplification of SEP53 are: forward 5¢-CATA
GCTCGAGCTATGCCTCAGTTACTGCAAAACATT-3¢;
reverse 5¢-CAGTCAAGCTTCATGGCTTGGTGCTTCT
CAAGT-3¢. Oligonucleotides used in PCR amplification of
this SEP53 fragment to introduce attB sequences for clo-
ning into the Gateway cloning system (Invitrogen) were:
forward 5¢-GGGGACAAGTTTGTACAAAAAAGCAG
GCTCCATGCCTCAGTTACTGCAA AACATTAATGGG
ATCATCGAGGCC-3¢; reverse 5¢-GGGGACCACTTTGT
ACAAGAAAGCTGGGTCGGCCAGCGGCTTAAGGTT
TTATTGATGCATTAGGGTAGATGGGGC-3¢. Human
SEP53 gene was subcloned into the Gateway entry vector
pDONR201 (Invitrogen) and the sequence confirmed by
DNA sequence analysis. To subclone SEP53 with the
calcium binding site deleted (DCa–SEP53) PCR primers
were designed with restriction sites BglII at the N-terminus,
XbaI at the C-terminus and start and stop codons. These
primers were used to amplify a DCa–SEP53 PCR product.
The XbaI site in the pEYFP-C1 vector is methylated and
for cloning into this vector, plasmid DNA was transformed,
into the dam
–
Escherichia coli strain GM2163 (New Eng-
land Biolabs, UK). DNA was isolated using a QIAPREP
Spin mini prep kit (Qiagen). The unmethylated pEYFP-C1
DNA and DCa–SEP53 PCR product were then digested
with BglII and XbaI restriction enzymes. The vector and
PCR product were then ligated and transformed into com-
petent cells. SEP53 expression was analysed using the
primers: (a) full-length SEP53, forward 5¢)3¢ CAGTC
AAGCTTATGCCTCAGTTACTGCAAAAC and reverse
5¢)3¢ CATAGCTCGAGTCATGGCTTGGTGCTTCTC;
(b) DCa–SEP53, forward 5¢)3¢ TGCTAGAATTCAGATC
TATGAGCGAGAGTGCTGAGGGA and reverse 5¢)3¢
TGCTATCTAGATCATGGCTTGGTGCTTCT. HIS-tagged
SEP53 in the vector pDEST17 (Invitrogen) was trans-
formed into E.coli BL21 AI cells (Invitrogen, Paisley, UK)
and purified by nickel affinity chromatography. A panel of
MAb obtained by immunization of mice with full length
HIS-tagged SEP53 protein were developed by Moravian
Biotechnologies.
Calcium determinations
The fluorescent indicator Fura-2 (Molecular Probes) was
used to measure cytosolic-free calcium levels in cells. When
Fura-2 is bound to calcium it is excited at 340 nm and
when it is free it is exited at 380 nm and this difference can
be used to ascertain the intracellular calcium by measuring
the fluorescence emission at 510 nm for both these excita-
tion wavelengths. (A, excitation and emission at 340 nm
when Fura-2 is bound to calcium; B, excitation and emis-
sion at 380 nm when Fura-2 is free). Intracellular calcium
levels can then be calculated from Eqn (1) where K
d
is the
dissociation constant of the indicator, R is the ratio of
fluorescence (F) at 340 nm and 380 nm (F
340 nm
⁄ F
380 nm
), Q
is the ratio of F
min
⁄ F
max
at 380 nm.
½Ca
2þ
¼K
d
QððR À R
min
Þ=ðR
max
À RÞÞ ð1Þ
The K
d
value was obtained by calibrating the potassium
salt form of Fura-2 in cell-free solutions using a calcium
calibration buffer kit #1 (Molecular Probes). The kit con-
tains two buffers: 10 mm K
2
EGTA-buffered solution (‘zero’
free Ca
2+
) and 10 mm CaEGTA-buffered solution (40 lm
free Ca
2+
). Equal amounts of dye (10 lm) were added to
each buffer solution. Emission spectra at 510 nm were
measured over the excitation spectra 300–450 nm to create
a series of curves using a fluorescent spectrophotometer
(Hitachi). Data were analysed using fl solutions soft-
ware (Hitachi). The emission fluorescence at 510 nm for
excitation at 340 and 380 nm was then used to calculate
SEP53 attenuates deoxycholate-mediated injury J. Darragh et al.
1944 FEBS Journal 273 (2006) 1930–1947 ª 2006 The Authors Journal compilation ª 2006 FEBS
the K
d
value. The log of the [Ca
2+
] free (x-axis) is plotted
against the log of bound ⁄ free dye {(R ) R
min
) ⁄ (R
max
) R)}
(F
2min
⁄ F
2 max
)(y-axis). This can then be used to calculate
K
d
of the indicator, which is the inverse log of the x-inter-
cept. To label cells with Fura-2, Fura-2AM was used, as
the addition of the AM group results in an uncharged
molecule that can permeate cell membranes. Once the mole-
cule has entered the cell the AM group is cleaved by non-
specific esterases in the cells, resulting in a charged
molecule that leaks out far slower than its parent com-
pound. A 1 mm stock solution of Fura-2AM prepared in
dimethyl sulfoxide (DMSO) was diluted in an equal volume
of the nonionic detergent Pluronic F-127 (20% solution in
DMSO; Molecular Probes). This solution was then diluted
in serum-free, phenol red-free RPMI to a final concentra-
tion of 1 lm and added to cells that were incubated at
room temperature for 20 min with gentle shaking. Cells
were then washed twice in NaCl ⁄ P
i
and resuspended in
phenol red-free RPMI with 10% FBS and incubated for
30 min at room temperature with gentle shaking. Cell sus-
pensions were then used for intracellular calcium measure-
ments. Calcium levels were measured on a fluorescent
spectrophotometer F4500 (Hitachi) using the intracellular
cation scan mode. The effects of bile acids were measured
by adding deoxycholic acid dissolved in methanol to the
cell suspension to the desired concentration. Methanol
alone was used as a control. Data were analysed using fl
solutions software (Hitachi). The fluorescent spectro-
photometer settings for intracellular cation scan were as
follows: excitation wavelength k
1
(340 nm), excitation wave-
length k
2
(380 nm), emission wavelength (510 nm), excita-
tion slit (5 nm), emission slit (5 nm), PMT voltage (700 V);
cycle time (0.7 s) and time (300 s).
Acknowledgements
This work was supported by grants from BBSRC
(CASE PhD studentships to JD and MH), MRC
Career Establishment Grant (TRH), CRUK Transla-
tional Research Award (CRUK) and the Association
for International Cancer Research (TRH).
References
1 Vogelstein B & Kinzler KW (2004) Cancer genes and
the pathways they control. Nat Med 10, 789–799.
2 Hupp TR (2000) Development of physiological models
to study stress protein responses. Methods Mol Biol 99,
465–483.
3 Jankowski JA, Wright NA, Meltzer SJ, Triadafilopoulos
G, Geboes K, Casson AG, Kerr D & Young LS (1999)
Molecular evolution of the metaplasia–dysplasia–adeno-
carcinoma sequence in the esophagus. Am J Pathol 154,
965–973.
4 Wild CP & Hardie LJ (2003) Reflux, Barrett’s oesopha-
gus and adenocarcinoma: burning questions. Nat Rev
Cancer 3, 676–684.
5 Fitzgerald RC (2005) Barrett’s oesophagus and oeso-
phageal adenocarcinoma: how does acid interfere with
cell proliferation and differentiation? Gut 54 (Suppl. 1),
21–26.
6 Chaplin MF (1998) Bile acids, fibre and colon cancer:
the story unfolds. J R Soc Health 118, 53–61.
7 Bernstein H, Bernstein C, Payne CM, Dvorakova K &
Garewal H (2005) Bile acids as carcinogens in human
gastrointestinal cancers. Mutat Res 589, 47–65.
8 Milovic V, Teller IC, Faust D, Caspary WF & Stein J
(2002) Effects of deoxycholate on human colon cancer
cells: apoptosis or proliferation. Eur J Clin Invest 32,
29–34.
9 Milovic V, Teller IC, Murphy GM, Caspary WF & Stein
J (2001) Deoxycholic acid stimulates migration in colon
cancer cells. Eur J Gastroenterol Hepatol 13, 945–949.
10 Pai R, Tarnawski AS & Tran T (2004) Deoxycholic acid
activates beta-catenin signaling pathway and increases
colon cell cancer growth and invasiveness. Mol Biol Cell
15, 2156–2163.
11 Powell AA, LaRue JM, Batta AK & Martinez JD
(2001) Bile acid hydrophobicity is correlated with induc-
tion of apoptosis and ⁄ or growth arrest in HCT116 cells.
Biochem J 356, 481–486.
12 Martinez JD, Stratagoules ED, LaRue JM, Powell AA,
Gause PR, Craven MT, Payne CM, Powell MB, Gerner
EW & Earnest DL (1998) Different bile acids exhibit
distinct biological effects: the tumor promoter deoxy-
cholic acid induces apoptosis and the chemopreventive
agent ursodeoxycholic acid inhibits cell proliferation.
Nutr Cancer 31, 111–118.
13 Schlottman K, Wachs FP, Krieg RC, Kullmann F,
Scholmerich J & Rogler G (2000) Characterization of
bile salt-induced apoptosis in colon cancer cell lines.
Cancer Res 60, 4270–4276.
14 Jolly AJ, Wild CP & Hardie LJ (2004) Acid and bile
salts induce DNA damage in human oesophageal cell
lines. Mutagenesis 19, 319–324.
15 Olliver JR, Hardie LJ, Gong Y, Dexter S, Chalmers D,
Harris KM & Wild CP (2005) Risk factors, DNA
damage, and disease progression in Barrett’s esophagus.
Cancer Epidemiol Biomarkers Prev 14 , 620–625.
16 Hopwood D, Moitra S, Vojtesek B, Johnston DA, Dil-
lon JF & Hupp TR (1997) Biochemical analysis of the
stress protein response in human oesophageal epithe-
lium. Gut 41, 156–163.
17 Yagui-Beltran A, Craig AL, Lawrie L, Thompson D,
Pospisilova S, Johnston D, Kernohan N, Hopwood D,
Dillon JF & Hupp TR (2001) The human oesophageal
squamous epithelium exhibits a novel type of heat shock
protein response. Eur J Biochem 268, 5343–5355.
J. Darragh et al. SEP53 attenuates deoxycholate-mediated injury
FEBS Journal 273 (2006) 1930–1947 ª 2006 The Authors Journal compilation ª 2006 FEBS 1945
18 Xu Z, Wang MR, Xu X, Cai Y, Han YL, Wu KM,
Wang J, Chen BS, Wang XQ & Wu M (2000) Novel
human esophagus-specific gene c1orf10: cDNA cloning,
gene structure, and frequent loss of expression in
esophageal cancer. Genomics 69, 322–330.
19 Lechler T & Fuchs E (2005) Asymmetric cell divisions
promote stratification and differentiation of mammalian
skin. Nature 437, 275–280.
20 Kimchi ET, Posner MC, Park JO, Darga TE, Kocher-
ginsky M, Karrison T, Hart J, Smith KD, Mezhir JJ,
Weichselbaum RR et al. (2005) Progression of Barrett’s
metaplasia to adenocarcinoma is associated with the
suppression of the transcriptional programs of epider-
mal differentiation. Cancer Res 65, 3146–3154.
21 Pohler E, Craig AL, Cotton J, Lawrie L, Dillon JF,
Ross P, Kernohan N & Hupp TR (2004) The Barrett’s
antigen anterior gradient-2 silences the p53 transcrip-
tional response to DNA damage. Mol Cell Proteomics
3, 534–547.
22 Hopwood D, Bateson MC, Milne G & Bouchier IA
(1981) Effects of bile acids and hydrogen ion on the fine
structure of oesophageal epithelium. Gut 22, 306–311.
23 Van Berge Henegouwen GP & Ruben A (1974) Quanti-
tative analysis of bile acids in serum and bile, using
gas–liquid chromatography. Clin Chim Acta 54, 249–
261.
24 Schweitzer E, Bass B, Batzri S & Harmon J (1986) Bile
acid accumulation by rabbit esophageal mucosa. Digest
Dis Sci 31, 1105–1113.
25 Zhang R, Gong J, Wang H & Wang. L (2005) Bile salts
inhibit growth and induce apoptosis of human esopha-
geal cancer cell line. World J Gastroenterol 11 , 5109–
5116.
26 Harris SL & Levine AJ (2005) The p53 pathway: posi-
tive and negative feedback loops. Oncogene 24, 2899–
2908.
27 Bunz F, Hwang PM, Torrance C, Waldman T, Zhang
Y, Dillehay L, Williams J, Lengauer C, Kinzler KW &
Vogelstein B (1999) Disruption of p53 in human cancer
cells alters the responses to therapeutic agents. J Clin
Invest 104, 263–269.
28 Leslie NR, Biondi RM, et al. (2001) Phosphoinositide-
regulated kinases and phosphoinositide phosphatases.
Chem Rev 101, 2365–2380.
29 Frame S & Cohen P (2001) GSK3 takes centre stage
more than 20 years after its discovery. Biochem J 359,
1–16.
30 Araki Y, Fujiyama Y, Andoh A, Nakamura F, Shi-
mada M, Takaya H & Bamba T (2001) Hydrophilic
and hydrophobic bile acids exhibit different cytotoxici-
ties through cytolysis, interleukin-8 synthesis and apop-
tosis in the intestinal epithelial cell lines. IEC-6 and
Caco-2 cells. Scand J Gastroenterol 36, 533–539.
31 Casson AG, Tammemagi M, Eskandarian S, Redston M,
McLaughlin J & Ozcelik H (1998) p53 alterations in
oesophageal cancer: association with clinicopathological
features, risk factors, and survival. Mol Pathol 51, 71–79.
32 Hirata H, Machado LS, Okuno CS, Brasolin A, Lopes
GS & Smaili SS (2006) Apoptotic effect of ethanol is
potentiated by caffeine-induced calcium release in rat
astrocytes. Neurosci Lett 393, 136–140.
33 Michalak M, Robert Parker JM & Opas M (2002)
Ca
2+
signaling and calcium binding chaperones of the
endoplasmic reticulum. Cell Calcium 32, 269–278.
34 Ross PE, Pennington CR & Bouchier IA (1977) Gas–
liquid chromatographic assay of serum bile acids. Anal
Biochem 80, 458–465.
35 Freshney R (1987) Culture of Animal Cells; A Manual
of Basic Technique. 4th edn. Wiley-Liss, New York.
36 Achison M & Hupp TR (2003) Hypoxia attenuates the
p53 response to cellular damage. Oncogene 22, 3431–
3440.
37 Loffler BM & Kunze H (1989) Refinement of the Coo-
massie brilliant blue G assay for quantitative protein
determination. Anal Biochem 177, 100–102.
38 Westerheide SD & Morimoto RI (2005) Heat shock
response modulators as therapeutic tools for diseases of
protein conformation. J Biol Chem 280, 33097–33100.
39 Singh AK & Lakhotia SC (2000) Tissue-specific varia-
tions in the induction of Hsp70 and Hsp64 by heat
shock in insects. Cell Stress Chaperones 5, 90–97.
40 Zhang Y, Huang L, Zhang J, Moskophidis D & Mive-
chi NF (2002) Targeted disruption of hsf1 leads to lack
of thermotolerance and defines tissue-specific regulation
for stress-inducible Hsp molecular chaperones. J Cell
Biochem 86, 376–393.
41 Wang G, Zhang J, Moskophidis D & Mivechi NF
(2003) Targeted disruption of the heat shock transcrip-
tion factor (hsf)-2 gene results in increased embryonic
lethality, neuronal defects, and reduced spermatogenesis.
Genesis 36, 48–61.
42 Min JN, Zhang Y, Moskophidis D & Mivechi NF
(2004) Unique contribution of heat shock transcription
factor 4 in ocular lens development and fiber cell differ-
entiation. Genesis 40, 205–217.
43 Hu Y, Metzler B & Xu Q (1997) Discordant
activation of stress-activated protein kinases or c-Jun
NH
2
-terminal protein kinases in tissues of heat-stressed
mice. J Biol Chem 272, 9113–9119.
44 Lakhotia SC & Singh BN (1996) Synthesis of a ubiqui-
tously present new HSP60 family protein is enhanced by
heat shock only in the Malpighian tubules of Droso-
phila. Experientia 52, 751–756.
45 Kojima K, Musch MW, Ropeleski MJ, Boone DL, Ma
A & Chang EB (2004) Escherichia coli LPS induces heat
shock protein 25 in intestinal epithelial cells through
MAP kinase activation. Am J Physiol Gastrointest Liver
Physiol 286, G645–G652.
46 Kojima K, Musch MW, Ren H, Boone DL, Hendrick-
son BA, Ma A & Chang EB (2003) Enteric flora and
SEP53 attenuates deoxycholate-mediated injury J. Darragh et al.
1946 FEBS Journal 273 (2006) 1930–1947 ª 2006 The Authors Journal compilation ª 2006 FEBS
lymphocyte-derived cytokines determine expression of
heat shock proteins in mouse colonic epithelial cells.
Gastroenterology 124, 1395–1407.
47 Ramaglia V, Harapa GM, White N & Buck LT (2004)
Bacterial infection and tissue-specific Hsp72–73 and -90
expression in western painted turtles. Comp Biochem
Physiol C Toxicol Pharmacol 138, 139–148.
48 Piano A, Valbonesi P & Fabbri E (2004) Expression of
cytoprotective proteins, heat shock protein 70 and
metallothioneins, in tissues of Ostrea edulis exposed to
heat and heavy metals. Cell Stress Chaperones 9, 134–
142.
49 Neckers L & Lee YS (2003) Cancer: the rules of attrac-
tion. Nature 425, 357–359.
50 Mosser DD & Morimoto RI (2004) Molecular chaper-
ones and the stress of oncogenesis. Oncogene 23, 2907–
2918.
51 Ciocca DR & Calderwood SK (2005) Heat shock proteins
in cancer: diagnostic, prognostic, predictive, and treat-
ment implications. Cell Stress Chaperones 10, 86–103.
52 Kamal A, Thao L, Sensintaffar J, Zhang L, Boehm
MF, Fritz LC & Burrows FJ (2003) A high-affinity con-
formation of Hsp90 confers tumour selectivity on
Hsp90 inhibitors. Nature 425, 407–410.
53 Contzler R, Favre B, Huber M & Hohl D (2005)
Cornulin, a new member of the ‘fused gene’ family, is
expressed during epidermal differentiation. J Invest
Dermatol 124, 990–997.
J. Darragh et al. SEP53 attenuates deoxycholate-mediated injury
FEBS Journal 273 (2006) 1930–1947 ª 2006 The Authors Journal compilation ª 2006 FEBS 1947