Psychological Science: Attention and the Evolution of Hollywood Film docx
Bạn đang xem bản rút gọn của tài liệu. Xem và tải ngay bản đầy đủ của tài liệu tại đây (700.75 KB, 9 trang )
/>
Psychological Science
/>The online version of this article can be found at:
DOI: 10.1177/0956797610361679
published online 5 February 2010Psychological Science
James E. Cutting, Jordan E. DeLong and Christine E. Nothelfer
Attention and the Evolution of Hollywood Film
Published by:
On behalf of:
Association for Psychological Science
can be found at:Psychological ScienceAdditional services and information for
rial
Mate
ntal
leme
Supp
/>
Alerts:
by James Cutting on February 10, 2010pss.sagepub.comDownloaded from
Psychological Science
XX(X) 1 –8
© The Author(s) 2010
Reprints and permission: http://www
.sagepub.com/journalsPermissions.nav
DOI: 10.1177/0956797610361679
What grabs people’s attention? This question has been central
to psychological research for a long time (James, 1890; Luck
& Vecera, 2002), and answers are myriad. Once observers’
attention is grabbed, can they hold it there? Studies of vigi-
lance show that they generally cannot (Parasuraman, 1986).
Attention vacillates. As James (1890) noted: “There is no such
thing as voluntary attention sustained for more than a few sec-
onds at a time” (p. 421). People’s minds wander.
The study of minds’ restlessness (Smallwood & Schooler,
2006) has never been mainstream in empirical psychology. To
be sure, Verplanck, Collier, and Cotton (1952) demonstrated
attentional fluctuations during a psychophysical task, and
Antrobus (1968) showed that performance generally improved
in signal detection as presentation rate increased, a finding
implying less mind wandering at faster rates. But attentional
fluctuations generated little interest. To gain interest, the wax-
ing and waning of attention and performance needed a new
measurement tool and a snappy result allied with the harder
sciences. These were provided by Gilden, Thornton, and Mal-
lon (1995), who analyzed reaction times as a fluctuating time
series and found what is referred to as a 1/f pattern, in which
power is inversely related to frequency. Gilden (2001) sug-
gested that the ebb and flow of reaction time performance is
caused by cognitive effects that vary at different time scales,
creating the 1/f structure.
1
In engineering, physics, biology, economics, and now per-
haps psychology, 1/f patterns are ubiquitous. Their structure,
however, is sometimes opaque to intuition. Consider the varia-
tion in a complex, one-dimensional signal across time or
space. This signal can be analyzed by Fourier analysis, which
decomposes it into sine waves of different frequencies, ampli-
tudes, and phases. The potential patterns in the relations among
the frequencies and amplitudes create a family of “noises,”
some of whose members occur commonly in nature. These are
often called white, brown, and pink noise, and all are defined
by the relation between the frequency and power (proportional
to the square of the amplitude) of their components. By con-
vention, log frequency is plotted against log power, creating a
spectrum. In such plots, white (1/f
0
) noise has a flat spectrum,
with equal power at all frequencies. Brown (1/f
-2
) noise, named
after Brownian motion, has power that falls linearly and
steeply with increasing frequency. Pink (1/f
1
= 1/f ) noise is
intermediate, with power falling linearly and inversely propor-
tionally to frequency. Together, brown, pink, and other non-
white spectra are often called colored noises.
For our purposes, 1/f structure can be thought of as a pattern
of waves that course through a temporal signal and are inde-
pendent in phase. The “height” of each component wave var-
ies inversely with frequency (1/f ) and directly with wavelength
Corresponding Author:
James E. Cutting, Department of Psychology, Uris Hall, Cornell University,
Ithaca, NY 14853-7601
E-mail:
Attention and the Evolution
of Hollywood Film
James E. Cutting
1
, Jordan E. DeLong
1
, and Christine E. Nothelfer
2
1
Cornell University and
2
University of California, Berkeley
Abstract
Reaction times exhibit a spectral patterning known as 1/f, and these patterns can be thought of as reflecting time-varying
changes in attention. We investigated the shot structure of Hollywood films to determine if these same patterns are found. We
parsed 150 films with release dates from 1935 to 2005 into their sequences of shots and then analyzed the pattern of shot
lengths in each film. Autoregressive and power analyses showed that, across that span of 70 years, shots became increasingly
more correlated in length with their neighbors and created power spectra approaching 1/f. We suggest, as have others, that
1/f patterns reflect world structure and mental process. Moreover, a 1/f temporal shot structure may help harness observers’
attention to the narrative of a film.
Keywords
attention, cinema, film, visual momentum, 1/f
Received 4/7/09; Revision accepted 7/10/09
Research Article
Psychological Science OnlineFirst, published on February 5, 2010 as doi:10.1177/0956797610361679
by James Cutting on February 10, 2010pss.sagepub.comDownloaded from
2 Cutting et al.
(λ). That is, small fast waves are accompanied by other waves
that grow larger as they increase in wavelength. If the wave-
length is doubled (or the frequency halved), the power is
doubled.
The causes for 1/f patterns across the sciences are unclear,
but it is now increasingly accepted that there are many such
causes (Newman, 2005). In vision, Field (1987) found 1/f
spectra in natural scenes, and Graham and Field (2007) found
them in artworks. These results reflect the structure of the
human visual system. Again, Gilden et al. (1995)—as well as
Pressing and Jolley-Rogers (1997) and Van Orden, Holden,
and Turvey (2003)—found 1/f spectra in reaction times, and
Monto, Palva, Voipio, and Palva (2008) found evidence for
their neurological underpinnings. These results seem to
reflect the organization and structure of the human mind.
Hollywood film might seem far removed from, and not
amenable to, this kind of analysis, but we thought not. The 1/f
temporal patterning has been found in speech and music (Voss
& Clarke, 1975), so film seemed to be another good place to
look. Further, we thought we might be able to trace its evolu-
tion in film.
On Film and Theory
Film is the only major art form to have begun and matured
within the past 125 years. This fact allows exploration of its
evolution in ways not possible in other arts. Indeed, consider-
able scholarship has documented changes from the earliest
films and their short, episodic displays of sneezes, dances, and
boxing; to slightly longer films with modest story structure
after 1900; through the soundless works of Griffith, Chaplin,
Keaton, and other directors into the 1920s; to the first feature
films with sound after 1927; to film adaptations of books, plays,
and musicals; and later to film noir, the new wave, the movie
brats, and digital cinema (e.g., Bordwell, 2006; Bordwell,
Staiger, & Thompson, 1985; Salt, 1992, 2006).
Twentieth-century film theory was dominated by psycho-
analytic, Marxist, and feminist approaches. Cognitive film
theory, which has focused on linkages between the mind and
physical attributes of film, has been less well established (but
see Anderson, 1996; Carroll & Bever, 1976; Hochberg &
Brooks, 1978b; Smith, 2006). Our approach is very much in
this vein, and falls under the rubric of cinemetrics. Here, we
focus on films in Hollywood style, also called invisible style
(Bordwell et al., 1985; Messaris, 1994). This style—differing
from those of documentaries, TV newscasts, sitcoms, music
videos, and most of what is called art film—is designed to sup-
press awareness of the presentational aspects of the film while
promoting the narrative.
The units of film are the act, the sequence, the scene, the
shot, and the single frame. A film typically has four acts of more
or less equal length, and their narrative structure has a long his-
tory in guides to writing screenplays (Thompson, 1999). A
scene is a series of shots depicting a given time and place, but
sometimes scenes move continuously through space and time,
creating larger units called sequences (as in chase sequences).
Shots are continuous runs of frames from a particular point of
view of the camera; they are separated by transitions of various
kinds—cuts, dissolves, fades, wipes, and others. Cuts—abrupt
discontinuities from one frame to the next—make up more than
99% of transitions in contemporary film.
Our unit of investigation was the shot. Shots are the small-
est film units to which viewers are asked to direct their atten-
tion. Shot form is sculpted by directors, cinematographers, and
film editors. The purpose of that form is to control the viewer’s
eye fixations and attention, and filmmakers do this fairly well
(Smith, 2006). Shot relations are sculpted by the film editor to
promote the narrative (Dmytryk, 1984; Ondaatje, 2004), and
these relations create in the viewer what Hochberg and Brooks
(1978a, 1978b) called visual momentum, the impetus to gather
visual information. In other words, the rhythm of shot
sequences in film is designed to drive the rhythm of attention
and information uptake in the viewer. Perhaps the success of
these rhythms reflects what Kael (1965) meant by “losing it”
at the movies.
Film Choice, Shot Parsing, and Analysis
We chose 150 films, 10 released in each of 15 years, every 5
years from 1935 to 2005. The Supplemental Material available
on-line provides the complete list. Assembled from information
in several on-line databases, the films from 1980 onward were
among the highest grossing of their year and the earlier films
were among those with the largest number of viewer ratings on
the Internet Movie Database (IMDb; ). The
films were also chosen, as best we could, to represent five
genres—action, adventure, animation, comedy, and drama—
although their distribution could not be uniform because of
vagaries in Hollywood production and changes in social milieu
and viewers’ taste. Genres were defined by the first-designated
category for each film on the IMDb. After selection, films were
manipulated from files in *.avi format stripped of their audio
track. Each frame was stored as a 256- × 256-pixel jpeg file.
Excluding all trailing credits and beginning credits without sce-
nic content, the mean film length was 114 min (SD = 26 min),
entailing a mean of about 165,000 jpeg files.
We needed to divide the films into shots, but we were unim-
pressed with purely digital methods. Cut-finding algorithms
often confuse motion across frames within a shot with spatial
discontinuities across shots. They also do poorly with fades,
dissolves, and wipes, which are common in films made before
1960 (Carey, 1974). Over, Ianeva, Kraaij, and Smeaton (2007)
noted that the best cut-detection algorithms have hit and false
alarm rates of about 95% and 5%, respectively (d′ ~ 3.3), and
the best dissolve detectors have corresponding rates of about
80% and 20% (d′ ~ 1.7). Such performance was inadequate for
our purposes, so we devised a three-stage MATLAB-based
(MathWorks, Natick, MA) system.
The first stage found candidate cuts and other transitions by
tracking frame-to-frame changes in histograms of luminance
by James Cutting on February 10, 2010pss.sagepub.comDownloaded from
Attention and Hollywood Films 3
values within 64 cells (in an 8 × 8 array, each cell with 32 × 32
pixels). It also found candidate dissolves and fades by tracking
monotonicity of changes in those cells across traveling win-
dows of 12 frames. For each candidate transition, the second
stage presented the user with an array of six static images—six
images before and after a candidate cut or six images during a
candidate dissolve, fade, or wipe. The user then accepted or
rejected the candidate, and the process continued with the next.
If the user felt that content of the six images was discontinuous
from one candidate transition to the next, he or she flagged the
region. The third stage allowed the user to inspect these flagged
regions for possible missed transitions. With this interface, we
obtained a hit rate of 99.6% and a false alarm rate of 0.2% (d′ ~
5.5), using the frame-by-frame analysis of two films (The
Revenge of the Sith, 2005; Spies Like Us, 1985) as our criterion.
The number of shots per film ranged from 231 (Seven Year
Itch, 1950) to 3,099 (King Kong, 2005), with a mean of 1,132.
Counting machine and operator time, this process—going from
*.avi to jpeg files, finding candidate transitions, and verifying
them—took from about 15 to 36 hr per film.
In the psychological literature on time series analysis, there
is a debate over whether local (autoregressive) or global (1/f )
models better capture structure in data (e.g., Farrell, Wagen-
makers, & Ratcliff, 2006; Thornton & Gilden, 2005). Thus, we
chose to investigate both models, although, as we demonstrate,
they are closely related. Shot lengths were analyzed using par-
tial autocorrelation and power analyses, which allowed us to
look for local patterns (shot-to-shot relations) and global pat-
terns (whole-film editing profiles), respectively. Schils and de
Haan (1993) performed a similar local analysis on sentence
lengths in texts, and Salt (2006, p. 396) provided some piece-
meal, local analyses of a number of films. In addition, Richards,
Wilson, and Sommer (1994, Experiment 4) analyzed portions of
four films in a manner related to our global analysis.
Results and Preliminary Discussion
Relations measured locally
Autoregressive analysis allows one to inspect the relations
among a given set of shots, beginning with adjacent shots and
then expanding to increasingly distal shots. We use the term
Shot 0 to refer to a shot of focal interest; every shot up to near
the film’s end was analyzed as Shot 0. The autocorrelation of
the length of a Shot 0 with itself (Lag 0) is always 1.0; autocor-
relations of the length of Shot 0 with the lengths of Shots 1
(Lag 1) and more distal shots are of more interest. The correla-
tion of Shots 0 and 1, r
01
, was the first value inspected. If it
was statistically reliable—greater than a positive bound (2/√n,
where n is the number of shots)—we then considered the cor-
relation between Shots 0 and 2 with intermediate effects
involving Shot 1 partialed out, r
02.1
. Reliable correlations r
01
and r
02.1
support an autoregressive model called AR(2) (Box,
Jenkins, & Reinsel, 2008; Chatfield, 2004). For descriptive
purposes, we considered every incremental positive partial
correlation as long as previous values remained positive and
above criterion. In this context, reliable correlations r
03.12
, r
02.1
,
and r
01
support an AR(3) model. In our database, Rocky IV
(1985) exhibited the most distal relations. Partial correlations
for Shots 0 through 7, r
07.123456
and its kin, suggested an AR(7)
model for that film.
The lag-incremented, reliable partial autocorrelations for
all films were determined. This analysis yielded 150 cardinal-
valued AR indices. Those indices were correlated with release
years, r = .44, t(148) = 6.01, p < .0001, 95% confidence interval
(CI) = [.27, .54]. However, there can be much noise in partial-
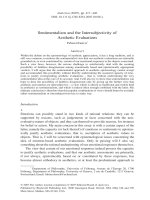
autocorrelation functions, as Figure 1 shows, and films with
fewer shots are penalized; their bounds are higher, which tends
to generate smaller AR indices. Thus, we fit each function out
to Lag 20 with a negative exponential function (1/[lag + 1]
β
;
average root-mean-squared deviation = .043, SD = .006) and
then assessed its intercept with a positive bound (.065) based
on the mean number of shots in all films. This procedure
yielded a continuous rather than discrete autoregressive index;
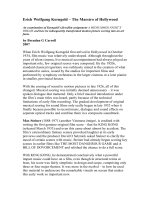
the values of this index are shown in Figure 2a. The correlation
of this new index with release year was reliable, r = .43, t(148) =
5.89, p < .0001. The best, median, and worst of the 150 fits to
the negative exponential function are shown in Figure 1. The
increase across years that is evident in Figure 2a is not an arti-
fact of decreases in mean shot length in films over this span of
time (Bordwell, 2006; Bordwell et al., 1985; Salt, 1992, 2006).
When shot durations for each film were log-transformed and
the autoregressive analyses repeated, the correlation remained
essentially unchanged, r = .45.
These results suggest that Hollywood film has become
increasingly clustered in packets of shots of similar length. For
example, action sequences are typically a cluster of relatively
short shots, whereas dialogue sequences (with alternating
shots and reverse-shots focused sequentially on the speakers)
are likely to be a cluster of longer shots. In this manner and
others, film editors and directors have incrementally increased
their control over the visual momentum of their narratives,
making the relations among shot lengths more coherent over a
70-year span.
Figure 2b shows the pattern of these correlations for five
genres of film—action, adventure, animation, comedy, and
drama. Clearly, the action film, which has grown more popular
in recent decades, is the leader in showing this increasing pat-
tern of coherence. Nonetheless, selected individual films from
other genres also show relatively large modified autocorrela-
tion indices—Popeye (1980), comedy: 3.64; Five Easy Pieces
(1970), drama: 3.38; Swiss Family Robinson (1960), adven-
ture: 4.22; Anchors Aweigh (1945), comedy: 3.76; Santa Fe
Trail (1940), drama: 4.65. (See the Supplemental Material for
results for the other films.)
Relations measured globally
Gilden et al. (1995; see also Gilden, 2001) noted that cognitive
emissions of 1/f noise are blended with white noise and devised
by James Cutting on February 10, 2010pss.sagepub.comDownloaded from
4 Cutting et al.
a model to treat data as a mixture of the two. Here, we follow this
lead and focus on the colored-noise component of films; we
found no systematic differences for white-noise components
across years or genres. After transforming shot lengths in each
film to a unit normal distribution (M = 0, SD = 1), we adapted
Gilden’s analyses to the shot sequence. Composite power spec-
tra (see Thornton & Gilden, 2005, Appendix A) are best calcu-
lated within traveling windows whose lengths are powers of 2.
Given the variability in Fourier calculations, we followed a con-
servative procedure: For each film, we determined the integer n
such that the number of shots was between 2
n
and 2
n+1
and then
carried out power analyses for traveling-window lengths up to
2
n–1
. Thus, for a film of 1,500 shots (between 1,024 and 2,048,
2
10
and 2
11
), we calculated power in windows up to 512 (2
9
)
shots. The hybrid model of 1/f
α
and white noise was then fit to
the composite spectrum of each film, and the slope (α) of the
colored noise determined. Model fits to the 150 power spectra
were generally good (average root-mean-squared deviation =
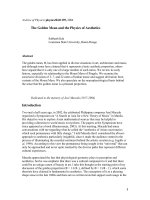
.08, SD = .05). Figure 3 shows examples of good and poorer fits
to films at three different general slope values.
Notice that for The Revenge of the Sith (2005), the curvilin-
ear spectrum is relatively flat in the range of 2 to 4 shots (out
to a window of about 15 s for that film), which suggests that
white noise is dominant in that range. For Die Hard 2 (1990),
this flatter part of the curved spectrum (and white-noise domi-
nance) extends out to the range of 32 shots (a window of about
100 s for that film). White noise is less apparent, but by no
means absent, in the other four films. Curvilinearity becomes
salient only at steeper slopes, and it is also seen in reaction
time data (Gilden & Hancock, 2007), in which the window of
white-noise dominance is determined partly by the intertrial
interval (see also Antrobus, 1968).
The slopes for all 150 films are shown in Figure 2c. Disper-
sion is again considerable, but slopes steepened linearly from
1935 to 2005, r = .19, p < .01, 95% CI = [–.03, .31]. Nonethe-
less, a first-order polynomial fits the data modestly better, r =
.28, p < .0002. Interestingly, among our films, four films noir
(Detour, 1945; Mildred Pierce, 1945; Asphalt Jungle, 1950;
Sunset Boulevard, 1950) have a mean slope of only 0.09,
which suggests no pattern in the composition of shot lengths.
Among other related films that might be of general interest,
the six Alfred Hitchcock films (The 39 Steps, 1935; Foreign
Correspondent, 1940; Rebecca, 1940; Spellbound, 1945; The
Trouble with Harry, 1955; and To Catch a Thief, 1955) have a
mean slope of 0.53; the two James Bond films have slopes of
0.41 (Thunderball, 1965) and 0.82 (GoldenEye, 1995); and the
two Star Wars films have slopes of 0.98 (The Empire Strikes
Back, 1980) and 1.14 (The Revenge of the Sith, 2005). (Again,
see the Supplemental Material for results for the other films.)
Figure 2d shows the slopes by genre and exhibits a pattern
similar to that for the modified autoregressive indices (Fig.
2b). Action films have the steepest mean slope (closest to 1/f ),
followed by adventure, animation, comedy, and drama films.
However, some individual non-action films have slopes
approaching 1/f—The Perfect Storm (2000), adventure: 0.90;
Pretty Woman (1990), comedy: 0.92; Rebel Without a Cause
(1955), drama: 0.88; Cinderella (1950), animation: 0.95; The
39 Steps (1935), drama: 0.93.
Finally, given that autoregression and power analysis are
related (the Fourier transform of the autocorrelation function
.5
.4
Partial Autocorrelation
.3
.2
.1
.0
0 5 10
RMSD = .017
AR Index = 4.59
RMSD = .043
AR Index = 2.47
King Kong
(2005)
15 20 0 5 10
Lag
Ordinary People
(1980)
RMSD = .06
AR Index = 0.41
Detour
(1945)
15 20 0 5 10 15 20
Fig. 1. Raw partial autocorrelations of three films as a function of lag (the ordinal distance between shots whose lengths are being
compared). The thick lines represent the fits of a negative exponential function (1/[lag + 1]
β
); that for Detour is thrust up against the ordinate
and so cannot be seen. From left to right, the panels show results for films with the best, median, and worst fits across the 150 films. The
ordinate is truncated because the Lag 0 value of 1.0 is uninformative. Gray areas indicate 95% confidence intervals around the best fit,
determined by bootstrap. The additional tick marks on the ordinate indicate the upper bound of significant partial correlations; the thick
mark is based on the mean number of shots across all films, and the thin one is based on the number of shots in the given film. Our modified
autoregressive index (AR index) for each film (see Figs. 2a and 2b) was determined by the intersection of the exponential function and the
mean upper bound for all films. RMSD is the root-mean-squared deviation between the fitted function and the raw data.
by James Cutting on February 10, 2010pss.sagepub.comDownloaded from
Attention and Hollywood Films 5
is the power spectrum), one would expect the modified autore-
gressive indices and slopes to be correlated. Indeed, they are
(r = .52). However, for films with steep slopes, the local effects
are buried in the white-noise-dominated end of the spectrum.
Our interest resides more strongly in the 1/f pattern because of
its possible connection with the structure of attention.
General Discussion
Our results suggest two new ways to look at cinema. First, the
history of Hollywood film is often parsed into a classical
period before 1960 and a postclassical period thereafter (e.g.,
Bordwell et al., 1985). Bordwell (2006) was careful to trace
continuities across those periods, and the linear fit to the modi-
fied autoregression results here (Fig. 2a) supports this idea.
However, a first-order polynomial fit of the power slopes (Fig.
2c) suggests that 1955 to 1970 was the nadir of whole-film
shot organization, with the films of 1935 and 1940 having
somewhat greater and more varied slopes, and only those after
1980 generally approaching a 1/f profile.
Second, film theorists have noted that physical attributes of
film have evolved, but although some have stated that shot
lengths have gotten shorter, none have suggested a continuing
direction for change. We suggest that over the next 50 years or
6
a b
c d
Modified Autoregressive Index
AdventureRelease Year Comedy
Slope (α in 1/ƒ
α
)
5
4
31
*
*
*
*
*
*
20 10 41 48
= n
3
2
1
0
1.2
1.0
0.8
0.6
0.4
0.2
0.0
1930 1950 1970 1990 2010
Action Animation Drama
Fig. 2. Results of the local (top row) and global (bottom row) analyses. The scatter plots present (a) autoregressive indices and (c) slopes of the power
spectra for shot sequences as a function of release year. The box plots present (b) autoregressive indices and (d) slopes of the power spectra for shot
sequences as a function of genre. A linear fit is shown for the autoregressive data in (a), and a first-order polynomial fit is shown for the slope data in
(c). Gray areas indicate 95% confidence intervals for the regression lines as determined by bootstrap; the regression lines are the 50% percentile of
regression fits after bootstrap. In the box plots (b and d), the gap and circle represent the median and the mean, respectively, for each genre. Each two-
part box represents the interquartile range; the whiskers indicate the entire range, unless there are outliers (> 1.5 × interquartile range—here, above
the third quartile), which are indicated by asterisks. Horizontal brackets span genres that are not statistically different from one another (no correction
for multiple comparisons). See the text for explanations of the modified autoregressive index and the slope index.
by James Cutting on February 10, 2010pss.sagepub.comDownloaded from
6 Cutting et al.
so, and with action films likely leading the way, Hollywood
film will evolve toward a shot structure that more generally
matches the 1/f patterns found elsewhere in physics, biology,
culture, and the mind.
Some caveats are in order. First, given our results, one
might assume that viewers like better those films with a shot
structure closer to a 1/f pattern. However, this is not the case.
Many viewers (M ~ 3 × 10
4
, maximum ~ 2 × 10
5
, and mini-
mum ~ 10
2
, as assessed on February 28, 2009) rated these 150
films on the IMDb, and their ratings do not correlate with film
slopes (r = –.089, n.s.).
2
There are likely many reasons for this,
but we think they converge on two facts: (a) Our data are not
about film narratives, but rather are about the presentation of
film narratives, and (b) film narratives can be presented in
many ways. This study collapsed across the work of more than
500 different directors, cinematographers, and film editors, all
with their particular styles, preferences, and skills. This leads
to our second caveat: In no way do we claim that there is any
intention on the part of filmmakers to develop a 1/f film style,
even if they knew what that might be. Instead, we claim that,
as explorations and crafting of film have proceeded for at least
70 years, film narrative has fallen naturally into 1/f shot struc-
ture as the myriad of other considerations in filmmaking have
played against each other in shaping film form. Good story-
telling is the balancing of constraints at multiple scales of pre-
sentation. Thus, we view 1/f film form as an emergent,
self-organizing structure (Gilden, 2001; Van Orden et al.,
2003), not as an intentional one.
How might 1/f shot patterns entrain attention over periods of
1 to 3 hr? Current theories of attention provide little guidance.
Most concern instants, not longer stretches of time. Accounts
of mind wandering offer some help. Mind wanderings can be
viewed as lapses of executive control as unrelated stimuli
(external and internal) compete for attentional resources
The Revenge of
the Sith (2005)
Urban Cowboy
(1980)
Airplane!
(1980)
1.2
0.6
0.0
Log Power
Traveling-Window Width in Shots (1/Frequency)
1,024 128 16 2 128 16 2 128 16 2
−0.6
−1.2
α = 1.14
RMSD = .06
α = 0.45
RMSD = .03
α = 0.20
RMSD = .06
Die Hard 2
(1990)
Thunderball
(1965)
Mister Roberts
(1955)
1.2
0.6
0.0
1,024 128 16 2 128 16 2 128 16 2
−0.6
−1.2
α = 1.06
RMSD = .09
α = 0.43
RMSD = .07
α = 0.002
RMSD = .13
Fig. 3. Log-power as a function of width of the traveling window in six films. The thick lines indicate the fits
of 1/f
α
and white noise to the composite power spectra. The six examples illustrate good (upper panels)
and poorer (lower panels) fits at slopes (α) near 1.0 (left panels), near 0.5 (middle panels), and near 0.0
(right panels). Gray areas represent the interquartile confidence intervals as determined by bootstrap.
Traveling-window width is the size of the successive, maximally overlapping windows within which Fourier
analysis was done before mean power was computed for each point in the composite spectrum. The slope
of the fitted function was used to index each film, as shown in Figure 2. RMSD is the root-mean-squared-
deviation between the fitted function and the raw data.
by James Cutting on February 10, 2010pss.sagepub.comDownloaded from
Attention and Hollywood Films 7
(Smallwood & Schooler, 2006). Such vacillations will be mini-
mal when information load is high and will increase when
information load is lowered (Antrobus, 1968). But is the task of
the filmmaker solely to keep information flow and visual
momentum (visual information uptake) sufficiently high to
ward off the mind’s natural restlessness? Not likely. Otherwise,
all films would be composed of unremittingly short shots.
3
Instead, it seems more likely that a temporally scaled theory of
attention should be linked, as Gilden (2001) suggested, to a
view that the mind is a complex system with interrelated parts
that interact over multiple scales of time—milliseconds, sec-
onds, minutes, hours, and intervals in between. As such sys-
tems operate, they have a tendency to produce 1/f patterns.
In conclusion, the endogenous wavering of attention has a
1/f temporal structure (mixed with white noise; Gilden, 2001).
In addition, film shots are designed to capture and focus atten-
tion (Smith, 2006), and film editors design shot patterns with
care, generating a visual momentum in the viewer, who tracks
the narrative. This study has now demonstrated that the shot
structure in film has been evolving toward 1/f spectra (again,
mixed with white noise). Thus, we suggest that the mind can
be “lost” (Kael, 1965) most easily in a temporal art form with
that structure. That is, setting the actual narrative aside, per-
haps being engrossed in a film is, in part, to allow its 1/f tem-
poral structure to drive the mind exogenously.
Acknowledgments
An earlier version of this project based on 12 films appeared as
Nothelfer, DeLong, and Cutting (2009). We thank David Field for
discussions of power spectra, David Gilden for help in fitting models
to them, and Kat Agres, Mark Albert, Kaitlin Brunick, Claudia
Gilson, James Golden, Dan Graham, Catalina Iricinschi, Jakub
Limanowski, Pablina Roth, Noam Schaap, and Sherry Xian for dis-
cussion of this project.
Declaration of Conflicting Interests
The authors declared that they had no conflicts of interest with
respect to their authorship or the publication of this article.
Funding
This research was supported, in part, by a Sage Fellowship from
Cornell University to J.E.D. and a Leadership Alliance summer
internship from Cornell University to C.E.N.
Supplemental Material
Additional supporting information may be found at epub
.com/content/by/supplemental-data
Notes
1. When discussing cognitive emissions of a 1/f signal, Gilden (2001)
focused on memory and interference. Without denying their impor-
tance in this context, we choose to focus on attention. Interference
and facilitation from past events have equal play in the domains of
memory and attention (e.g., Cowan, 1995).
2. This is a partial correlation with release year of the film factored
out. Older films, perhaps because some are regarded as “classics,”
tend to have higher ratings, r = –.37. The simple correlation between
slope and rating is –.14.
3. In an early scene in Wedding Crashers (2005), shots are synchro-
nized to the rhythm of a remix of the Isley Brothers’ song “Shout.”
For a 90-s stretch, each shot is about 1-s long. The sequence is amus-
ing, even riveting, but clearly could not be sustained.
References
Anderson, J.D. (1996). The reality of illusion: An ecological approach
to cognitive film theory. Carbondale: Southern Illinois University
Press.
Antrobus, J.S. (1968). Information theory and stimulus-dependent-
thought. British Journal of Psychology, 59, 423–430.
Bordwell, D. (2006). The way Hollywood tells it. Berkeley: Univer-
sity of California Press.
Bordwell, D., Staiger, J., & Thompson, K. (1985). The classical Hol-
lywood cinema: Film style & mode of production to 1960. New
York: Columbia University Press.
Box, G.E.P., Jenkins, G.M., & Reinsel, G.C. (2008). Time series
analysis: Forecasting and control (4th ed.). Hoboken, NJ: Wiley.
Carey, J. (1974). Temporal and spatial transitions in American fiction
films. Studies in the Anthropology of Visual Communication, 1,
45–50.
Carroll, J.M., & Bever, T.G. (1976). Segmentation in cinema percep-
tion. Science, 191, 1053–1056.
Chatfield, C. (2004). The analysis of time series (6th ed.). Boca
Raton, FL: Chapman & Hall/CRC.
Cowan, N. (1995). Attention and memory: An integrated framework.
New York: Oxford University Press.
Dmytryk, E. (1984). On film editing. Boston: Focal Press.
Farrell, S., Wagenmakers, E J., & Ratcliff, R. (2006). 1/f noise in
human cognition: Is it ubiquitous, and what does it mean? Psy-
chonomic Bulletin & Review, 13, 737–741.
Field, D.J. (1987). Relations between the statistics of natural images
and the response properties of cortical cells. Journal of the Opti-
cal Society of America A, 4, 2379–2394.
Gilden, D.L. (2001). Cognitive emission of 1/f noise. Psychological
Review, 108, 33–56.
Gilden, D.L., & Hancock, H. (2007). Response variability in atten-
tion deficit disorders. Psychological Science, 18, 796–802.
Gilden, D.L., Thornton, T., & Mallon, M.W. (1995). 1/f noise in
human cognition. Science, 267, 1837–1839.
Graham, D.J., & Field, D.J. (2007). Statistical regularities of art
images and natural scenes: Spectra, sparseness, and nonlineari-
ties. Spatial Vision, 21, 149–164.
Hochberg, J., & Brooks, V. (1978a). Film cutting and visual momen-
tum. In J.W. Senders, D.F. Fisher, & R.A. Monty (Eds.), Eye
movements and the higher psychological functions (pp. 293–
313). Hillsdale, NJ: Erlbaum.
Hochberg, J., & Brooks, V. (1978b). The perception of motion pic-
tures. In E.C. Carterette & M.P. Friedman (Eds.), Handbook of
perception: Vol. 10. Cognitive ecology (pp. 259–304). New York:
Academic Press.
by James Cutting on February 10, 2010pss.sagepub.comDownloaded from
8 Cutting et al.
James, W. (1890). The principles of psychology (Vol. 1). New York: Holt.
Kael, P. (1965). I lost it at the movies. Boston: Little, Brown.
Luck, S.J., & Vecera, S.P. (2002). Attention. In H. Pashler & S. Yantis
(Eds.), Stevens’ handbook of experimental psychology (3rd ed.,
Vol. 1, pp. 235–286). New York: Wiley.
Messaris, P. (1994). Visual literacy: Image, mind, & reality. Boulder,
CO: Westview Press.
Monto, S., Palva, S., Voipio, J., & Palva, J.M. (2008). Very slow EEG
fluctuations predict the dynamics of stimulus detection and oscilla-
tion amplitudes in humans. Journal of Neuroscience, 28, 8268–8272.
Newman, M.E.J. (2005). Power laws, Pareto distributions, and Zipf’s
law. Contemporary Physics, 46, 323–351.
Nothelfer, C.E., DeLong, J.E., & Cutting, J.E. (2009). Shot structure
in Hollywood film. Indiana University Undergraduate Journal of
Cognitive Science, 4, 103–113.
Ondaatje, M. (2004). The conversations: Walter Murch and the art of
editing film. New York: Random House.
Over, P., Ianeva, T., Kraaij, W., & Smeaton, A.F. (2007). TRECVID
2006—an overview. In Proceedings of TRECVID 2006.
Retrieved December 21, 2009, from />trecvid_2006_3.pdf
Parasuraman, R. (1986). Vigilance, monitoring, and search. In B.R.
Boff, L. Kaufman, & J.P. Thomas (Eds.), Handbook of perception
and human performance (Vol. 2, chap. 43). New York: Wiley.
Pressing, J., & Jolley-Rogers, G. (1997). Spectral properties of
human cognition and skill. Biological Cybernetics, 76, 339–347.
Richards, W., Wilson, H.R., & Sommer, M.A. (1994). Chaos in per-
cepts? Biological Cybernetics, 70, 345–349.
Salt, B. (1992). Film style and technology: History and analysis (2nd
ed.). London: Starword.
Salt, B. (2006). Moving into pictures. London: Starword.
Schils, E., & de Haan, P. (1993). Characteristics of sentence length in
running text. Literary and Linguistic Computing, 8, 20–26.
Smallwood, J., & Schooler, J.W. (2006). The restless mind. Psycho-
logical Bulletin, 132, 946–958.
Smith, T.J. (2006). An attentional theory of continuity editing (Doc-
toral thesis, University of Edinburgh, Edinburgh, Scotland).
Retrieved June 25, 2009, from gspot
.com/2006/03/attentional-theory-of-continuity.html
Thompson, K. (1999). Storytelling in the new Hollywood. Cam-
bridge, MA: Harvard University Press.
Thornton, T.L., & Gilden, D.L. (2005). Provenance of correla-
tions in psychological data. Psychonomic Bulletin & Review, 12,
409–441.
Van Orden, G.C., Holden, J.G., & Turvey, M.T. (2003). Self-organi-
zation of cognitive performance. Journal of Experimental Psy-
chology: General, 152, 331–350.
Verplanck, W.S., Collier, G.H., & Cotton, J.W. (1952). Noninde-
pendence of successive responses in measurements of the visual
threshold. Journal of Experimental Psychology, 54, 273–282.
Voss, R.F., & Clarke, J. (1975). ‘1/f noise’ in music and speech.
Nature, 258, 317–318.
by James Cutting on February 10, 2010pss.sagepub.comDownloaded from