Báo cáo khoa học: Conformational heterogeneity of transmembrane residues after the Schiff base reprotonation of bacteriorhodopsin 15 docx
Bạn đang xem bản rút gọn của tài liệu. Xem và tải ngay bản đầy đủ của tài liệu tại đây (344.93 KB, 13 trang )
Conformational heterogeneity of transmembrane residues
after the Schiff base reprotonation of bacteriorhodopsin
15
N CPMAS NMR of D85N/ T170C membranes
A. James Mason
1
, George J. Turner
2
and Clemens Glaubitz
1
1 Centre for Biomolecular Magnetic Resonance and Institut fu
¨
r Biophysikalische Chemie, J.W. Goethe Universita
¨
t, Frankfurt, Germany
2 Department of Chemistry and Biochemistry, Seton Hall University, South Orange, NJ, USA
Bacteriorhodopsin [1] is a 26 kDa seven transmem-
brane helix protein (7TM) found in the extremely halo-
philic archeaon Halobacterium salinarium [2]. The
proton pumping ability of this protein is conferred by
the prosthetic retinal attached via a Schiff base to
Lys216. The light-induced isomerization from all-trans
to 13-cis causes the release of a proton from the Schiff
base, which in turn causes a proton to be released at
the extracellular surface. The reaction is cyclic and the
photocycle has been characterized spectroscopically
where a series of photointermediates have been deter-
mined:
bR
570
! K
590
! L
550
! M
412
! N
560
! O
640
! bR
570
The photocycle can be divided into two phases. The
first phase is the K-L-M
1
-M
2
-M
2
¢ sequence, where a
proton is donated from the Schiff base to Asp85 and
another proton is released to the extracellular surface,
and the second is the N-N¢-O-bR sequence, where the
Schiff base is reprotonated from Asp96. Asp96 is itself
reprotonated from the cytoplasmic surface and a pro-
ton is transferred from Asp85 to the proton release
site. Analysis of the photomechanism has been revolu-
tionized by the production of a family of high resolu-
tion X-ray diffraction structures [3,4]. The structures
and structural changes assigned to the intermediates
of reprotonation reactions remain an area of debate,
as described below.
N-state
In the early intermediates of the reprotonation phase,
when the protein is in the late M- and N-state,
contrasting measurements of the movements in the
Keywords
bacteriorhodopsin; solid-state NMR; N-state;
O-state
Correspondence
C. Glaubitz, Institut fu
¨
r Biophysikalische
Chemie, Centre for Biomolecular Magnetic
Resonance, J.W. Goethe Universita
¨
t, Marie-
Curie Str. 9, D-60439 Frankfurt, Germany
Fax: +49 69798 29929
Tel: +49 69798 29927
E-mail:
(Received 19 October 2004, revised 10
February 2005, accepted 28 February 2005)
doi:10.1111/j.1742-4658.2005.04633.x
bR, N-like and O-like intermediate states of [
15
N]methionine-labelled wild
type and D85N ⁄ T170C bacteriorhodopsin were accumulated in native
membranes by controlling the pH of the preparations.
15
N cross polariza-
tion and magic angle sample spinning (CPMAS) NMR spectroscopy
allowed resolution of seven out of nine resonances in the bR-state. It was
possible to assign some of the observed resonances by using
13
C ⁄
15
N rota-
tional echo double resonance (REDOR) NMR and Mn
2+
quenching as
well as D
2
O exchange, which helps to identify conformational changes after
the bacteriorhodopsin Schiff base reprotonation. The significant differences
in chemical shifts and linewidths detected for some of the resonances in
N- and O-like samples indicate changes in conformation, structural hetero-
geneity or altered molecular dynamics in parts of the protein.
Abbreviations
7TM, seven transmembrane helix protein; CPMAS, cross polarization and magic angle sample spinning; DA, dark adapted; LA, light adapted;
REDOR, rotational echo double resonance.
2152 FEBS Journal 272 (2005) 2152–2164 ª 2005 FEBS
cytoplasmic half of the protein have been obtained.
Large scale motions have been observed, particularly
in helices E, F and G, and the EF loop, by a variety
of techniques, including electron diffraction [5–7],
X-ray diffraction in projection of purple membranes
[8–10] and Electron Spin Resonance (ESR) spin label-
ling [11,12]. An early X-ray diffraction study of F171C
membranes [13], at 7 A
˚
resolution, observed fairly
small structural changes with the largest change invol-
ving a movement of helix F and some small move-
ments of helices B and G, whilst two electron
diffraction studies of 2D crystals observed rather large
structural changes in the cytoplasmic region. The
structure of a ‘cytoplasmically open’ conformation
found in the D96G ⁄ F171C ⁄ F219L triple mutant [6]
revealed displacements of the ends of helices F and G
of 3.5 and 2 A
˚
, respectively, while the structure of the
N intermediate found in F219L membranes [7] showed
that both helices E and F are displaced by some 3 A
˚
,
with helix G again moving slightly. These results were
in contrast, however, with high resolution structures of
the M
N
- and N¢-states [14,15], produced from 3D crys-
tals, which do not show the expected tilts or rotations
[16]. It has been suggested that, within 3D crystals, the
crystal lattice resists any increase in the unit cell
dimensions preventing such conformational changes.
O-state
The bacteriorhodopsin O-state is the least well resolved
conformer of the reprotonation mechanism. The most
recent analysis relies on the mutants D85S and
D85S ⁄ F219L as O-state models [17]. The structures of
D85S and D85S ⁄ F219L, at 2.25 and 2.0 A
˚
resolution
respectively, reveal important differences between the
bR- and O-like states [17]. The most notable differ-
ences are in the extracellular half of the protein and in
the loop regions, particularly the BC, DE and EF
loops. A slight repackaging of the transmembrane heli-
ces in the extracellular side results in tilting of the heli-
ces A, B, C and D by approximately 3° and, more
noticeably, helix E by 6.9° relative to the bR-state.
The protonation state of Asp85 plays a central role
in the conformational changes and linked proton
movements during the transitions between the M-, N-,
O- and bR-states. As illustrated in the discussion of
the O-state models, mutants of Asp85 have been useful
in the study of the reprotonation mechanism [17].
Replacement of Asp85 with asparagine (D85N) allows
study of the intermediate state conformations in which
Asp85 is normally protonated. The bR mutant D85N
exists as three spectrally distinct species in a pH-
dependent equilibrium [18]. Transitions between these
species regulate the pK
a
values of Asp96 and the Schiff
base in a manner consistent with that observed in the
reprotonation phase of the wild-type protein. At low-
to-neutral pH an O-like species predominates (k
max
¼
615 nm), whereas at higher pH values increasing levels
of an N- (k
max
¼ 570 nm) and an M-like species
(k
max
¼ 410 nm) appear [18]. D85N, and second site
mutants thereof, can be used to isolate the conforma-
tional transitions of the reprotonation phase of proton
pumping.
In this study we exploited the pH-dependent transi-
tions of the D85N ⁄ T170C double mutant to probe
the structures of N- and O-like states. Our mutant
D85N ⁄ T170C behaves similarly to D85N [18]. How-
ever, the pK
a
of M accumulation is raised by the addi-
tional cysteine mutation and hence, although some
M-state remains, it is less populated making this sys-
tem more suitable to access N-and O-like states [19].
We applied residue-specific
15
N labelling to all
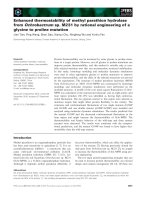
methionines in the wild type purple membrane (Fig. 1)
and D85N ⁄ T170C membrane to evaluate the conform-
ational flexibility of transmembrane helices in the bR,
163
32
20
54
56
60
68
209
208
118
145
117
Fig. 1. The three-dimensional structure of bacteriorhodopsin is
shown indicating the positions of the nine
15
N-labelled methionine
residues, present in each sample. Three
13
C-labelled residues,
[
13
C
1
]Ile117, [
13
C
1
]Phe54 and [
13
C
1
]Phe208 that form spin pairs
with labelled methionine residues 118, 56 and 209, present in two
separate samples prepared for REDOR experiments are also
shown.
RASMOL was used with coordinates 1c3w [14] from the Pro-
tein Data Bank.
A. J. Mason et al. N- and O-states of BR seen by solid-state NMR
FEBS Journal 272 (2005) 2152–2164 ª 2005 FEBS 2153
N- and O-like states. Methionines are found at resi-
dues 20, 32, 56, 60, 68, 118, 145, 163 and 209, with
only 68 and 163 located in loops and all others located
in helices A, B, D, E and G. Application of this label-
ling scheme in combination with cross polarization
and magic angle sample spinning (CPMAS) NMR
techniques provides well resolved spectra that exhibit
chemical shift differences and resonance line broaden-
ing in N- and O-like states compared with bR. An
assignment based on rotational echo double resonance
(REDOR) experiments in conjunction with double
labelling together with Mn
2+
-induced quenching and
D
2
O exchange of some of the observed resonances
allows a more detailed view of conformational changes
and motions within these mutants, which serve as
models for the N- and O-like states.
Results
The
15
N CPMAS spectrum of [
15
N]Met purple mem-
brane (Fig. 2A) allows the resolution of seven reso-
nances out of nine labelled residues. Contribution
from the
15
N natural abundance (0.37%) from a
26 kDa protein is calculated to be equivalent to 0.9
15
N nuclei per nine labelled residues, and is spread
over the full amide spectral region. Therefore, it can
be considered to be negligible in contrast to
13
C label-
ling. Compared to the wild type spectrum and to
each other, both N- and O-like preparations of
D85N ⁄ T170C (Fig. 2B,C) show marked differences.
Both the N-like and O-like state spectra are character-
ized by a number of well resolved resonances. In gen-
eral, in the N-like state the resonances appear slightly
broader and there is a greater degree of overlap. In the
O-like state, the number of clearly resolved resonances
is reduced with O2 and O4 appearing only as shoul-
ders to the intense O3 resonance. A summary of chem-
ical shifts and linewidths resulting from spectral
deconvolution is given in Table 1.
Resonances for Met20 (bR7) and Met145 (bR6)
have been assigned previously in bR using the single-
site mutations M20V and M145H [20,21] (supplement-
ary Fig. S1), whilst Met32 (bR2) was tentatively
assigned previously as a shoulder resonance using the
REDOR technique [21] and confirmed by D
2
O
exchange [20]. Here, we sought to assign the remaining
resolved methionine resonances by making use of
Mn
2+
-induced line broadening and deuterium
exchange of residues located close to the membrane
surface [22] in addition to REDOR on [
15
N]Met ⁄
[
13
C
1
]Ile or [
15
N]Met ⁄ [
13
C
1
]Phe membrane prepara-
tions. REDOR as an assignment technique has been
used previously as a selective filter [23] and to assign
specific proline residues in bacteriorhodopsin [24].
Knowing the primary structure of bR allows the
generation of unique
15
N-
13
C
1
pairs by colabelling
A
B
C
Fig. 2.
15
N CPMAS spectra obtained for [
15
N]methionine-labelled
(A) purple membranes (bR) in pH 6 buffered H
2
O, (B) D85N ⁄ T170C
membranes at pH 10 (N-like), and (C) D85N ⁄ T170C at pH 6 (O-like).
Resonances are labelled from large to small chemical shifts
(Table 1). Resonance assignment is discussed in the text. Spectra
were acquired at 60.82 MHz
15
N Larmor frequency, 253 K and
8 kHz sample rotation rate. Spectra were deconvoluted using
PEAK-
FIT
to obtain the linewidths of overlapping resonances.
N- and O-states of BR seen by solid-state NMR A. J. Mason et al.
2154 FEBS Journal 272 (2005) 2152–2164 ª 2005 FEBS
[
15
N]Met samples with the upstream residue enriched
with
13
C
1
. These
15
N-
13
C
1
pairs have a strong dipolar
coupling which can be used to selectively dephase and
therefore assign the related
15
N-resonances.
Applying the REDOR technique to the [
15
N]Met ⁄
[
13
C
1
]Ile bR sample using a short dephasing time of
1.4 ms caused a significant reduction in the intensity of
resonance bR1 (Fig. 3). Other resonances were unaffec-
ted within the limits of the signal-to-noise ratio of the
spectrum. The observed dephasing was mainly due to
the strong dipolar coupling between directly bonded
[
13
C
1
]Ile117 and [
15
N]Met118, which are separated by
only 1.3 A
˚
(Fig. 1). A small additional contribution
could also arise from [
13
C
1
]Ile119 which, in the 3D crys-
tal structure of bR (1c3w [14]), is 4.7 A
˚
away. There-
fore, bR1 can be assigned to Met118 in bR. The only
other spin pair within a 6 A
˚
radius of any [
13
C
1
]Ile in
this sample would be [
15
N]Met56 and [
13
C
1
]Ile52, which
are approximately 4.2 A
˚
apart. This weak dipolar coup-
ling would cause less signal decay at the short dephas-
ing time used here. We expect this signal reduction to
be below the noise level of this experiment and consider
the decay at bR3 as not significant at this stage.
Further resonances were assigned in [
15
N]Met ⁄
[
13
C
1
]Phe bR, N- and O-like preparations. Again using
a short dephasing time of 1.4 ms, a significant signal
reduction of bR5 was observed (Fig. 4A) in bR mem-
branes, while other resonances were unaffected within
the noise level of our data. In N- and O-like prepara-
tions, dephasing was observed for resonances N3
(Fig. 4B) and O3 (Fig. 4C), respectively. The observed
dephasing in each case was due to directly bonded
[
13
C
1
]Phe208-[
15
N]Met209. Therefore, bR5, N3 and O3
were assigned to Met209 in bR, N-like and O-like
states, respectively. The N-like preparation was suspen-
ded in buffer at pH 10 containing 40 lm Mn
2+
to
remove the signal from surface-exposed residues (N2,
see below) and allow a clearer observation of the
dephasing effect on N3. Some additional signal reduc-
tion of N4 in the N-like state may be attributed to
dephasing of [
15
N]Met56 by [
13
C
1
]Phe54.
Extending the REDOR dephasing time from 1.4 to
16 ms causes signal decay for a further resonance, bR3
Table 1. Summary of chemical shift and full width at half height
(FWHH) for all [
15
N]Met resonances shown in Fig. 2. Linewidths
were obtained by deconvolution using
PEAKFIT.
Resonance
Peak and
assignment
d
ISO
(p.p.m.)
FWHH
(p.p.m.)
BR (pH 6) bR1 ⁄ Met118 127.8 0.42
bR2 ⁄ Met32
a
124.4 0.45
bR3 ⁄ Met56 123.9 0.53
bR4 ⁄ Met60
b
122.5 0.34
bR5 ⁄ Met209 122.1 0.48
bR6 ⁄ Met145 120.7 0.84
bR7 ⁄ Met20 118.0 0.37
N-like (D85N ⁄ T170C,
pH 10)
N1
c
(Met118)
128.2 0.57
127.7 0.65
127.3 0.78
126.6 0.86
N2 123.8 1.24
N3 ⁄ Met209 122.9 0.82
N4 ⁄ Met56 121.5 0.52
N5 ⁄ Met145 120.6 0.72
N6 ⁄ Met145 120.0 0.59
N7 ⁄ Met20 118.1 0.57
O-like (D85N ⁄ T170C,
pH 6)
O1a 127.3 0.56
O1b
(Met118)
126.8 0.86
O2 124.1 2.1
O3 ⁄ Met209 122.9 0.71
O4 121.8 1.1
O5 ⁄ Met145 120.3 0.74
119.9 0.45
O6 ⁄ Met20
d
117.5 0.50
a
The shoulder down field of bR2 is best approximated by a Gaus-
sian with d
ISO
¼ 125.1 p.p.m., FWHH ¼ 0.822 p.p.m.
b
The shoul-
der between bR3 and bR4 is best approximated by a Gaussian with
d
ISO
¼ 123.0 p.p.m., FWHH ¼ 0.67ppm.
c
The best deconvolution
of N1 has been achieved with at least four Lorentzians.
d
The small
peak down field of O6 is best approximated by a Lorentzian with
d
ISO
¼ 118.3 p.p.m., FWHH ¼ 0.71 p.p.m.
Fig. 3. Dephased (S) and nondephased (S
0
)
15
N-detected
13
C ⁄
15
N
CP REDOR spectra of [
15
N]Met ⁄ [
13
C
1
]Ile purple membranes. A sig-
nificant signal decay of resonance bR1 is observed for a short
REDOR dephasing time of 1.4 ms. The only directly coupled
15
N–
13
C spin pair is [
15
N]Met118 ⁄ [
13
C
1
]Ile117, which allows the
assignment of bR1 to Met118. Intensity variations of the other sig-
nals are mainly due to noise and are discussed in the text. Spectra
were acquired at 40.52 MHz
15
N Larmor frequency, 253 K and
5 kHz sample rotation rate.
A. J. Mason et al. N- and O-states of BR seen by solid-state NMR
FEBS Journal 272 (2005) 2152–2164 ª 2005 FEBS 2155
(Fig. 5). In the 1c3w 3D crystal structure of bR,
[
13
C
1
]Phe54 is located approximately 3.2 A
˚
from
[
15
N]Met56. No other
15
N labels are within 6 A
˚
of any
[
13
C
1
]Phe except [
15
N]Met209. Therefore, bR3 is
assigned to Met56. The sample was suspended in buf-
fer containing 40 lm Mn
2+
to remove the signal from
surface-exposed residues (bR4, see below) and allow a
clearer observation of the dephasing of bR3 and bR5.
For technical reasons, all REDOR experiments pre-
sented here were performed at 40.54 MHz
15
N Larmor
frequency and at a 5 kHz sample rotation rate
(Figs 3–6), compared to 60.82 MHz and 8 kHz for the
cross polarization spectra presented in Fig. 2 and dis-
cussed earlier. Therefore, a poorer resolution was
achieved and bR2 was not clearly resolved under these
conditions. In addition, the different line shapes and
peak intensities obtained by cross polarization and
REDOR are caused by different spin relaxation due to
the long delays between rf pulses in the REDOR
experiment.
Mn
2+
-induced paramagnetic line broadening of
NMR signals has been described previously in
Fig. 4. Dephased (S) and nondephased (S
0
)
15
N-detected
13
C ⁄
15
N
CP REDOR spectra of [
15
N]Met ⁄ [
13
C
1
]Phe (A) purple membranes
and D85N ⁄ T170C membranes, at (B) pH 10 (N-like) in presence of
40 l
M Mn
2+
, and (C) pH 6 (O-like). Resonances bR5, N3 and O3
show strong decays at 1.4 ms REDOR dephasing time. The only
directly coupled
15
N-
13
C spin pair is [
15
N]Met209 ⁄ [
13
C
1
]Phe208
which allows assignment of bR5, N3 and O3 to Met209. Spectra
were acquired at 40.52 MHz
15
N Larmor frequency, 253 K and
5 kHz sample rotation rate.
Fig. 5.
15
N CPMAS and
15
N-detected
13
C ⁄
15
N CP REDOR spectra
of [
15
N]Met ⁄ [
13
C
1
]Phe purple membranes suspended in 40 lM
Mn
2+
pH 6 buffer. REDOR dephasing was applied for 16 ms which
completely dephases the signal from resonance bR5 but also
shows signal decay for bR3. In this sample, only [
13
C
1
]Phe208 and
[
15
N]Met209 are directly coupled but [
13
C
1
]Phe54 is within 3.2 A
˚
of
[
15
N]Met56 causing a slower dephasing due to a weaker dipolar
coupling. Therefore bR3 is assigned to Met56. Spectra were
acquired at 40.52 MHz
15
N Larmor frequency, 253 K and 5 kHz
sample rotation rate.
N- and O-states of BR seen by solid-state NMR A. J. Mason et al.
2156 FEBS Journal 272 (2005) 2152–2164 ª 2005 FEBS
bacteriorhodopsin [22], where it was used to assign resi-
dues close to the membrane surface. Strong dipole–
dipole interactions induce accelerated spin relaxation
and a concomitant line broadening in excess of 100 Hz,
such that NMR signals from residues close to the mem-
brane surface are suppressed in the CPMAS spectra.
Due to their location close to the membrane surface,
signals from Met32, 60, 68 and 163 are expected to
broaden upon the addition of Mn
2+
. In the bR-state a
significant reduction of intensity is observed for bR4
(Fig. 6A). However, previous D
2
O exchange experi-
ments [20] which remove signals from exchangeable
residues Met32, 68 and 163 [25] did not show an effect
on bR4, which indicates that bR4 is Met60 (Fig. 6A). In
the N-like state (Fig. 6B) a significant reduction of
intensity was only seen in the region around N2.
15
N CPMAS spectra acquired after the incubation
of [
15
N]Met membranes in D
2
O reveal solvent-exposed
residues due to a reduction in cross polarization by
exchanging the amide proton with a deuteron. In the
N-like state, N2 is effectively removed by deuterium
exchange (Fig. 7A) as is O2 in the O-like spectrum
(Fig. 7B). The observed effect on resonance N2 is con-
sistent with the detected quenching in the presence of
Mn
2+
discussed earlier. Therefore this signal must
arise from a solvent-accessible residue close to the
membrane surface (Met32, 68, 163). Differences
between N-like spectra affected by Mn
2+
quenching
(Fig. 6B) and deuterium exchange (Fig. 7A) could be
caused by Met60, but have not been observed. This
would suggest that the Met60 resonance is of low
intensity and ⁄ or largely obscured by the intense reson-
ance assigned to Met209 in the N-like state. Other
resonances are unaffected by deuterium exchange with
the exception of O6.
In the N-like state spectrum, resonance N7 occurs at
the same chemical shift and with similar intensity as
bR7 (Met20), but is slightly broader (Table 1). The
intensity of N7 is related to that of resonance O6,
which is shifted by only )0.5 p.p.m. When the mem-
branes are suspended in D
2
O in an O-like state, O6
splits into two resonances O6a and O6b (Fig. 7B). The
additional resonance O6a occurs at 118 p.p.m. as bR7
and N7, while O6b has the same chemical shift as O6.
The appearance of resonance O6a appears to cause a
signal reduction of O6. An explanation would be a
change in equilibrium between the N and O-like states
caused by resuspending the samples in D
2
O with a
subsequent change in pH. This is supported by the
detection of a blue shift of k
max
by 7 nm in the
absorption spectra of O-like samples in D
2
O (supple-
mentary Fig. S2) compared to preparation in H
2
O.
N-state samples are shifted by only 4 nm. These obser-
vations provide further evidence that N7 and O6 cor-
respond to the same residue.
Discussion
The
15
N CPMAS spectrum of [
15
N]Met purple mem-
branes (Fig. 2A) allows the resolution of seven reso-
nances, which correspond to the seven methionine
Fig. 6. Comparison of
15
N CPMAS spectra in the absence or pres-
ence of 40 l
M Mn
2+
(A) [
15
N]Met purple (bR) membranes at pH 6
with (dotted line) and without (solid line) the addition of 40 l
M
Mn
2+
. Resonance bR4 is most affected, which must arise from a
residue close enough to the membrane surface to be broadened in
the presence of Mn
2+
ions. Spectra were acquired at 40.52 MHz
15
N Larmor frequency, 253 K and 5 kHz sample rotation rate. (B)
[
15
N]Met D85N ⁄ T170C membranes in water buffered at pH 10
(solid line, top) and 40 l
M Mn
2+
solution also buffered at pH 10
(dotted line, top). The reduction in intensity is due to the broaden-
ing of signals resulting from surface-accessible residues. Spectra
were acquired at 60.82 MHz
15
N Larmor frequency, 253 K and
8 kHz sample rotation rate.
A. J. Mason et al. N- and O-states of BR seen by solid-state NMR
FEBS Journal 272 (2005) 2152–2164 ª 2005 FEBS 2157
resonances located in transmembrane helices A, B, D,
E and G (bR1–bR7 represent Met118, 32, 56, 60, 209,
145 and 20). The linewidth of the resolved resonances
ranges from 0.37 to 2.1 p.p.m. The obtained spectral
resolution was better than in previously published work
[20], which is probably due to the use of a higher mag-
netic field and faster sample spinning. Spectra in Fig. 2
were deconvoluted with the minimum number of
Gaussian or Lorentzian peaks required to minimize v
2
.
Possible error sources are limited signal-to-noise
(1 : 20–1 : 40 from 3–4 mg sample) as well as a small
amount of potential isotope scrambling which might
account for some background signal. Here, no direct
contributions from loop resonances Met68 and Met163
were detected. However, deconvolution of the spectrum
in Fig. 2A hints at additional signal contributions to
the shoulders seen downfield of bR2 (Met32) and bR4
(Met60). The reduced intensity and line broadening of
these loop residues has been proposed to be due to
fluctuating motions that interfere with the line narrow-
ing processes of MAS or heteronuclear
1
H decoupling
during acquisition [22]. The reduced spectral intensities
of [
15
N]Met68 and 163 have been also confirmed by
deuterium exchange experiments [20].
Spectra of the N-like (Fig. 2B) and O-like (Fig. 2C)
states show remarkable differences in line shape and
chemical shift when compared to the ground state
(Fig. 2A). Before discussing the potential meaning of
those changes, we need to assess whether they arise
from M-, N- and O-state equilibriums or from clean
intermediates. We have chosen the D85N ⁄ T170C dou-
ble mutant, because N- and O-like states can be popu-
lated by controlling the pH while the M-state is much
reduced compared to the well characterized D85N
bacteriorhodopsin mutant. At pH 6, D85N contains
95% O-like state and at pH 10 5% O, 20% N and
75% M [18]. By introducing an additional T170C
mutation, the pK
a
of M accumulation is raised as
shown in Fig. 8B. The reason is that the M–N trans-
ition is coupled to deprotonation of D96 and protona-
tion of the Schiff base. For example, in the 3D
structure of the N-state [7] T170 faces the cytoplasmic
channel at the level of D96. Therefore, a cysteine sub-
stitution would alter the hydrophobic pocket and the
pK
a
of D96 and so shift the M–N transition towards
N. By comparing the singular value decomposition
(SVD) analysis performed on D85N [18] with our data
(Fig. 8B), we estimate the contribution of M-state to
our sample at pH 10 to be not more than 30%.
Opposite to M–N, the N–O transition is coupled to
the protonation of D96 and to deprotonation of
groups at the cytoplasmic surface. Therefore, at low
pH, D96 will be protonated and we obtain a sample
mainly in O-state as shown for D85N (no M- and very
little N-contribution). The O-state shows a characteris-
tic absorbance found at 604 nm. Raising the pH here
also increases contributions from M and N. It is
known that the N- and O-states have different absorp-
tion maxima at k
max
604 nm and 586 nm, respectively
(Fig. 8A). The N-state extinction coefficient is lower
Fig. 7. Comparison of
15
N CPMAS spectra
of [
15
N]Met D85N ⁄ T170C membranes in
water and D
2
O. (A) Buffered at pH 10
(N-like state), (B) buffered at pH 6 (O-like
state). The spectral subtractions reveal the
intensity of the resonances resulting from
exchangeable residues (N2, O2). Spectra
were acquired at 60.82 MHz
15
N Larmor
frequency, 253 K and 8 kHz sample rota-
tion rate.
N- and O-states of BR seen by solid-state NMR A. J. Mason et al.
2158 FEBS Journal 272 (2005) 2152–2164 ª 2005 FEBS
(70%) than in the O-state. Raising the pH from 6 to
10 accumulates a small M-state population but mainly
N-state, which is first seen as a signal reduction of the
O-state resonance. The question is now to what extent
both the N- and O-states are mixed at the experimen-
tal conditions we have chosen for our NMR experi-
ments. In addition to the fact that the absorption
maxima in Fig. 8A are clearly separated for the
N- and O-state, our
15
N CPMAS spectra in Fig. 2 also
show that both states are not significantly mixed. The
sharp resonance from Met20 (N7 & O6) is in both
cases very well resolved and appears at 118.1 p.p.m.
(N) and 117.5 p.p.m. (O). Both lines are only
0.5 p.p.m. wide and would be present simultaneously if
samples contained a significant N ⁄ O mixture, which is
not the case. There is no contribution from O in the
N-like sample (pH 10). The only hint for an N-state
contribution at pH 6 (O-like state) is a small resonance
at 118.3 p.p.m. Our deuterium exchange data (Fig. 7B)
have shown that a resonance at 118.0 p.p.m. occurs
when the N–O equilibrium is shifted towards N. We
cannot exclude at this point that the resonance at
118.3ppm also arises from N in which case its contri-
bution is estimated to 15% based on the fitted peak
size. Concluding, we can comment that our samples at
pH 6 are mainly found in a clean O-state with only a
small potential contribution of 15% N and no M-state.
At pH 10 we find an approximately 70 : 30 N-like ⁄
M-like mixture but no O-like state. Therefore, our
spectra are dominated by N- or O-like states, which
allows us to discuss the nature of the changes in chem-
ical shift and line shape for each individual resonance
in more detail.
The resonance bR7 assigned to Met20 in bR [20] is
located upfield and well separated from the other
peaks (Fig. 2A). In the N-like state a resonance N7
appears with identical chemical shift but slightly
broadened by 0.2 p.p.m. and separated from all other
resonances by 2 p.p.m. Both bR7 and N7 are unaffec-
ted by Mn
2+
-induced line broadening and D
2
O
exchange. Therefore it seems reasonable to assume that
resonance N7 is also caused by [
15
N]Met20. In the
O-like state, resonance O6 appears 0.5 p.p.m. upfield of
bR7 and N7 and is separated by 2.4 p.p.m. from other
residues. Deuterium exchange suggests, as discussed in
the results section, that O6 and N7 belong to the same
residue, probably Met20. This would mean that Met20
has the same chemical shift in bR- and N-like states and
changes only by 0.5 p.p.m. in the O-like state. Therefore
it is likely that it occupies the same conformation in
bR- and N-like states but may experience a subtle
change in conformation or an alteration in local hydro-
gen bonding on conversion to the O-like state.
Further up helix A, Met32 is assigned to bR2 [21] in
bR. The fate of this residue on conversion to the
N-like state is uncertain as a peak N2 appearing at a
similar chemical shift is of a much greater intensity.
The intensity of resonance N2 is reduced by adding
Mn
2+
(Fig. 6B) and by deuterium exchange (Fig. 7A)
which points towards a solvent-accessible residue close
to the membrane surface such as Met32, 68 or 163.
Met32 is the only helical resonance that is exchange-
able [20,25] and as discussed earlier, Met68 and 163
are difficult to detect in the [
15
N]Met spectrum of bR.
A stronger contribution in the N-like spectrum would
only be expected if either loops EF or BC show much
reduced molecular motions, which interfere less with
the NMR experiments. However, this is currently
unknown and we cannot safely discriminate between
Met32, 68 and 163. Resonance O2 in the O-like state
occurs at the same chemical shift as N2 but appears
broader with reduced intensity. As for N2, deuterium
exchange indicates contributions from residues Met32,
Fig. 8. UV ⁄ vis spectra obtained for D85N ⁄ T170C membranes puri-
fied by sucrose density gradient centrifugation at 38% (w ⁄ w)
sucrose at different pH values (A). The N-like state contains some
M-state contribution, which is, however, much reduced compared
to D85N (B) and can be estimated to 30% based on the SVD
analysis for D85N. D85N analysis results and data were taken from
[18].
A. J. Mason et al. N- and O-states of BR seen by solid-state NMR
FEBS Journal 272 (2005) 2152–2164 ª 2005 FEBS 2159
68 or 163 (Fig. 7B). Whether the observed line broad-
ening is of homogeneous or nonhomogeneous nature
i.e. caused by altered molecular motions on the NMR
time scale or by conformational heterogeneity compared
to the bR state, cannot be concluded from these data.
Met56, located on helix B, gives rise to resonance
bR3, as shown by the REDOR experiments discussed
earlier. A similar assignment in the N-like and O-like
states was not possible, as experiments with longer
dephasing times were hampered by poor sensitivity.
However, our data can be used to limit the number of
possibilities. In the N-like state, resonance N4 is not
affected by Mn
2+
quenching (Fig. 6B) nor deuterium
exchange (Fig. 7A). Therefore, Met32, 60, 68 and 163
can be ruled out, assuming that solvent accessibility
and location close to the membrane surface does not
change compared to our wild type samples. Further-
more, Met20 and Met209 have been already assigned
to N7 and N3, which leaves us with Met56, 118 and
145. In bR Met118 had been assigned to resonance
bR1 which is 6 p.p.m. downfield of N4. It is therefore
considered unlikely that N4 is caused by Met118.
However, only a 0.8 p.p.m. downfield shift for Met145
or 2.4 p.p.m. upfield shift for Met56 would be
required. Further down helix B and close to the extra-
cellular surface is Met60 which has been assigned to
bR4. A clear resonance cannot be assigned to Met60
in the N-like state but Mn
2+
induced line broadening
shows that it is-likely concealed under the intensity N3
assigned to Met209. In the O-like state, the number of
resonances is reduced. They appear at different chem-
ical shifts and are generally broadened compared to
bR. Especially spectral components O2 and O4 under-
lying O3 appear as broad shoulder resonances. The
intensities around O2 must belong to deuterium
exchangeable residues (Fig. 7B) while O3 has been
assigned to Met209. The small but broad shoulder
resonance O4 (Figs 2C and 7B) could correspond to
residual intensity due to Met56 and ⁄ or Met60.
The observed broadening of lines could be of homo-
geneous or nonhomogeneous nature. Interestingly,
recent research suggests that the cytoplasmic half of
helix B, where both Met56 and Met60 are located,
adopts motional fluctuations after deprotonation of
the Schiff base [26]. As discussed previously for loop
resonances Met63 and Met163 these fluctuations might
cause interference with proton decoupling or magic
angle sample spinning [22]. Whilst the presence of a
signal (N4, N5 or N6) that can be tentatively assigned
to Met56 in the N-like state suggests that the fluctu-
ating motions proposed in the cytoplasmic half of helix
B above Pro50 do not affect the whole helix in the
N-state, the absence of an intense signal from Met56
or Met60 in the O-like state suggests that such fluctu-
ating motions are propagated down helix B as far as
Met56 or Met60 in this later stage of the photocycle.
In the bR state Met118 is the most downfield and
intense of the methionine resonances. Met118 is
observed as a sharp peak bR1. In the N-like state a
broad resonance N1 with the same chemical shift as
bR1 occurs. Deconvolution of N1 indicates at least
four identifiable resonances (Table 1). Because of sim-
ilar chemical shifts relative to bR1, their separation by
over 3 p.p.m. from the other resolved resonances and
the fact that bR1, N1 and O1ab are also unaffected by
D
2
O exchange, we assume that these resonances are
also due to Met118. The additional resonances are of
similar intensity and are shifted both upfield and down-
field in the N-like state. This could indicate structural
heterogeneity around this residue in the N-like state
in the membrane environment. On conversion to the
O-like state two resonances O1a and O1b are observed.
The second of the two methionine residues located
close to the retinal binding pocket [27], Met145, gives
rise to a comparatively broad resonance bR6. The pro-
cess of introducing purple membrane samples into
rotors and into the magnet before running experiments
for many hours at 253 K will accumulate considerable
amounts of dark adapted (DA) bR compared with
light adapted (LA) bR in our samples. Met145 has
already been identified as a key residue in the dark
adaptation of bR [28] and the relatively large linewidth
of this resonance is evidence for Met145 being either
in two conformations in DA and LA bR or experien-
cing two slightly differing electronic environments. At
pH 10, mimicking the N-state, two resolvable reso-
nances N5 and N6 are observed which are close to the
bR resonance of Met145 (bR6). The chemical shift of
N5 is almost identical to bR6 and N6 is slightly shifted
upfield by 0.6 p.p.m. In the O-state, resonance O5
appears at the same chemical shift as N6 with a down-
field shoulder resonance. The small difference in chem-
ical shift and the fact that N5, N6 and O5 are also
unaffected by Mn
2+
induced line broadening and D
2
O
exchange suggest that N5, N6 and O5 are due to the
same residue, Met145.
The final methionine residue is Met209, located on
helix G. The intense resonances N3 and O3 in the
N-like and O-like preparations (Fig. 2B,C) were
assigned to Met209 using the REDOR technique des-
cribed above. The resonance ascribed to Met209 shifts
downfield by 0.8 p.p.m. compared to the ground-state
and becomes the most intense resonance. The change
in intensity could be due to an increase in cross polar-
ization (CP) efficiency which, in combination with the
chemical shift change, would indicate a change in
N- and O-states of BR seen by solid-state NMR A. J. Mason et al.
2160 FEBS Journal 272 (2005) 2152–2164 ª 2005 FEBS
conformation and dynamic that is maintained in both
N- and O-like states. The exact nature of the alteration
in dynamic and how it is linked to the small observed
changes of orientation of helix G [7,13] is unclear,
however, it is possible that an increase in intensity of
this resonance could be related to a reduced dynamic
in this region as the helix moves from its ground state
orientation.
It is interesting to note that in O and also in N, even
when considering small M-state contributions, that
some resonances are broadened while others remain
sharp. Resonances from residues Met118 and Met145
are split into a number of differing lines in contrast
with others such as Met20, which remain single peaks.
Interestingly, these line-broadend residues are located
around the retinal indicating heterogeneity in this
region. Previous solid-state NMR studies of D85N
bacteriorhodopsin [29] and Raman studies of
D85N ⁄ F42C [30] showed that in the O-like state at
pH 6, at least two different retinal conformations are
present: 13-cis, 15-syn; and all-trans, 15-anti. Despite
earlier reports of a completely all-trans chromophore
at pH 10.8 [31], it was suggested by solid-state NMR
[29] and other studies [32] that a mixture of 13-cis, 15-
anti and all-trans chromophore, with a predomination
of the 13-cis, 15-anti form in a bent binding pocket,
exists. At pH 10, the residual M-state adds contribu-
tions from deprotonated 13-cis, 15-anti retinal to the
line broadening. The retinal structural heterogeneity is
reflected in the chemical shift changes and line broad-
ening that takes place for resonances assigned to
Met118 and Met145, which are located close to the
retinal binding pocket. Other resonances such as
Met20 have much smaller linewidths indicating that
the protein structure around those labels is rather
more homogenous. It can be seen from the N- and
O-like spectra (Fig. 2B,C) that Met118 is strongly
affected by the presence of a structurally heterogene-
ous chromophore. Based on the observed linewidths
and line shapes, Met118 seems to be more heterogene-
ous in the N-like spectrum compared with the O- or
bR-state spectra. If the assignment of N5, N6 and O5
to Met145 is correct, then our data implies that this
residue adopts two conformations at pH 10, one sim-
ilar to the bR state and one that will persist into the
O-like state. At pH 6 the structural heterogeneity
around Met118 would be reduced whilst Met145
would be able to adopt a single conformation.
Conclusions
15
N CPMAS combined with selective [
15
N]Met
labelling has provided some observations on the
conformational changes that a number of reporter res-
idues in the transmembrane helices undergo. The large
chemical shift dispersion amongst the
15
N-labelled
methionine residues allows almost complete resolution
in the bR-state and many interesting spectral features
to be identified in mutant membranes mimicking the
N and O photointermediates. The resolution is
sufficient to accurately assign some of the residues.
The observed conformational heterogeneity and the
spectral characteristics, as observed previously in
13
CO-labelled preparations [22], identifies amino acids
in helix B that undergo fluctuating motions in the last
stage of the photocycle before the protein returns to
the bR state.
While the double mutant used for our study allows
a decent separation of states, the D85N ⁄ F42C mutant
might be even better suited for future studies. A low-
ered pK
a
for Asp96 [30] may well have even less het-
erogeneity at pH 10 and could provide an attractive
system for further study using this technique, making
for an interesting comparison.
Recently we have shown that orientational con-
straints can be determined, in a site-directed manner,
by specifically labelling bacteriorhodopsin within the
purple membrane with
15
N-enriched amino acids in
combination with magic angle oriented sample spin-
ning (MAOSS) [33] solid-state NMR methods [20,34].
This will allow the observed chemical shift changes
resolved in this study to be correlated with a more
extensive study of the helix reorientations during the
reprotonation phase of the photocycle within the nat-
ural membrane, the results of which will be reported
elsewhere.
Experimental procedures
Sample preparation
Halobacterium salinarum (S9 or L33 expressing D85N ⁄
T170C [19]) were cultured in a synthetic medium (1 L)
containing all nutrients requisite for normal growth [35].
[
15
N]l-methionine (0.19 gÆL
)1
) was added to the medium in
place of the usual unlabelled l-methionine. After five days
incubation in the dark (225 r.p.m., 37 °C), when D
660
measurements peaked, the cells were harvested and the
purple membrane purified following published procedures
[36]. Sucrose density centrifugation was performed using a
stepped sucrose gradient of 10 mL of each of 45%, 35%
and 25% sucrose (w ⁄ w) with centrifugation overnight
(83 000 g, Beckmann SW28 rotor, 15 °C). Samples contain-
ing purified purple membrane were washed and resuspend-
ed in 5 mm Na
3
citrate, 5 mm KCl buffer (pH 6). Samples
containing protein carrying the D85N ⁄ T170C mutation
A. J. Mason et al. N- and O-states of BR seen by solid-state NMR
FEBS Journal 272 (2005) 2152–2164 ª 2005 FEBS 2161
were suspended both in pH 6 buffer as above, to mimic the
O-like state or a 10 mm Tris, 15 mm KCl buffer (pH 10) to
increase the population of the N-like state.
For CPMAS experiments, [
15
N]Met wild type and
D85N ⁄ T170C (both pH 10 and pH 6) membranes were pre-
pared. However,
13
C ⁄
15
N-double labelling was necessary
for assignment purposes. Therefore [
15
N]Met ⁄ p
13
C
1
]Phe
(using 0.13 g ÆL
)1
[
13
C
1
]Phe) wild type and D85N ⁄ T170C
membranes and [
15
N]Met ⁄ [
13
C
1
]Ile (using 0.22 gÆL
)1
[
13
C
1
]Ile) wild type membranes were produced for REDOR
experiments. [
15
N]Met wild type and D85N ⁄ T170C mem-
branes at pH 10 were also taken and suspended in buffer
containing 40 lm Mn
2+
, the membranes were then pelleted,
frozen and CPMAS spectra acquired immediately. Finally,
[
15
N]Met D85N ⁄ T170C membranes were suspended in D
2
O
buffered at apparent pH values of 6 or 10. The membranes
were incubated at 30 °C for 48 h before being pelleted as
above for CPMAS NMR.
UV/vis and SDS/PAGE characterization
of D85N/T170C membranes
During the preparation of D85N ⁄ T170C membranes for
NMR studies, two populations of blue membrane could
be observed on the sucrose density gradient; a main band
at 38% and a diffuse band at 30% sucrose. Both bands
were collected and analyzed by absorption spectroscopy
and SDS ⁄ PAGE (supplementary Fig. S2). PAGE analysis
reveals a dense band at 26 kDa for all samples; however,
the less dense membrane was contaminated with other
proteins in agreement with the higher A
280
⁄ A
600
ratio seen
in the UV ⁄ vis spectra (supplementary Fig. S2). Therefore,
only membranes collected from 38% sucrose were used
for the NMR experiments. Absorption spectra were
acquired for D85N ⁄ T170C membrane samples suspended
in 1 mL of suitable buffer at different pH. Wavelength
scans from 700 to 260 nm in 1 nm intervals were per-
formed on a Jasco V-550 spectrophotometer (Groß-
Umstadt, Germany) using a 1 cm light path. Figure 8A
shows that the chromophore containing protein in the
higher density band responds to changes in pH according
to the described phenotype for D85N ⁄ T170C bR [19]. At
pH 10 k
max
is found at 586 nm (N-state) and at pH 6 at
k
max
is 604 nm (O-state). Absorption at 412 nm (M-state)
increases with pH. Taking into account the contribution
of light scattering, usually observed in purple membrane
at 412 nm, the M-state contribution is estimated at 30%
at this higher pH in the membrane samples used for the
NMR experiments. This estimation is also supported when
compared to the results of singular value decomposition
analysis carried out on D85N [18]. A direct comparison of
the M-state absorption maxima at different pH values in
D85N [18] and the system used here also illustrates that
the amount of M-state is significantly reduced due to the
additional T170C mutation (Fig. 8B).
Solid-state NMR spectroscopy
15
N CPMAS experiments were performed at 60.82 MHz
and 40.54 MHz for
15
N on Bruker Avance 600 and 400
spectrometers (Karlsruhe, Germany) equipped with 4 mm
and 7 mm DVT-MAS probes, respectively. A recycle
delay of 1 s was used with a contact time of 1 ms, an
acquisition time of 49 ms and a spectral width of
50 kHz. Optimized 80–100% ramped CP experiments
with proton decoupling, using a two pulse phase modula-
tion at 62.5 kHz
1
H field were performed at 253 K, at
sample rotation rates of 5 kHz and 8 kHz. Free induc-
tion decays were processed with 16k points, without
exponential line broadening prior to Fourier transforma-
tion. Processed spectra were deconvoluted using peakfit
(SeaSolve, Richmond, CA, USA) to obtain the linewidths
of overlapping resonances.
15
N-detected
13
C ⁄
15
N-REDOR experiments were
performed at 100.63 MHz ⁄ 40.54 MHz for
13
C ⁄
15
Nona
Bruker Avance 400 spectrometer equipped with a 7 mm
DVT-MAS triple resonance probe, at 253 K and at a
sample spinning rate of 5 kHz. A standard REDOR pulse
sequence according to [37] was used. Two equally spaced
13
C p pulses at a field strength of 36 kHz were applied per
rotor period. A
15
N p pulse (40 kHz) in the middle of the
dephasing period replaced the
13
C pulse and refocused
15
N chemical shifts. Dephasing times were varied between
7 and 79 rotor cycles (1.4 and 16 ms) to sample both stron-
ger dipolar couplings arising from directly bonded
15
N-
13
C
1
spin pairs as well as weaker dipolar couplings from spin
pairs which are separated by more than one bond length.
Free induction decays were processed with 16k points
without exponential line broadening prior to Fourier trans-
formation.
15
N chemical shifts were measured relative to an external
standard of solid (NH
4
)
2
SO
4
at 27 p.p.m. All NMR experi-
ments were performed on samples containing approxi-
mately 3–4 mg of protein.
Acknowledgements
This work was supported by DFG GL307 ⁄ 1–2. The
authors thank Leonid Brown for critical reading of the
manuscript. Single site mutants used previously to
assign methionine resonances were provided by Janos
Lanyi and Leonid Brown.
References
1 Stoeckenius W, Lozier RH & Bogomolni RA (1979)
Bacteriorhodopsin and the purple membrane of halo-
bacteria. Biochim Biophys Acta 505, 215–278.
2 Henderson R, Baldwin JM, Ceska TA, Zemlin F, Beck-
mann E & Downing KH (1990) Model for the structure
N- and O-states of BR seen by solid-state NMR A. J. Mason et al.
2162 FEBS Journal 272 (2005) 2152–2164 ª 2005 FEBS
of bacteriorhodopsin based on high resolution electron
cryo-microscopy. J Mol Biol 213, 899–929.
3 Hirai T & Subramaniam S (2003) Structural insights
into the mechanism of proton pumping by bacteriorho-
dopsin. FEBS Lett 545 , 2–8.
4 Lanyi JK & Schobert B (2004) Local-global conforma-
tional coupling in a heptahelical membrane protein:
transport mechanism from crystal structures of the nine
states in the bacteriorhodopsin photocycle. Biochemistry
43, 3–8.
5 Subramaniam S, Lindahl M, Bullough P, Faruqi AR,
Tittor J, Oesterhelt D, Brown L, Lanyi J & Henderson
R (1999) Protein conformational changes in the bacter-
iorhodopsin photocycle. J Mol Biol 287, 145–161.
6 Subramaniam S & Henderson R (2000) Molecular
mechanism of vectorial proton translocation by bacter-
iorhodopsin. Nature 406, 653–657.
7 Vonck JA (2000) Structure of the bacteriorhodopsin
mutant F219L N intermediate revealed by electron crys-
tallography. EMBO J 19 , 2152–2160.
8 Oka T, Kamikubo H, Tokunaga F, Lanyi JK, Needle-
man R & Kataoka M (1999) Conformational change of
helix G in the bacteriorhodopsin photocycle: investiga-
tion with heavy atom labelling and X-ray diffraction.
Biophys J 76, 1018–1023.
9 Oka T, Yagi N, Fujisawa T, Kamikubo H, Tokunaga F
& Kataoka M (2000) Time-resolved X-ray diffraction
reveals multiple conformations in the M–N transition of
the bacteriorhodopsin photocycle. Proc Natl Acad Sci
USA 97, 14278–14282.
10 Oka T, Yagi N, Tokunaga F & Kataoka M (2002)
Time-resolved X-ray diffraction reveals movement of F
helix of D96N bacteriorhodopsin during M-MN transi-
tion at neutral pH. Biophys J 82, 2610–2616.
11 Thorgeirsson TE, Xiao W, Brown LS, Needleman R,
Lanyi JK & Shin YK (1997) Transient channel-opening
in bacteriorhodopsin: an EPR study. J Mol Biol 273,
951–957.
12 Rink T, Pfeiffer M, Oesterhelt D, Gerwert K & Stenh-
off HJ (2000) Unraveling photoexcited conformational
changes of bacteriorhodopsin by time resolved electron
paramagnetic resonance spectroscopy. Biophys J 76,
1018–1023.
13 Kamikubo H, Kataoka M, Varo G, Oka T, Tokunaga
F, Needleman R & Lanyi JK (1996) Structure of the
N intermediate of bacteriorhodopsin revealed by
x-ray diffraction. Proc Natl Acad Sci USA 93, 1386–
1390.
14 Luecke H, Schobert B, Richter H-T, Cartailler JP &
Lanyi JK (1999) Structural changes in bacteriorhodop-
sin during ion transport, at 2 Angstrom resolution.
Science 286, 255–260.
15 Schobert B, Brown LS & Lanyi JK (2003) Crystallo-
graphic structures of the M and N intermediates of bac-
teriorhodopsin. Assembly of a hydrogen-bonded chain
of water molecules between Asp-96 and the retinal schiff
base. J Mol Biol 330, 553–570.
16 Xiao W, Brown LS, Needleman R, Lanyi JK & Shin
YK (2000) Light induced rotation of a transmembrane
a-helix. J Mol Biol 304, 715–721.
17 Rouhani S, Cartailler J-P, Facciotti MT, Walian P,
Needleman R, Lanyi JK, Glaeser RM & Luecke H
(2001) Crystal structure of the D85S mutant of bacter-
iorhodopsin: model of an O-like photocycle intermedi-
ate. J Mol Biol 313, 615–628.
18 Turner GJ, Miercke L, Thorgeirsson T, Kliger D,
Betlach MC & Stroud RM (1993) Bacterhiorhodopsin
D85N: three spectroscopic species in equilibrium.
Biochemistry 32, 1332–1337.
19 Martinez LC, Thurmond RL, Jones PG & Turner GJ
(2002) Subdomains in the F and G helices of bacterio-
rhodopsin regulate the conformational transitions of the
reprotonation mechanism. Proteins: Structure, Funtion
Genet 48, 269–282.
20 Mason AJ, Grage SL, Straus SK, Glaubitz C & Watts
A (2004) Identifying anisotropic constraints in multiply
labelled bacteriorhodopsin by
15
N MAOSS NMR: a
general approach to structural studies of membrane
proteins. Biophys J 86, 1610–1617.
21 Mason A (2001) Solid-state NMR studies of bacterio-
rhodopsin and the purple membrane. D. Phil Thesis,
University of Oxford, Oxford, UK.
22 Saito H, Mikami J, Yamaguchi S, Tanio M, Kira A,
Arakawa T, Yamamoto K & Tuzi S (2004) Site-directed
13
C solid-state NMR studies on membrane proteins.
strategy and goals toward revealing conformation and
dynamics as illustrated for bacteriorhodopsin labeled
with [1–
13
C] amino acid residues. Magn Reson Chem 42,
218–230.
23 Yang J, Parkanzky PD, Bodner ML, Duskin CA &
Weliky DP (2002) Application of REDOR subtraction
for filtered MAS observation of labeled backbone car-
bons of membrane-bound fusion peptides. J Magn
Reson 159, 101–110.
24 Lansing JC, Hu JG, Belenky B, Griffin RG & Herzfeld
J (2003) Solid-state NMR investigation of the buried
X-proline peptide bonds of bacteriorhodopsin. Biochem-
istry 42, 3586–3593.
25 Seigneuret M & Kainosho M (1993) Localisation of
methionine residues in bacteriorhodopsin by carbonyl
13C-NMR with sequence-specific assignments. FEBS
Lett 327, 7–12.
26 Kira A, Tanio M, Tuzi S & Saito H (2004) Significance
of low-frequency local fluctuation motions in the trans-
membrane B and C a-helices of bacteriorhodopsin, to
facilitate efficient proton uptake from the cytoplasmic
surface, as revealed by site-directed solid-state
13
C
NMR. Eur Biophys J 33, 580–588.
27 Greenhalgh DA, Farrens DL, Subramaniam S & Khor-
ana HG (1993) Hydrophobic amino acids in the retinal-
A. J. Mason et al. N- and O-states of BR seen by solid-state NMR
FEBS Journal 272 (2005) 2152–2164 ª 2005 FEBS 2163
binding pocket of bacteriorhodopsin. J Biol Chem 268,
20305–20311.
28 Ihara K, Amemiya T, Miyashita Y & Mukohata Y
(1994) Met-145 is a key residue in the dark adaptation
of bacteriorhodopsin homologs. Biophys J 67, 1187–
1191.
29 Hatcher ME, Hu JG, Belenky M, Verdegem P, Lugten-
burg J, Griffin RG & Herzfeld J (2002) Control of the
pump cycle in bacteriorhodopsin: mechanisms eluci-
dated by solid-state NMR of the D85N mutant. Biophys
J 82, 1017–1029.
30 Dioumauv AK, Brown LS, Needleman R & Lanyi JK
(1998) Partitioning of free energy gain between the
photoisomerized retinal and the protein in bacteriorho-
dopsin. Biochemistry 37, 9889–9893.
31 Nilsson A, Rath P, Olejnik J, Coleman M & Rothschild
KJ (1995) Protein conformational changes during the
bacteriorhodopsin photocycle. J Biol Chem 270, 29746–
29751.
32 Brown LS, Dioumaev AK, Needleman R & Lanyi JK
(1998) Local-access model for proton transfer in bacter-
iorhodopsin. Biochemistry 37, 3982–3993.
33 Glaubitz C & Watts A (1998) Magic angle-oriented
sample spinning (MAOSS): a new approach toward
biomembrane studies. J Magn Reson 130, 305–316.
34 Lopez JJ, Mason AJ Kaiser C & Glaubitz C (2005)
SLF-NMR on ordered membrane protein samples
under MAS conditions. in press.
35 Helgerson SL, Siemen SL & Dratz EA (1992) Enrich-
ment of bacteriorhodopsin with isotopically labelled
amino acids by biosynthetic incorporation in Halobac-
terium halobium. Can J Microbiol 38, 1181–1185.
36 Oesterhelt D & Stoeckenius W (1974) Isolation of the
cell membrane of Halobacterium halobium and its frac-
tionation into red and purple membranes. Methods
Enzymol 31, 667–678.
37 Gullion T & Schaefer J (1989) Rotational-echo double-
resonance NMR. J Magn Reson 81 , 196–200.
Supplementary material
The following material is available from http://www.
blackwellpublishing.com/products/journals/suppmat/EJB/
EJB4633/EJB4633sm.htm
Fig. S1.
15
N CPMAS spectrum of [
15
N]methionine-
labelled M145H purple membranes suspended in pH 6
buffer. The resonance at 120.6 p.p.m. (Fig. 2A, bR6)
is absent and is assigned to Met145. Spectra were
acquired at 253 K with a MAS frequency of 8 kHz on
a Bruker Avance 600 spectrometer.
Fig. S2. UV ⁄ vis spectra of the D85N ⁄ T170C mem-
branes in D
2
O showed a blue shift of the k
max
of
between 4 and 7 nm compared with the corresponding
preparations in H
2
O. N-like preparation in D
2
O (black
line) k
max
is 582 nm compared with 586 nm in H
2
O
whilst the O-like preparation (grey line) has a k
max
at
597 nm in D
2
O compared with 604 nm in H
2
O.
Fig. S3. SDS ⁄ PAGE (A) and UV ⁄ vis spectra obtained
for D85N ⁄ T170C membranes purified by sucrose den-
sity gradient centrifugation at 30% (bA) and 38% (cB)
sucrose (w ⁄ w). The gel analysis shows that both bands
recovered from the sucrose gradient are enriched with
26 kDa protein but the band recovered at 30%
sucrose is contaminated with many other proteins.
UV ⁄ vis spectra were obtained at pH 6 (dashed line),
pH 8 (dotted line) and pH 10 (grey line).
N- and O-states of BR seen by solid-state NMR A. J. Mason et al.
2164 FEBS Journal 272 (2005) 2152–2164 ª 2005 FEBS