Event Detection from Flickr Data through Wavelet-based Spatial Analysis pdf
Bạn đang xem bản rút gọn của tài liệu. Xem và tải ngay bản đầy đủ của tài liệu tại đây (265.83 KB, 10 trang )
Event Detection from Flickr Data through Wavelet-based
Spatial Analysis
Ling Chen
L3S Research Center
Leibniz University Hannover
Abhishek Roy
Indian Institute of Technology
Guwahati, India
ABSTRACT
Detecting events from web resources has attracted increas-
ing research interests in recent years. Our focus in this pa-
per is to detect events from photos on Flickr, an Internet
image community website. The results can be used to fa-
cilitate user searching and browsing p hotos by events. The
problem is challenging considering: (1) Flickr data is noisy,
because there are photos unrelated to real-world events; (2)
It is not easy to capture the content of photos. This paper
presents our effort in detecting events from Flickr photos by
exploiting the tags supplied by users to annotate photos. In
particular, the temporal and locational distributions of tag
usage are analyzed in the first place, where a wavelet trans-
form is employed to suppress noise. Then, we identify tags
related with events, and further distinguish between tags of
aperiodic events and those of periodic events. Afterwards,
event-related tags are clustered such that each cluster, rep-
resenting an event, consists of tags with similar temporal
and locational distribution patterns as well as with simi-
lar associated photos. Finally, for each tag cluster, photos
corresponding to the represented event are extracted. We
evaluate the performance of our approach using a set of real
data collected from Flickr. The experimental results demon-
strate that our approach is effective in detecting events from
the Flickr photo collection.
Categories and Subject Descriptors
H.3.3 [Information Systems]: Information Storage and
Retrieval—Information Search and retrieval
General Terms
Algorithms, Experimentation, Measurement
Keywords
event detection, flickr tag, wavelet transform
1. INTRODUCTION
Due to the rapid advancement of digital technology in
the last two decades, there has been an increasingly large
amount of image files available on the web. With the recent
Permission to make digital or hard copies of all or part of this work for
personal or classroom use is granted without fee provided that copies are
not made or distributed for profit or commercial advantage and that copies
bear this notice and the full citation on the first page. To copy otherwise, to
republish, to post on servers or to redistribute to lists, requires prior specific
permission and/or a fee.
CIKM’09, November 2–6, 2009, Hong Kong, China.
Copyright 2009 ACM 978-1-60558-512-3/09/11 $10.00.
spreading of web 2.0, more and more individual users began
to upload photos taken by themselves to image community
web sites, such as Flickr
1
, Picasa
2
, and Webshots
3
. The
enormous —and continuously growing— volume of online
image data necessitates the development of efficient and ef-
fective web image retrieval systems. Many approaches have
been proposed in the literature, including text-based image
retrieval as well as content-based image retrieval (CBIR).
Orthogonal to improving technologies to help image retrieval,
vertical search, in contrast to broad-based search, appeared
to facilitate searching images in specific domains. For exam-
ple, Webshots
3
allows users to search images in a list of pre-
specified categories and subcategories, including “events”.
Obviously, automatically detecting events from image col-
lection will be beneficial for focused searching/browsing of
images related to events. Other applications of detecting
events from images range from reducing semantic gap be-
tween low-level and high-level features of images [23], to
recommending event tags for photos based on location and
time of capture, and extracting event semantics from image
tags [20].
In this paper, we aim to detect events from Flickr pho-
tos, although our approach can be applied to any other im-
age collection with similar metadata. This is a challeng-
ing problem considering that Flickr data is noisy. Different
from a data set of news stories, where each story is related
with a certain event, not every Flickr photo represents some
event in the real world. Consequently, most of the existing
approaches [24, 18, 10, 14] which detect events from news
stories cannot be employed directly. The situation is exacer-
bated as t he content of photos cannot be captured as easily
as documents. A fundamental t ask of image analysis is yet
largely an unsolved problem [15]. Existing web image search
engines mainly rely on the text on the pages in which im-
ages are embedded. Compared with normal web pages with
images, pages on Flickr contain much less text. However,
similar to many other popular social networking websites,
Flickr provides users the service to annotate photos with
textual labels called “tags”. Studies on tag data [12, 11] have
demonstrated that tags resulting from collaborative tagging
systems represent a stable, emergent consensus of system
users. Consequently, in our work, we capture the content of
Flickr photos by exploiting user-supplied tags.
Existing algorithms of retrospective event detection can
be generally classified into two categories: document-pivot
1
http://www.flickr.com
2
3
approaches and feature-pivot approaches. The former de-
tects events by clustering documents (e.g., news stories)
based on semantics and timestamps [24, 18], while the latter
studies the temporal and document distributions of words
and discovers events of words [10, 14]. Considering th at
not every Flickr photo is related to some real-world event,
adopting a document-pivot approach and directly cluster-
ing photos based on content and timestamps may lead to
non-optimal results involving photos irrelevant with events.
Therefore, we follow the fashion of feature-pivot approaches
by detecting event-related tags before detecting photos of
events.
Our approach can be briefly described as follows. Given
a set of Flickr photos, with both user-supplied tags and
other metadata, including time and location (consisting of
latitude-longitude coordinates), the objective is to discover
a set of photo groups, where each group corresponds to
an event. Associated through photos, each tag usage oc-
currence can be attached with temporal and locational en-
codings. We simultaneously analyze the temporal and lo-
cational distributions of tag usage occurrences to discover
event-related tags with significant distribution patterns (e.g.
“bursts”) in both d imensions. We further examine the char-
acteristics of distribution patterns to distinguish between
tags of two categories: aperiodic-event-related and periodic-
event-related. Next, tags of the same event category are
clustered based on their temporal and locational distribu-
tions as well as photo distributions. Finally, for each tag
cluster, ph otos representing the particular event are extracted.
To summarize, this paper has the following three main
contributions: (1) We map each tag usage occurrence t o a
point in 3D space where dimensions represent latitude, lon-
gitude and time respectively. To the best of our knowledge,
our approach is the first effort, among feature-pivot event
detection approaches, which simultaneously considers the
temporal and locational distributions of features (tags). (2)
The robustness of our approach is strengthened by employ-
ing wavelet transform, which not only suppresses noise but
also provides multi-resolution analysis of t ag distributions.
(3) We implemented our Flickr event detection approach and
conducted experiments to evaluate the effectiveness of our
approach using a set of real data collected from Flickr.
The rest of this paper is organized as follows. I n Section 2,
related studies of event detection as well as collaborative
tagging data are reviewed. Section 3 defin es the research
problem investigated in this paper. In Section 4, we firstly
describe the main steps of the event d etection approach.
The details of each step is then illustrated respectively. Sec-
tion 5 presents the performance evaluation of our app roach.
Finally, some conclusive remarks are given in Section 6.
2. RELATED WORK
The problem of event detection is part of a broader ini-
tiative called Topic Detection and Tracking (TDT) [3]. The
objective of event detection is to discover new or previously
unidentified events, where each event refers to a specific
thing that h appen s at a sp ecific time and place [2]. In partic-
ular, event detection can be divided into two categories: ret-
rospective detection and on-line detection [24]. The former
refers to the detection of previously unidentified events from
accumulated historical collection, while the latter entails the
discovery of the onset of new events from live feeds in real-
time. Since our focus in this paper is retrospective event de-
tection, we here concentrate on representative retrospective
event detection approaches. As one of the very first several
efforts of event detection, in [24] a simple agglomerative clus-
tering algorithm, called augmented Group Average Cluster-
ing, is used to discover events from the corpus. A probabilis-
tic approach which models both content and time informa-
tion of documents explicitly is given in [18]. Recently, there
has been another research direction which detects events
from text streams using feature-pivot approaches. This line
of research is inspired by Kleinberg’s seminal work that de-
scribes extracting bursty features using an infinite automa-
ton model [17]. Fung et al. [10] proposed to identify bursty
features by using binomial distribution to model the occur-
rences of features, and cluster features based on document
distributions to generate bursty events. The work presented
by He et al. [14] also detects events by examining features
first. They analyzed every feature using Discrete Fourier
Transformation (DFT) and classified features to different
categories (e.g., important and unimportant events, peri-
odic and aperio dic events). Most of the existing approaches
focus on detecting events from news stories. In contrast,
our dataset is much more noisy for event detection. Not
every Flickr photo is related to some event. Consequently,
directly applying a document-pivot approach may generate
events (i.e., photo groups) containing photos irrelevant to
events. Due to the similar reason, existing feature-pivot
approaches which mainly rely on analyzing the temporal
distributions of features may not be robust enough. The
work [25] d escribed an interesting effort of detecting events
from web click-through data. Although click-through data
contain queries irrelevant to events, the proposed approach
directly clustered query-page pairs without add ressing the
issue of noise. Recently, Chen et al. [5] proposed to detect
events from the click-through data by transforming data to
a 2D polar space, where the angle and radius of each point
respectively reflects th e semantics and the t ime of a query
session. However, it may not be intuitive and sufficient to
represent the semantics of data in one dimension. In our
work, we analyze data in the 3D space where dimensions
reflect th e time and the location of data points directly.
Lately, known social networking websites like Del.icio.us
4
,
Flickr and Last.fm
5
have appeared which offer users the op-
portunity to tag web resources (bookmarks, images, audio
tracks, among others) by supplying textual labels. This ser-
vice has attracted not only individual users to contribute
tags but also researchers to investigate the structure, dy-
namics, and applications of collaborative tagging data. In [11],
the dyn amics of this collaborative system was examined us-
ing the tag data at the bookmarking site Del.icio.us. The
results demonstrate that tag distributions tend to stabilize
over time. Halpin et al. confirmed these results in [12] and
showed additionally t hat t ags follow a power law distribu-
tion. The wide usage of this emerging metadata has been
explored by various applications such as navigation [8], en-
terprise search [7] and web search [4]. One recent work,
which is most related to this paper, attempts to extract se-
mantics from Flickr t ags [20]. Specifically, the work aimed
to detect two types of t ags, place-related and event-related.
Although detecting event-related tags is one of the steps of
our approach, we could not apply their method directly be-
4
5
cause of the reasons given in Section 4.1. Furthermore, our
perspectives on tags and our ultimate research objectives are
different. They determined a tag as either event-related or
not. Considering the ambiguity and polysemy issues of tag
data, it is very likely that some of the usage occurrences of a
tag is irrelevant to the event, even if it is an “event-related”
tag. Only the occurrences of a tag which corresponds to
the event are interesting to us to finally discover photos of
events. There is also some research on Flickr data which
focuses on finding images of scenes and landmark [22, 16].
Such works usually rely on not only the user-supplied tags,
but also the content of images.
3. PRELIMINARIES
This section begins with a description of data representa-
tion, followed by a discussion of problem definition.
3.1 Data Representation
Let P denote a set of geo-referenced Flickr photos. Each
photo p
i
is associated with a location, (la(p
i
), lo(p
i
)), con-
sisting of latitude and longitude coordinates. The location
generally refers to the location where the photo was taken,
while sometimes marks the location of the photographed ob-
ject. Each photo is also associated with a timestamp, t(p
i
),
which usually refers to the time when the photo was taken,
although occasionally refers to the t ime when the photo was
uploaded to Flickr.
Let Q den otes a set of Flickr tags. Each photo p
i
∈ P
is associated with a subset of tags Q(p
i
) = {q
1
, q
2
, ··· , q
m
}
⊆ Q. Associated through a photo p
i
, a tag q
j
∈ Q(p
i
)
can be attached with the location and time of p
i
. A tag
q
j
∈ Q can be used to annotate more than one photo in
P. We use P (q
j
) to denote the set of photos annotated by
q
j
, s.t. P (q
j
) = {p
1
, p
2
, ··· , p
n
} ⊆ P. Accordingly, the tag
q
j
can be attached with a sequence of locations L(q
j
) =
{(la(p
1
), lo(p
1
)), (la(p
2
), lo(p
2
)), ··· , (la( p
n
), lo(p
n
))} and a
sequence of points in time T (q
j
) = {t(p
1
), t(p
2
), ··· , t(p
n
)}.
3.2 Problem Definition
As defined in [2], an event refers to a specific thing that
happens at a specific time and place. Hence, given a set
of photos, if it represents an event, it should at least sat-
isfy the following three constraints: (1) The group of photos
represents a specific thing. That is, the content of the pho-
tos should be semantically consistent. Since we represent
a photo as a set of t ags, this constraint regulates the tags
of the group of photos to be semantically similar. (2) The
group of photos should be taken within a certain time seg-
ment. (3) The group of photos should be taken around a
similar location.
Note that the event definition given in [2] mainly addresses
an aperiodic event. That is, the event happens only once
within some given time period. We are also interested in
discovering periodic events, which occurs regularly with cer-
tain fixed periodicity. Thus, the second constraint on the
time should be extended for periodic events. That is, the
group of photos should be t aken at a sequence of time points
with equal intervals.
Therefore, given a set of Flickr photos P, the problem we
address in this paper is to find subsets from P such that
each subset P
k
⊆ P is a set of photos satisfying either the
constraints of aperiodic events or the constraints of periodic
events.
4. EVENT DETECTION
In this section, we first d escribe the main steps of our
Flickr event detection approach. The details of each step
are then explained sequentially.
As mentioned before, considering not every Flickr photo
corresponds to some event, we follow the fashion of feature-
pivot approaches to detect event-related tags before detect-
ing events of photos. Then, the main steps of our event
detection approach are as follows.
1. Event Tag Detection. The objective of this step is to
analyze tags and discover those related with events. As
described above, each tag is associated with a sequence
of locations and a sequence of timestamps. We aim
to discover event-related tags based on their temporal
and locational distributions.
2. Event Generation. After detecting event-related tags,
we further distinguish between tags which are related
with periodic events and tags related with aperiodic
events. Then, tags representing the same events are
clustered. The clustering criteria should consider the
three constraints of an aperiodic or periodic event.
3. Event Photo Identification. Finally, for each tag
cluster which represents an event, the set of photos
corresponding to the event are retrieved.
4.1 Event Tag Detection
The objective of this step is similar to the existing work [20]
which ext racts event semantics from tags. We briefly de-
scribe their approach, called Scale-structure Identification
(SI), before highlighting th e limitations of this work. As
stated in [20], the number of usage occurrences for an event
tag should be much higher in a small segment of time than
the number of usage occurrences of that tag outside the seg-
ment. Therefore, SI analyzes the usage distributions of tags
along the time dimension. In particular, for each tag q, a
graph is constructed for the sequence of its associated time
points T (q) = {t(p
1
), ··· , t(p
n
)} where edges between points
exist if the points are closer together than some scale vari-
able r. Let S
r
be the set of connected subcomponents of
the graph. An entropy measure, E
r
=
S∈S
r
(|S|/|T (q)|)
log
2
(|T (q)|/|S|), is computed to evaluate how similar the
data is to a single cluster. If the entropy value is low, the
usage occurrences of the tag distribute closely and the tag
is possibly event-related.
Although th e method SI works well on a small dataset
used in [20], it is limited for a large set of data. It is known
that entropy measure is sensitive to noise, while tag data is
quite noisy considering the frequently cited ambiguity and
polysemy problems. For example, the tag bodybuilder was
used to annotate not only photos of the annual event“Muscle
Beach International Classic” but also photos of well muscled
persons. Thus, the entropy measure of this tag may not be
low enough so that the tag can be correctly identified as
event-related. Furthermore, SI considers the tag usage oc-
currences along the time dimension only. According to the
definition of events, the usage occurrences in the location
dimension can be exploited as well. For example, the num-
ber of usage o ccu rren ces for an event tag should be much
higher in a small region of location than the number of us-
age occurrences of t hat tag outside the region. Therefore, in
our work, we consider both the temporal and the locational
distributions of tag occurrences. In particular, we consider
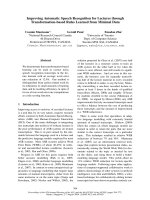
(a) usage occurrences in the original 3D space (b) surface plot in the original 3D space
Figure 1: Spatial distribution of usage occurrences of the example tag bodybuilder.
the two dimensions simultaneously by mapping each usage
occurrence of a tag to a point in the 3D coordinates.
Suppose a tag q is associated with a sequence of locations
L(q) = {(la(p
1
), lo(p
1
)), (la(p
2
), lo(p
2
)), ··· , (la( p
n
), lo(p
n
))}
and a sequence of times T (q) = {t(p
1
), t(p
2
), ··· , t(p
n
)}.
Each usage occurrence p
i
∈ P (q) will b e mapped to the point
(x, y, z) such that x = la(p
i
) −MIN
la
, y = lo(p
i
) −MIN
lo
,
and z = t(p
i
) − MIN
t
, where M IN
la
, MIN
lo
and MIN
t
are respectively the minimum latitude, minimum longitude,
and minimum time point of a given data set.
For example, Figure 1 (a) shows the usage occurrences of
the tag bodybuilder, assigned to photos with locations in the
United States and time points during the period from Jan
01, 2006 to Dec 31, 2007, in the 3D space. Note that, to show
the distribution clearly, we normalized the location and time
with respect to the minimum values of all occurrences of this
particular tag in the figure. This tag was assigned to 1090
photos, where multiple usage occurrences can be mapped to
the same point in space (e.g. users annotate a bunch of pho-
tos taken at the same location and same time with the same
tag). The minimum and max imum latitudes associated with
this tag are 30.273521 and 47.61552 respectively. The min-
imum and maximum longitude of this tag are −123.278885
and −74.187935 resp ectively. The minimum and maximum
time associated with this tag are 2006-07-11 12:34:36 and
2007-11-03 12:51:07.
After mapping the usage occurrences of a tag to points
in 3D space, the goal is to examine whether the distribu-
tion exhibits “dense spatial regions”. Note that, by con-
sidering the time and location dimensions simultaneously,
some false positive d ense segments discovered by SI can
be avoided. For example, we observe that 65 usage occur-
rences of the tag bodybuilder are mapped to a spatial region
([15, 16], [0, 1], [545, 546]), and 60 usage occurrences of this
tag are mapped t o the region ([12, 13], [40, 41], [545, 546]).
Since SI takes into account the time dimension (Z axis) only,
the two sets of occurrences will be merged and the time seg-
ment [545, 546] will probably be discovered as a dense one.
However, the usages actually occur at different locations. If
considered separately, each region may not be dense enough.
Although considering time and location dimensions simul-
taneously can improve the robustness of dense region detec-
tion to certain degree, there is still other noise hindering
the accurate discovery of dense regions in space. For exam-
ple, Figure 1 (b) is the surface plot of the usage occurrences
of the tag bodybuilder, where the significance of each point
(i.e., the number of usage occurrences corresponding to the
point) is normalized, with respect to the total number of
occurrences of the tag, and mapped to some color in the
attached color bar. The higher the color locates in the bar,
the more significant the point is. It can be observed that
many points represent very weak information. To further
suppress noise, a wavelet transform is used to detect dense
regions in a transformed space.
The employment of wavelet transform is motivated by the
observations in [21] as follows. Firstly, wavelet functions
emphasize regions where points cluster, and simultaneously
suppress weak information in their boundary. Consequently,
the dense regions in the original space become more salient
in the transformed space. Secondly, wavelet transform re-
moves noise in the original space, resulting in more accurate
dense region detection. Thirdly, wavelet transform provides
multiresolution analysis of signals. As mentioned in [20], the
selection of scale value is an important issues in examining
the distribution of occurrences. Thus, the multiresolution
property of wavelet transform can help detect dense regions
at different scales from fine to coarse. Finally, wavelet trans-
form can be computed efficiently.
Given a 1D inp ut signal s
0
, Discrete Wavelet Transform
(DWT) convolves it with a low-pass filter (scaling fun ction)
and a high-pass filter (wavelet function). The former gener-
ates an approximate signal s
1
by downsampling th e signal
by 2, while the latter extracts the difference between s
0
and
s
1
. The process is iterated downward on the approximate
signal generated by the low-pass filter. To apply wavelet
transform to our three dimensional data, we perform 1D
wavelet transform for each individual dimension, X, Y and
Z sequentially. That is, the process is iterated on the result-
ing approximate data generated by convolving the low-pass
filter to each dimension.
Considering th e data sparsity, we quantize the data in
the original 3D space before performing wavelet transform.
(a) surface plot of the distribution in the transformed space (b) significant subcomponents discovered in the original space
Figure 2: Wavelet transform and detected subcomponents of the example tag bodybuilder.
Specifically, we segment t he 3D space into cells by dividing
each dimension into intervals of equal size. For the latitude
and longitude dimensions (X and Y axes), we set the interval
size as 1. For the time dimension (Z axes), each interval
represents one day. We use C
i,j,l
to denote a cell which
occupies the ith interval of th e X axis, the jth interval of
the Y axis, and the lth interval of the Z axis (i, j, l ≥ 1). For
each cell, we consider the number of points inside the cell.
The total number of usage occurrences mapping to points
in this cell is denoted as V (C
i,j,l
).
The wavelet we used is Daubencies-4 [6], with its low-pass
and high-pass filters H and G as
H[0] = −G[3] = (1 +
√
3)/(4 ∗
√
2),
H[1] = G[2] = (3 +
√
3)/(4 ∗
√
2),
H[2] = −G[1] = (3 −
√
3)/(4 ∗
√
2),
H[3] = G[0] = (1 −
√
3)/(4 ∗
√
2)
After performing a wavelet transform along each dimen-
sion, the cells with weak wavelet coefficients in the trans-
formed space should be removed. In our work, we remove
a cell if its wavelet coefficient if less than the average coef-
ficient over non-empty cells. That is, we set the coefficient
of a cell as zero if V
′
(C
i,j,l
) <
V
′
(C
i,j,l
)
|{C
i,j,l
|V
′
(C
i,j,l
)=0)}|
, where
V
′
(C
i,j,l
) is the wavelet coefficient of the cell C
i,j,l
. Other-
wise, V
′
(C
i,j,l
) is reserved for subsequent transforms or set
to 1 if no further transform is performed. For example, Fig-
ure 2 (a) presents the surface plot of the usage occurrences
of the tag bodybuilder in the transformed space. Compared
with Figure 1 (b), fewer dense regions are observed because
weak information are removed by wavelet transform. Note
that, since we assign, in this example, value 1 to cells with
coefficient values greater than the threshold in the figure,
the color of the peaks does not reflect the significance of
cells anymore.
We then detect dense regions from the transformed space.
In particular, we construct a graph where each nonempty
cell, V
′
(C
i,j,l
) = 0, is modelled as a vertex. Edges between
two vertexes exist if the two vertexes representing adjacent
cells in space (i.e., two cells are adjacent if they locate in the
same 2 ×2 ×2 cu be). Then, we detect dense spatial regions
by finding connected subcomponents from the graph. We
discover connected subcomponents by scanning all cells in
the transformed space twice, extending the algorithm for
labelling connected components in a binary image [13].
Finally, we need to label back each subcomponent from
the transformed space t o the original space. That is, cells
in the original space belonging to the same subcomponent
should be identified. Note that, since we use the Daubencies-
4 wavelet, each cell in the original space is involved in at
most 2 ×2 × 2 cells in the transformed space. As we define
cells as neighbors if they are located in the same 2 × 2 × 2
cube, it can be proved that each cell in the original space is
assigned to at most one subcomponent in the transformed
space. In Figure 2 (b), the discovered subcomponents of
tag bodybuilder in the original space are depicted by colored
markers, while the hollow triangles denote the removed in-
significant occurrences. Compared with Figure 1 (b), it can
be observed that significant regions, with colors in the upper
part of the color bar, are correctly identified as significant
subcomponents.
Tags without any significant subcomponents are removed
as they are unlikely to be related with events. For the rest
of the tags, we further compute the mean and standard de-
viation for each significant subcomponent of each tag. That
is, each tag is associated with a set of significant subcom-
ponents {S
1
, S
2
, ··· , S
m
}, where each subcomponent S
i
is
associated with three pairs of values [(M
x
(S
i
), SD
x
(S
i
)),
(M
y
(S
i
), SD
y
(S
i
)), (M
z
(S
i
), SD
z
(S
i
))] representing respec-
tively the means and standard deviations of the subcompo-
nent along the three dimensions. These values will be used
in the next step of tag clustering.
4.2 Event Generation
The objective of this step is to cluster event-related tags,
detected by the first step, such that tags representing the
same event are grouped together. Since we are interested in
detecting not only aperiod ic but also periodic events, there
Location (15,0)
S
1
: 454
S
3
: 496
S
4
: 545
d
1
= 42
d
2
= 49
5.3)5.4549()5.4542(
2
1
)(
22
=−+−=dsd
1.9)5.45%20(
=
×
<
S
1
(15,0,454)
S
2
(17,1,475)
S
3
(15,0,496)
S
4
(15,0,545)
S
5
(3,4,510) (3,4,511) (3,4,512)
S
6
(5,8,572) (5,8,573)
S
7
(9,18,516) (9,18,517)
S
8
(12,40,545)
Subcomponents:
No.
cells
Figure 3: Examining periodicity of tag bodybuilder.
are basically the two following options. One is to cluster tags
and then examine the generated clusters to distinguish be-
tween aperiodic and periodic events; the other is to classify
tags as being related to either aperiodic or periodic events
and then cluster tags belonging to the same class. With the
focus on computation efficiency, we adopt the second solu-
tion as the clustering can be performed more efficiently with
reduced tag sets for periodic event generation, and reduced
tag subcomponents for aperio dic event generation. Conse-
quently, we start with a description of periodic-event-related
tag identification before presenting the tag clustering.
Given the set of tags generated by the first step, we iden-
tify tags related with periodic events using the following cri-
teria. In the first place, only tags with at least two subcom-
ponents are taken into account. Then, for each tag, suppose
it has a set of subcomponents S = {S
1
, S
2
, ··· , S
n
}. Start-
ing from t he first subcomponent S
1
, we create a timeline
array initialized with the first entry of the value M
z
(S
1
),
which is the mean time when the first subcomponent occurs.
For every other subcomponent S
i
∈ S, if its corresponding
location and that of S
1
overlap each other, we register its cor-
respond ing time in the array. That is, if [M
x
(S
1
)−SD
x
(S
1
),
M
x
(S
1
) +SD
x
(S
1
)] ∩ [M
x
(S
i
) −SD
x
(S
i
), M
x
(S
i
) +SD
x
(S
i
)]
= ∅ and [M
y
(S
1
) −SD
y
(S
1
), M
y
(S
1
) +SD
y
(S
1
)] ∩ [M
y
(S
i
) −
SD
y
(S
i
), M
y
(S
i
) + SD
y
(s
i
)] = ∅, we add M
z
(S
i
) into the
timeline array and remove S
i
from S.
For each timeline array with more than one entry, we check
the time distance between entries. Particularly, considering
our two years’ worth of data crawled from Flickr, if there
are only two entries in the array, we examine whether the
distance between the two entries is between [350, 380]. If it
is, the tag is probably related with an annual event. If the
array has more than two entries (supposing that entries are
ordered by time), we calculate the standard deviation of the
distances between every two adjacent entries. If the stan-
dard deviation is small (e.g., less than 20% of the average
distance between every two adjacent entries), the subcompo-
nents occur almost regularly in time. We then pred ict that
the tag is probably related with periodic events. For exam-
ple, Figure 3 shows the set of 8 significant subcomponents
of the tag bodybuilder detected by the first step. It can be
observed that only one timeline array, associated with the
location (x = 15, y = 0), can be created with more than one
entry. As shown in the figure, sub components S
1
, S
3
, and
S
4
are involved in the timeline array, with means of time as
454, 496 and 545 respectively. Since the standard deviation
of the two distances (e.g., 3.5) is less than the 20% of the
average distance (e.g., 9.1), bodybuilder is identified as a tag
related with periodic events.
Once a tag is identified as being related with periodic
events, the sub components, which correspond to the en-
tries in the timeline array and pass the regularity checking,
are used to generate periodic events. The rest subcompo-
nents of the tag are preserved for the generation of aperiodic
events. We perform clustering on tags of each category to
generate events. In particular, we cluster tags based on the
three constraints specified by the event definition. Consid-
ering the first constraint, each tag cluster, representing an
event, should be semantically consistent. Similar to the ex-
isting works [10, 14], we measure the semantic similarity
between tags based on their associated photos. Given two
tags q
i
, q
j
, the semantic similarity between them, denoted
as SemSim(q
i
, q
j
), is defined as
SemSim(q
i
, q
j
) =
|P (q
i
) ∩ P (q
j
)|
min{|P (q
i
)|, |P (q
j
)|}
(1)
where P (q
i
), P (q
j
) are the sets of photos annotated by q
i
and q
j
respectively. The more photos annotated by both q
i
and q
j
, the more semantically similar are the two tags.
Considering the second and the third constraints of the
event defi nition, the usage occurrences of tags of a cluster
representing an aperiodic (or periodic) event should man-
ifest one (or more than one) dense region around similar
time and similar location. Namely, if two tags are related
to the same event, their associated subcomponents should
distribute along the time dimension and location dimensions
similarly. Thus, we define the spatial distance between two
tags q
i
and q
j
, denoted as SpaDist(q
i
, q
j
), based on the KL-
divergence of Normal densities. Given two Normal densities
with mean and standard deviation as (m
i
, sd
i
) and (m
j
,
sd
j
), the KL-divergence between the two densities is [19]
KL
N
(m
i
, sd
i
; m
j
, sd
j
) =
1
2
(log(
sd
2
j
sd
2
i
) +
sd
2
i
sd
2
j
+
(m
i
− m
j
)
2
sd
2
j
− 1) (2)
Given two subcomponents of two tags S
q
i
and S
q
j
, we
use KL-divergence to measure their distance in three dimen-
sions. That is,
KL(S
q
i
|S
q
j
) = KL
N
(M
x
(S
q
i
), SD
x
(S
q
i
); M
x
(S
q
j
), SD
x
(S
q
j
))
+KL
N
(M
y
(S
q
i
), SD
y
(S
q
i
); M
y
(S
q
j
), SD
y
(S
q
j
))
+KL
N
(M
z
(S
q
i
), SD
z
(S
q
i
); M
z
(S
q
j
), SD
z
(S
q
j
)) (3)
Since KL-divergence is asymmetric, we define the distance
between two subcomponents as D(S
q
i
, S
q
j
) = max{KL(S
q
i
|
S
q
j
), KL(S
q
j
|S
q
i
)}.
Suppose tag q
i
is associated with subcomponents {S
1
, S
2
,
··· , S
n
}, and tag q
j
is associated with subcomponents {V
1
,
V
2
, ··· , V
m
}, where 1 ≤ n ≤ m. Then, the spatial distance
between tags q
i
and q
j
is defined as
SpaDist( q
i
, q
j
) =
n
k=1
D(S
k
, V
l
) (4)
where V
l
= arg min
1≤l≤m
D(S
k
, V
l
). That is, for each sub-
component of tag q
i
, we search for the most similar sub-
component of tag q
j
. The value of spatial distance is non-
negative.
Combining the semantic similarity and the spatial dis-
tance between two tags, we define the similarity between
two tags q
i
and q
j
as
S(q
i
, q
j
) =
SemSim(q
i
, q
j
)
1 + SpaDist(q
i
, q
j
)
(5)
The value of S(q
i
, q
j
) ranges in [0, 1]. We employ the simple
and effective den sity-based clustering method, DBSCAN [9],
to cluster tags, where the required distance metric is sup-
plied with 1 −S(q
i
, q
j
).
For each generated tag cluster E = {q
1
, q
2
, ··· , q
n
}, we
compute a measure Pr(E) to evaluate how likely the cluster
represents a real event. In our work, we define Pr(E) as the
average pair-wise tag similarity in th e cluster.
P r(E) =
2
q
i
,q
j
∈E,q
i
=q
j
S(q
i
, q
j
)
|E|(|E| − 1)
(6)
The higher the value of P r(E), the more similar th e tags in
a cluster. The more does the cluster satisfy the constraints
of the event definition, the more likely it is related to some
real event.
4.3 Event Photo Identification
The last step of our approach is t o find photos represent-
ing the detected events. Note that, directly retrieving photos
annotated by tags of a generated tag cluster may lead to sub-
optimal results considering that not every usage occurrence
of an event related tag is related to some event. Therefore,
we aim to decide the time and the location of each event
represented by a tag cluster. Afterwards, only photos asso-
ciated with both event related tags as well as event related
time and location will be returned.
For an aperiodic event, by aligning the subcomponents of
tags of a tag cluster, there may exist more than one spatial
region covered by overlapped subcomponents of at least two
tags. We decide the time and location of the event by select-
ing the most significant spatial region. The significance of a
spatial region is defined as follows. Let G be a spatial region
covered by overlapped subcomponents of t ags {q
1
, ··· , q
m
}
belonging to a tag cluster E = {q
1
, ··· , q
n
}. Let La(G),
Lo(G) and T (G) respectively represent the latitude, longi-
tude and time range covered by G. Then, the significance of
G is
W (G) =
m
n
×
m
j=1
|P
′
(q
j
)|
n
j=1
|P (q
j
)|
(7)
where P
′
(q
j
) = {p
i
|p
i
∈ P (q
j
), la(p
i
) ∈ La(G), lo(p
i
) ∈
Lo(G), t(p
i
) ∈ T(G)}. That is, the significance of the region
is decided by not only the percentage of tags whose sub com-
ponents are covered by the region, but also the percentage
of photos occurring in the region.
For a periodic event, we align the subcomponents of tags
similarly. Recall that, after identifying tags related with
periodic events, only subcomponents with regular time in-
tervals are preserved. Therefore, we simply align subcom-
ponents of tags so that similar subcomponents, in terms of
their means in three dimensions, are grouped to represent
the periodic occurrences of the event.
After determining the time and location of each event,
we retrieve photos whose time and location match with the
event’s attributes. Furthermore, photos should be annotated
by at least one tag of the correspond in g cluster.
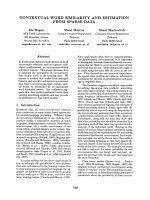
Figure 4: Periodic Event Example with tags f1, for-
mulaone, and unitedstatesgrandprix.
5. EVALUATION
In this section we evaluate the performance of our ap-
proach for detecting events of Flickr photos. We start with
the description of the data set used in the experiments, fol-
lowed by an analysis of an exemplary event. Next, we exam-
ine the quality of detected events with respect to associated
tags and associated p hotos. We also compare the perfor-
mance of our approach with SI, t he existing work which
detects event semantics from Flickr tags [20].
5.1 Data set
We crawled geo-tagged photos from the Flickr site us-
ing the available Flickr API. Specifically, we collected pho-
tos from the two-year-period starting at Jan 01, 2006, until
Dec 31, 2007. We also limited ourselves to photos taken in
the United States. For each ph oto, we extracted its user-
supplied English tags. A total 7, 405, 135 photos were col-
lected, where 2, 680, 640 photos belong to the year 2006 and
4, 724, 495 photos were taken in 2007. These photos cover a
temporal range of 730 days. The average number of photos
per day is 10, 144, with a minimum of 1, 571 and a maxi-
mum of 40, 238. The locational area covered by the pho-
tos has the minimum latitude 18.91113 and maximum lati-
tude 71.38854, and minimum longitude −177.8916 and max-
imum longitude −66.95. These photos are annotated with
44, 139, 261 tags. Among this set, 907, 197 tags are unique.
On average, each photo is annotated with 5.96 tags, with
a minimum of 1 and a maximum of 226. Each tag is used
to ann otate 48.65 photos on average and at m ost 507, 051
photos (i.e., the tag 2007).
5.2 Example of a Detected Event
To demonstrate the results generated by our approach,
we show a detected event by plotting its associated loca-
tions in Google map and its associated occurring time. Fig-
ure 4 presents one detected periodic event represented by
three tags: f1, formulaone and unitedstatesgrandprix. The
upper part of the figure shows the detected lo cations of t he
event, while the lower part indicates the occurring t ime of
Periodic Event Tags housewarming, bigbear, skysinger, i ndigogirls, deathvalleynationalpark, legionofdoom, westtexas, califor-
niaadventure, ames, samantha, dealsgap, grandam, bymiketravis, detourart, adamhubenig, chincoteague,
nights, paragliding, leavenworth, thebigapple
Aperiodic Event Tags bourbonstreet, nueva, theindigogirls, p ortage, mountdesertisland, tueam, threatdottv, shores, sams, ska,
sebastian, boone, dnalounge, greatscott, worldinferno, dawnanddre w, delraybeach, doorcounty, ig, south-
padreisland
Table 2: Top 20 event tags detected by SI, where tags in bold are true positives. Tag grandam refers to the
car racing event. Tag nights is related to the event of Hollywood nights.
Periodic Events
Rank 1 - 10 11 - 20 21 - 30 31 - 40 41 - 58
No. of events 7 10 10 10 15
Aperiodic Events
Rank 1 - 10 11 - 20 21 - 30 31 - 40 41 - 50
No. of events 7 6 7 7 4
Table 1: Distributions of periodic and aperiodic
event tag clusters.
the event by drawing the temporal distributions of the three
tags. It can be observed from the figure that t his event oc-
curs around the In dianapolis Motor Speedway. It happened
twice in the time period we studied, days 180-183 and days
530-534, which respectively correspond to July 2006 and
June 2007. Clearly, the detected tags, location and time
comply with the real event “The United States Grand Prix”.
5.3 Tag-based Results
We firstly evaluated the results of tag clusters. For this, we
processed tags with at least 100 usage occurrences. A total
493 periodic tags are detected. We performed clustering on
periodic tags by setting the two DBSCAN parameters Eps
and MinPts to 0.8 and 2 respectively. The results contain
58 clusters. Since no ground truth data is available, we
manually checked each of the clusters. Out of the 58 clusters,
we found only 6 clusters are unrelated to events. (Interested
users are referred to our online interface [1] to browse all of
the detected events.) Thus, the precision of our approach
for periodic event detection is approximately 89.66%. We
concentrate on precision here rather than recall because it
is usually infeasible to manually label all events in a huge
image collection. As pointed out in [22], t he sheer volume
of content associated with each tag makes it hard to browse
all relevant content.
We further ranked tag clusters according to Equation 6,
and presented the distribution of true positive event clusters
in the upper part of Table 1. We noticed that in the top 10
tag clusters, 3 of them are irrelevant to events. By checking
associated photos, we found t hat these non-event clusters
mainly contained albums of photos regularly uploaded by
some photographer and annotated with same tags such as
the different abbreviations of the ph otographer’s name (e.g.,
danielhartwig, danielwaynehartwig, and danielwhartwig). Con-
sequently, such tags have similar temporal and locational
distributions as well as similar associated photos, which leads
our approach to detect them as events by error and mistak-
enly ranked them high. The upper part of Table 3 lists the
detected top 14 periodic events. It can be observed from
Table 3 that our approach is rather accurate in detecting
the location of events as well as th e periodicity of events. A
notable cluster is the event E
7
. Although the event E
7
is
a periodic event indeed, it actually starts from 2007. How-
ever, our approach detected that it started from 2006 be-
cause some user mistakenly specified the year as 2006 when
uploading photos of this event. Note that, we still consider
this cluster as a true positive when evaluating the precision
of our approach, because the error is caused by the input
data instead of the algorithm itself.
A total 22, 974 aperiodic tags are involved in the genera-
tion of aperiodic events. For aperiodic tags, we performed
clustering with Eps and MinPts as 0.9 and 3 respectively.
We manually examined the top 50 clusters and listed the
distribution of true p ositives in the lower part of Table 1.
Not surprisingly, the performance is worse than that of pe-
riodic event detection, because periodic event detection has
extra constraints on the temporal regularity of tag usage oc-
currences. Note that, the results given in the lower part of
Table 1 is obtained by considering public events only. The
precision of our approach is even better if personal events,
such as wedding ceremonies and birthday parties, are con-
sidered as true positive as well. Table 3 presents the top 14
tag clusters representing aperiodic events in the bottom.
We also implemented the existing method SI [20] which
identifies event-related Flickr tags and assigns confidence
scores to tags. Table 2 respectively lists the top 20 (from
left to right) periodic event related tags and aperiodic event
related tags returned by SI. Unfortunately, only two tags,
within the top 20 periodic tags, are related with periodic
events. (Note that, SI is able to identify more event-related
tags. However, according to the confidence scores assigned
by the SI method , these event-related tags are ranked lower
than many tags which are irrelevant with events.) As we
analyzed before, the main reason that SI can’t handle large
dataset well is that tags are noisy, while the SI method based
on entropy measure and temporal analysis solely is sensitive
to noise.
5.4 Photo-based Results
In order to evaluate the detected event photos, we attempt
to conduct a user study to evaluate photos returned for top
10 periodic events and top 10 aperio dic events. For each
event, we aim t o diversify the results by retrieving p hotos
satisfying the requirements of time and location of the event
and annotated with at least one tag of the cluster. How-
ever, we observed that: (1) For each of the top 10 aperiodic
events, all photos are uploaded by the same user for the
same event, even if we retrieve photos by requesting that
the photo needs to be annotated by only one tag of the clus-
ter. This ind icates that there exists no false positive photos
which accidently satisfy the requirements of tags, time and
location of these events. (2) For top 10 periodic events, only
the events E
3
, E
4
, E
7
, E
8
and E
10
have photos uploaded
by different users when fewer number of tags of a cluster is
required. By taking a closer look at the photos uploaded
by different users, we found they are all relevant with the
events. Both observations indicate that our approach rarely
returns false positive photos. Furthermore, our app roach
is able to retrieve all true positive photos as long as ph o-
tos are associated with correct metadata. We still involved
twenty users to evaluate photo-based precision through the
online system [1]. Although all photos are related with cor-
respond ing events, users sometimes t hink d ifferently. For
example, some u sers assessed a photo of the audience of a
football match as being unrelated with the event. Accord-
ing to users, the average precision of periodic events and
aperiodic events are 88% and 91% respectively.
6. CONCLUSIONS
Detecting events from image collection is not only an in-
teresting problem but also an advantageous task which fa-
cilitates a number of applications in image retrieval systems.
In this paper, we address this problem by exploiting multi-
ple sources of metadata associated with photos on an im-
age community website Flickr. Specifically, we make use
of the available user-contributed social tags to capture th e
content of photos. We rely on the metadata of time and
location to analyze the distribution of photos through tags.
The fact that not every photo is related to some real event
poses challenges in handling noise. Our approach attempts
to overcome this problem by taking a few measures, includ-
ing simultaneously considering time and location dimensions
and performing wavelet transform. A timeline array is em-
ployed to efficiently classify tags as either perio dic or aperi-
odic event related. Tags of each category are then clustered
based on the constraints specified by the event definition.
Event photos are then determined by event tag clusters, as
well as the time and location attributes of events. Evaluated
on a set of real Flickr data, our approach exhibits high ac-
curacy in detecting periodic events. Although our approach
is a bit less accurate in detecting aperiodic events, it is still
much more effective t han the existing approach. Further-
more, our approach retrieves photos related to discovered
events precisely.
7. ACKNOWLEDGEMENT
This work is funded by the European Commission under
Pharos (IST 045035).
8. REFERENCES
[1] Flickr event detection, />lchen/FlickrEvent.
[2] J. Allan, J. G. Carbonell, G. Doddington, J. Yamron,
and Y. Yang. Topic detection and tracking pilot study:
Final report. In DARPA Broadcast News
Transcription and Understanding Workshop, 1998.
[3] J. Allan, R. Papka, and V. Lavrenko. On-line new
event detection and tracking. In SIGIR, 1998.
[4] S. Bao, G R. Xue, X. Wu, Y. Yu, B. Fei, and Z. Su.
Optimizing web search using social annotations. In
WWW, pages 501–510, 2007.
[5] L. Chen, Y. Hu, and W. Nejdl. Deck: Detecting events
from web click-through data. In ICDM, pages
123–132, 2008.
[6] I. Daubencies. Orthonormal bases of compactly
support wavelets. Comm. Pure Applied Mathematics,
41(909-996), 1988.
[7] P. A. Dmitriev, N. Eiron, M. Fontoura, and E. J.
Shekita. Using ann otations in enterprise search. I n
WWW, pages 811–817, 2006.
[8] M. Dubinko, R. Kumar, J. Magnani, J. Novak,
P. Raghavan, and A. Tomkins. Visualizing tags over
time. In WWW, pages 193–202, 2006.
[9] M. Ester, H P. Kriegel, J. Sander, and X. Xu. A
density-based algorithm for d iscovering clusters in
large spatial databases with noise. In KDD, pages
226–231, 1996.
[10] G. P. C. Fung, J. X. Yu , P. S. Yu, and H. Lu.
Parameter free bursty events detection in text
streams. In VLDB, pages 181–192, 2005.
[11] S. A. Golder and B. A. Huberman. The structure of
collaborative tagging systems. CoRR, abs/cs/0508082,
2005.
[12] H. Halpin, V. Robu, and H. Shepherd. The complex
dynamics of collaborative tagging. In WWW, pages
211–220, 2007.
[13] R. M. Haralick and L. G. Shapiro. Computer and
Robot Vision. Addison-Wesley Longman Publishing
Co., Inc., Boston, MA, USA, 1992.
[14] Q. He, K. Chang, and E P. Lim. Analyzing feature
trajectories for event detection. In SIGIR, pages
207–214, 2007.
[15] Y. Jing and S. Baluja. Pagerank for product image
search. In WWW, pages 307–316, 2008.
[16] L. S. Kennedy and M. Naaman. Generating diverse
and rep resentative image search results for landmarks.
In WW W, pages 297–306, 2008.
[17] J. M. Kleinberg. Bursty and hierarchical structure in
streams. Data Min. Knowl. Discov., 7(4):373–397,
2003.
[18] Z. Li, B. Wang, M. Li, and W Y. Ma. A probabilistic
model for retrospective news event detection. In
SIGIR, 2005.
[19] W. D. Penny. Kullback-liebler divergences of normal,
gamma, dirichlet and wishart densitites, 2001.
Technical report.
[20] T. Rattenbury, N. Good, and M. Naaman. Towards
automatic ext raction of event and place semantics
from fl ickr tags. In SIGIR, pages 103–110, 2007.
[21] G. Sheikholeslami, S. Chatterjee, and A. Zhang.
Wavecluster: A wavelet based clustering approach for
spatial data in very large databases. VLDB J.,
8(3-4):289–304, 2000.
[22] I. Simon, N. Snavely, and S. M. Seitz. Scene
summarization for online image collections. In ICCV,
2007.
[23] C. Wang, L. Zhang, and H J. Zhang. Learning to
reduce the semantic gap in web image retrieval and
annotation. In SIGIR, pages 355–362, 2008.
[24] Y. Yang, T. Pierce, and J. G. Carbonell. A study of
retrospective and on-line event detection. In SIGIR,
pages 28–36, 1998.
[25] Q. Zhao, T Y. Liu, S. S. Bhowmick, and W Y. Ma.
Event detection from evolution of click-through data.
In KDD, pages 484–493, 2006.
No. Event Tags Time Location (la, lo) Event Descripti on
E
1
partnershipwalk akf agakhanfoun-
dation
10/29/2006,
11/10/2007
(29.719322, -95.37212) Partnership Walk is an initiative of Aga Khan Foun-
dation USA to raise funds and awareness to help com-
munities in Africa and Asia. It i s held annually at
Atlanta, Chicago, Dallas, Houston, Los Angeles.
E
2
southoaklandcountysoccer soc s
storm95
09/15/2007,
09/22/2007,
09/29/2007,
10/07/2007
(42.49387, -83.20573) Weekly games of team SOCS Storm95 i n south oak-
land country soccer club in 2007.
E
3
crosswalkamerica crosswalk
scottgriessel creatista griessel
07/02/2006,
08/01/2006,
08/20/2006,
09/01/2006,
07/02/2007,
08/06/2007,
08/23/2007,
09/01/2007
(33.99294, -110.07808) Crosswalk is a journey made by a couple of progressive
Christians who trekked across the country from April
to September. Griessel is the photographer of this
walk.
E
4
f1 formulaone unitedstatesgrand-
prix
07/02/2006,
06/17/2007
(39.693844, -86.23974) The United States Grand Prix was a Formula One
race held on July 2, 2006, and June 15-17, 2007, at
the Indianapolis M otor Speedway.
E
5
asl northpark deaf gpcc d 04/22/2006,
04/14/2007
(34.239143, -116.894745) The annual ASL fundraising picnic party at Pitts-
burgh North Park hosted by GPCCD in Apri l.
E
6
beachjam amusementrides
moreyspiers wildwood beachjam
amusements beachcamping
05/20/2006,
05/20/2007
(38.987007, -74.81043) The Beach Jam is an annual camping event on the
Wildwood, NJ, beach at Morey’s Piers that includes
amusement rides. There is a 3-day Spring Beach Jam
before Memorial Day.
E
7
tei tei07 tei2007 02/06/2006,
02/16/2007
(30.413836, -91.18605) The fir st international conference on Tangible and
Embedded Interaction was held Feb 15-17, 2007 in
Baton Rouge, Louisiana.
E
8
greeksing fraternities sororities 03/25/2006,
03/24/2007
(40.445274, -79.95632) Greek Sing is an annual tradition among the Greek
community of Carnegie Mellon University. Each year
in March, fraternities and sororities take the stage to
perform in a musical variety show.
E
9
naia nationaltournament universi-
tyofillinoisatspringfield uofispring-
field uis prairiestars
03/17/2006,
03/16/2007
(39.097984, -94.58649) The Prairie Stars of University of Illinois at Spring-
field engaged in the national tou r nament.
E
10
emmylouharris hardlystrictlyblue-
grassfestival
10/07/2006,
10/06/2007
(37.769943, -122.48955) Hardly strictly bluegrass festival is an annual free
show in October in Golden Gate Park.
E
11
fatima ironworks gi lmanton needs
ec
08/15/2006,
08/15/2007
(43.39858, -71.29895) Camp Fatima, located in Gilmaton Iron Works, of-
fers two separate camps for children with disabilities:
Special Needs and Exceptional Citizens
E
12
camporee encampment danielboone
patriotdays d anielboonehomestead
douglassville patriotdaysencamp-
ment
06/11/2006,
06/10/2007
(40.29097, -75.794846) Patriot Days Encampment is an annual event where
youth groups gathe r in June in Pennsylvania to share
a unique camping exp erience.
E
13
highgear april 04/21/2006,
04/28/2007
(40.25634, -76.648605) High gear is an annual event held April, in Hershey
PA, to provide training for students to serve Jesus in
the local church.
E
14
kishimoto laura laurakishimoto
tallisscholarssummerschool laurak-
ishimotoca tallisscholars tsss
08/03/2006,
08/03/2007
(47.462914, -122.34424) Tallis Scholars Summer Schools held one week be-
tween July and August in Seattle.
E
1
epiphanymagazine epiphanycoffee-
house evangeluniversity
09/28/2007 (37.221394, -93.263176) Epiphany coffeehouse is the event held in the Evangel
University to enrich the social and academic life of
the campus.
E
2
photoemagery mikekelly adagerd
michaelkelly
06/23/2007 (38.883015, -77.17191) A perform given by a nervy collection of all-out per-
forming talent, held in Hillwood, Falls Church.
E
3
youthaids equalitycenter globalin-
diafund
11/17/2007 (38.906803, -77.038055) On November 17, 2007 the Global India Fund official
launch took place at the Human Rights Campaign
Equality Center in Washington, DC.
E
4
tdttailgating tailgatin g2007 tower-
drivetigerfanz fluidvapor
09/08/2007 (30.413197, -91.17831) The official unveiling of the Tower Drive Tigerf anz
logo and shirts of LSU tiger team.
E
5
schoolsports spirts wideouts
delawarestate delawarefootball
udee
09/14/2007 (39.661327, -75.74867) NCAA American football match between Del aware
Blue Hens and Rhode Island in 2007.
E
6
fragmentsofeternity bayofblood
magegame
06/09/2007 (28.063185, -82.41247) This event is about a role-playing game, Mage: The
Awakening.
E
7
skippack brucecastor uppermerion
montgomerycountysheriff
10/25/2007 (40.230827, -75.40429) Pennsylvania State Police Memorial.
E
8
poomse palgwe taeguk 10/13/2007 (26.697426, -80.24021) Florida Martial Arts Tournaments for the Competi-
tive Martial Artist.
E
9
cornitems shellers cornitemcollec-
tors
10/19/2007 (38.538147, -90.16575) Seed Corn Collectibles Auction, Illinions
E
10
starguitar b urstgenerator golden-
path chems galvanize heyboyhey-
girl doitagain
09/25/2007 (41.96798, -87.65954) Chemical Brothers Live Show in Chicago, Sep. 2007.
E
11
putnamcou ntyflorida bluecrabfesti-
val palatkaflorida
09/28/2007 (29.646088, -81.629105) Blue Crab Festival in Palatka, FL, for Memorial Day
Weekend.
E
12
paulbuentello alistairovereem bob-
bysouthworth cungle
11/16/2007 (37.33256, -121.90103) Strikeforce is an American professional kickboxing
and mixed martial arts promotion based in San Jose,
California.
E
13
hms sauiling starof hmsrose 11/10/2007 (32.666916, -117.21022) HMS Surprise Sails with the Star of India on 10
November 2007.
E
14
jacksonvilephotographymeetupgroup
holidayregatta nightoflights
12/08/2007 (29.897257, -81.311) Annual Nights of Lights Celebration in St. Augustine,
Florida.
Table 3: Top 14 periodic event tags in the upper part and top 14 aperiodic event tags in the lower part.
Columns respectively show tags, means of time and location values of the detected events, and brief descrip-
tions of the real events.