Exploring the volatile profile of whiskey samples using solid-phase microextraction Arrow and comprehensive two-dimensional gas chromatography-mass spectrometry
Bạn đang xem bản rút gọn của tài liệu. Xem và tải ngay bản đầy đủ của tài liệu tại đây (3.29 MB, 13 trang )
Journal of Chromatography A 1676 (2022) 463241
Contents lists available at ScienceDirect
Journal of Chromatography A
journal homepage: www.elsevier.com/locate/chroma
Exploring the volatile profile of whiskey samples using solid-phase
microextraction Arrow and comprehensive two-dimensional gas
chromatography-mass spectrometry
Antonio Ferracane a,b, Natalia Manousi b,c, Peter Q. Tranchida a, George A. Zachariadis c,
Luigi Mondello a,d,e, Erwin Rosenberg b,∗
a
Department of Chemical, Biological, Pharmaceutical and Environmental Sciences, University of Messina, Messina, Italy
Institute of Chemical Technology and Analytics, Vienna University of Technology, Getreidemarkt 9/164, Vienna 1060, Austria
c
Laboratory of Analytical Chemistry, Department of Chemistry, Aristotle University of Thessaloniki, Thessaloniki 54124, Greece
d
Chromaleont s.r.l., c/o Department of Chemical, Biological, Pharmaceutical and Environmental Sciences, University of Messina, Messina, Italy
e
Department of Sciences and Technologies for Human and Environment, University Campus Bio-Medico of Rome, Rome, Italy
b
a r t i c l e
i n f o
Article history:
Received 4 March 2022
Revised 10 June 2022
Accepted 11 June 2022
Available online 15 June 2022
Keywords:
Whiskey
Solid-phase microextraction Arrow
Volatile organic compounds
Comprehensive two-dimensional gas
chromatography
Flavour analysis
a b s t r a c t
We present a novel sample preparation method for the extraction and preconcentration of volatile organic compounds from whiskey samples prior to their determination by comprehensive two-dimensional
gas chromatography (GC × GC) coupled to mass spectrometry (MS). Sample preparation of the volatile
compounds, important for the organoleptic characteristics of different whiskeys and their acceptance and
liking by the consumers, is based on the use of the solid-phase microextraction (SPME) Arrow. After
optimization, the proposed method was compared with conventional SPME regarding the analysis of different types of whiskey (i.e., Irish whiskey, single malt Scotch whiskey and blended Scotch whiskey)
and was shown to exhibit an up to a factor of six higher sensitivity and better repeatability by a factor
of up to five, depending on the compound class. A total of 167 volatile organic compounds, including
terpenes, alcohols, esters, carboxylic acids, ketones, were tentatively-identified using the SPME Arrow
technique, while a significantly lower number of compounds (126) were determined by means of conventional SPME. SPME Arrow combined with GC × GC-MS was demonstrated to be a powerful analytical
tool for the exploration of the volatile profile of complex samples, allowing to identify differences in
important flavour compounds for the three different types of whiskey investigated.
© 2022 The Authors. Published by Elsevier B.V.
This is an open access article under the CC BY license ( />
1. Introduction
Whiskey is a type of distilled alcoholic beverage produced from
fermented grain mash and it is considered to be one of the most
popular alcoholic beverages worldwide [1]. For the production of
whiskey, ground cereals and/or malt are mixed with water to produce a mash that is further fermented with yeast. Subsequently,
the resulting mixture is distilled to produce a distilled spirit that
is finally stored in barrels [2]. Typically, wooden casks produced
from charred white oak are employed for the aging process of the
final product [1]. The volatile profile of distilled spirits depends
on the raw materials used for their production, their manufacturing procedure (i.e., fermentation, distillation, and storage) and their
aging process [3]. Whiskey contains a high number of volatile or∗
Corresponding author.
E-mail address: (E. Rosenberg).
ganic compounds (VOCs) that contribute to its aroma and the most
abundant among them are esters and alcohols. Other compounds
that contribute to the overall aroma of whiskeys include aldehydes,
ketones, furanic compounds, terpenes and sulphur compounds [4].
The volatile composition of distilled spirits is directly associated
with their acceptance by the consumers. Thus, the determination
of VOCs in alcoholic beverages is of the utmost importance for the
evaluation of their quality and their safety and for the understanding of their sensory properties [3,5,6].
One-dimensional gas chromatography hyphenated to a mass
spectrometer (GC-MS) or to an olfactometric detector are two wellestablished analytical techniques for the determination of aroma
compounds in complex food samples [7,8]. However, the application of these techniques for the analysis of complex food samples,
containing a plethora of VOCs, can result in insufficient separation
and co-elution of the target analytes due to sheer sample complexity [9]. To overcome these potential drawbacks, comprehensive
/>0021-9673/© 2022 The Authors. Published by Elsevier B.V. This is an open access article under the CC BY license ( />
A. Ferracane, N. Manousi, P.Q. Tranchida et al.
Journal of Chromatography A 1676 (2022) 463241
two-dimensional gas chromatography (GC × GC) can be employed.
In GC × GC, analytes are typically separated using a conventional
polar or non-polar column, followed by a micro-bore capillary column of different polarity [9]. For this purpose, a modulator (transfer device) is used for trapping and re-injecting the eluent from
the exit of the primary column to the head of the second column within some milliseconds [9,10]. Among the different types
of GC × GC systems, GC × GC equipped with cryogenic modulators
are typically preferred, since they offer the advantages of enhanced
sensitivity [9]. Additionally, GC × GC coupled to mass spectrometry (GC × GC–MS) forms a powerful analytical tool for the profiling
and fingerprinting of food and beverage VOCs [11].
Currently, the exploration of opportunities of novel green microextraction protocols combined with GC × GC is considered
to be an important step towards the development of more
environmentally-friendly methodologies and towards the simplification of complex workflows [10]. In this context, solid-phase microextraction (SPME), proposed by Pawliszyn in the early 1990s
[12], is until now the most explored format of microextraction technique coupled to both one-dimensional GC, as well as
heartcut- and comprehensive two-dimensional GC [10]. SPME exhibits a plethora of benefits including ease of automation, reduced
number of sample preparation steps and solvent-free nature [13].
However, the utilization of conventional SPME fibers also exhibits
some fundamental drawbacks that are associated with poor mechanical durability and low extraction phase volume [14]. More
recently, the SPME Arrow was proposed as an alternative sample preparation technique to conventional SPME. In the SPME Arrow approach, extraction of the target analytes takes place using a coated fiber with an Arrow-shaped tip attached to a robust stainless-steel backbone [6]. This technique can overcome the
shortcomings of conventional SPME fibers, while it maintains its
main benefits. Thus, the SPME Arrow is characterized by good mechanical robustness and enhanced sensitivity due to the higher extraction phase area and volume.
Due to its inherent advantages, the SPME Arrow has already
proven to be a versatile analytical technique for the determination
of VOCs in a wide variety of environmental, food, herbal and forensic samples [14–17]. Until now, most applications of SPME Arrow
have been focused on the analysis of food samples including grape
skins [18], brown rice vinegar [5], milk [6], Korean salt–fermented
fish sauce [19], soy sauce [20] and fish samples [21]. Recently, the
applications of SPME Arrow have been successfully expanded to
the analysis of distilled spirits (i.e., Korean Soju liquor [3] and Chinese Baijiu liquor [22]). Thus, this technique can be a promising
alternative to already existing conventional methodologies for the
determination of VOCs in whiskey samples.
In this study, SPME Arrow combined with GC × GC–MS was
employed for the first time for the exploration of the volatile profile of whiskey samples. The main parameters affecting the performance of the microextraction protocol were thoroughly investigated and optimized. Under optimum conditions, the herein proposed protocol was compared with the conventional SPME technique, to assess the difference of this technique in terms of method
repeatability and sensitivity. The ability of the proposed method
for the determination of molecules that remain undetermined
with conventional SPME was also investigated using three different types of whiskey samples (i.e, “blended Scotch whiskey”, “Irish
whiskey” and “single malt Scotch whiskey”).
H3 PO4 (85%) and reagent grade KH2 PO4 were purchased from
Sigma-Aldrich (Steinheim, Germany). 3-methyl-3-pentanol (purity
98.0%) was also supplied by Sigma-Aldrich and was used as internal standard (ISTD). A stock solution (20 0 0 mg L−1 ) of the ISTD
was prepared in methanol and was 10-fold diluted to prepare a
working ISTD solution at a concentration of 200 mg L−1 . Finally, a
C7 –C30 alkane mixture was purchased from Supelco (Bellefonte, PA,
USA) and was employed for the calculation of the linear retention
indices.
The carbon wide range (WR)/polydimethylsiloxane (PDMS)
SPME Arrow fibers of 1.1 mm outer diameter and 120 μm phase
thickness were purchased from Restek Corporation (Bellefonte, PA,
USA). A Restek PAL SPME Manual Injection Kit (Restek Corporation, Bellefonte, PA, USA) was also employed for the extraction and
the desorption of the VOCs of the whiskey samples. Conventional
carboxen (CAR)/PDMS SPME fibers of 75 μm phase thickness were
purchased from Supelco (Bellefonte, PA, USA) and they were attached to an SPME fiber holder (Supelco) for the extraction procedure. Prior to the extraction, the SPME Arrow fibers and the conventional SPME fibers were preconditioned in the injector port of
the GC system based on the recommendations of the manufacturers. The quality of the conditioning process was confirmed by
taking fiber blanks prior to the analysis. All extractions were performed using an IKA® RCT basic magnetic stirrer (IKA Labortechnik, Staufen, Germany).
2.2. Instrumentation
A GC × GC–MS system consisting of a GC-2010 Shimadzu gas chromatograph equipped with a split/splitless injector and a QP2010 Ultra quadrupole mass spectrometer (Shimadzu Corporation, Kyoto, Japan) was used. An Rtx-5MS column
30 m × 0.25 mm ID, 0.25
μm df , (Crossbond 5% diphenyl-95%
dimethyl polysiloxane) (Restek Corporation, Bellefonte, PA, USA)
was used as first dimension and was connected to an uncoated
capillary column (1 m × 0.25 mm ID). A dual-stage loop-type cryogenic modulator (Zoex Corporation, Houston, TX) was installed in
the GC × GC–MS system and the uncoated tubing was further connected to a Stabilwax®-MS 2 m × 0.15 mm ID, 0.15 μm df column (Crossbond Carbowax polyethylene glycol) (Restek Corporation). Helium (99.999%) was employed as carrier gas at 61.8 kPa at
the beginning of the analysis (constant linear velocity mode). The
injector temperature was set at 280 °C and the split mode was employed as injection mode, at a split ratio of 25:1. The initial oven
temperature was 40 °C which was kept constant for 5 min. After
this time span, the temperature was raised to 230 °C using a ramp
of 5 °C min−1 and further increased to 250 °C using a ramp of
50 °C min−1 . The total run time was 48.40 min. The working parameters of the cryogenic modulator were the following: modulation period: 4 s, hot jet temperature: 350 °C and hot jet duration:
250 ms.
With regard to the MS system, the scan mode with a mass
range of m/z 45–445 was employed. The scan speed of mass analyzer was set at 20,0 0 0 amu s−1 (33 Hz spectral acquisition frequency). The ionization mode was electron ionization (70 eV), the
ion source temperature was 200 °C, while the interface source
temperature was 250 °C. System control and data handling were
performed using the GCMS solution software ver. 4.5., while
the bidimensional chromatograms were generated by using the
ChromSquare software ver. 2.3 (Shimadzu Europe, Duisburg, Germany). The tentative identification of the VOCs was carried out
by using the “W11N17” (Wiley11-Nist17, Wiley, Hoboken, NJ, USA;
Mass Finder 3) and “FFNSC 4.0” (Shimadzu Europa GmbH, Duisburg, Germany) mass spectral libraries. The use of linear retention
indices in GC × GC was applied as previously explored by Purcaro [23]. Regarding the use of LRIs and mass spectra similarity,
2. Experimental
2.1. Chemicals and reagents
LC-MS CHROMASOLVTM grade methanol was purchased from
Honeywell (Riedel-de Haën GmbH, Seelze, Germany). Concentrated
2
A. Ferracane, N. Manousi, P.Q. Tranchida et al.
Journal of Chromatography A 1676 (2022) 463241
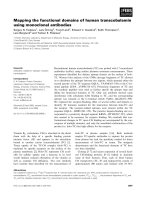
Fig. 1. Evaluation of different NaCl concentrations (n = 3). Sample volume: 35 mL,
ethanol concentration: 12% v/v, pH: 3.3, adsorption time: 45 min, stirring rate:
500 rpm.
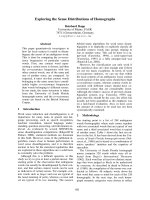
Fig. 3. Evaluation of different extraction times (n = 3). Sample volume: 35 mL,
ethanol concentration: 12% v/v, pH: 3.3, stirring rate: 500 rpm, NaCl concentration:
30% w/v.
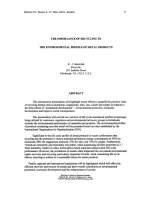
Fig. 4. Comparison of method sensitivity between SPME Arrow and conventional
SPME.
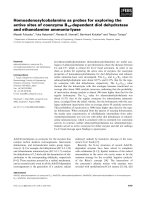
Fig. 2. Evaluation of different stirring rates (n = 3). Sample volume: 35 mL, ethanol
concentration: 12% v/v, pH: 3.3, adsorption time: 45 min, NaCl content: 30% w/v.
a matching interval of ± 20 and a similarity value of at least 80%
were applied, respectively.
2.3. Sample collection
In this study, three different types of whiskey samples, namely
“blended Scotch whiskey”, “Irish whiskey” and “single malt Scotch
whiskey” were collected from the local market of Vienna, Austria,
and analyzed. Before their analysis, all samples were stored in the
dark at ambient temperature.
2.4. Extraction of VOCs from whiskey samples
Prior to the determination of the VOCs of whiskey samples, the
samples were diluted with 25 mmol L−1 phosphate buffer (pH 3.3)
to obtain a final ethanol content of 12% v/v [24]. For the SPME
Arrow procedure, an aliquot of 35 mL of the diluted sample was
placed in a 50 mL glass (headspace) vial. The sample was saturated
Fig. 5. Comparison of method repeatability between SPME Arrow and conventional
SPME techniques for different classes of chemical compounds.
3
A. Ferracane, N. Manousi, P.Q. Tranchida et al.
Journal of Chromatography A 1676 (2022) 463241
Fig. 6. Representative SPME Arrow / GC × GC–MS chromatogram of Blended Scotch whiskey. The three figures represent the retention time sections (a)–(c). Note that the
retention time of the 1st dimension separation (x-axis) is given in minutes, that of the 2nd dimension separation (y-axis) in seconds.
4
A. Ferracane, N. Manousi, P.Q. Tranchida et al.
Journal of Chromatography A 1676 (2022) 463241
Fig. 6. Continued
with NaCl (30% w/v) and 70 μL of the ISTD working solution was
added in the samples. Subsequently, the samples were closed with
polytetrafluoroethylene (PTFE) coated silicone rubber septum aluminium caps. The extraction of the analytes was performed within
60 min at room temperature under constant stirring at 500 rpm,
while desorption took place in the GC injection port for 2 min. After this time span, the SPME Arrow fiber remained in the injector
for 10 more minutes for cleaning and was thus ready to be used
for the next extraction.
The extraction conditions of the conventional SPME procedure
were similar to those of the SPME Arrow procedure, to enable the
comparison of the two techniques.
the sample headspace to avoid possible oxidative alteration of the
volatiles pattern and to represent as closely as possible the authentic whiskey flavour [9].
The selection of the appropriate fiber coating plays a crucial role in the development of an SPME method. The chemical nature and the volatility of the target analytes in the investigated samples determines the type of coating used [26]. In
this work, the semi-polar CAR/PDMS fibers were used for the extraction of the volatile compounds of the whiskey samples. This
fiber has been previously reported to be an appropriate choice for
the extraction of the VOCs from whiskey samples, showing good
sensitivity towards hydrocarbons, monoterpenes, carbonyl compounds, higher alcohol acetates and isoamyl esters [24,26]. This
extraction phase exhibits good sensitivity for smaller molecules,
acids, esters and non-polar compounds and thus it serves as a
good option for the extraction of a wide range of volatile flavour
compounds [27]. It is assumed that the fibre coatings for the
classical SPME and the SPME Arrow exhibit comparable properties and hence enrichment behavior, irrespective of the actual
format.
During method optimization, all tests were carried out using the same whiskey sample (i.e., blended Scotch whiskey) for
the reason of comparability. Six analytes from different chemical
classes and consequently different chemical properties (i.e., volatility and polarity) were monitored during the optimization study.
These compounds included two esters (i.e., octanoic acid ethyl ester and nonanoic acid ethyl ester), one carbonyl compound (i.e.,
2-nonanone), one organic acid (i.e., dodecanoic acid) and two alcohols (i.e., 1-octanol and 1-decanol). Due to the different abundances of the monitored analytes, normalization of their peak areas was performed by dividing the peak area obtained under the
examined conditions with their respective peak area under optimum/selected conditions.
3. Results and discussion
3.1. Optimization of the SPME Arrow conditions
To ensure high method sensitivity, the main parameters that
affect the extraction performance of the SPME Arrow method were
thoroughly investigated and optimized using the one-variable-ata-time (OVAT) approach. In this frame, the effect of the extraction
time, the stirring rate and the salt content on the extraction efficiency were independently examined, while the remaining factors remained constant. Prior to each extraction, the whiskey samples were diluted to an ethanol content of 12% v/v, as suggested
by Caldeira et al. [24] to minimize sensitivity loss for most VOCs
and the sample pH was adjusted to 3.3. Adjusting the pH of the
sample prior to the SPME procedure can enhance the sensitivity
and selectivity for organic acids, which are present in whiskey
samples [25]. An aliquot of 35 mL of the diluted whiskey sample was used for the SPME Arrow procedure [24]. With regard
to the extraction temperature, no sample heating was employed
and all extractions were carried out at ambient temperature from
5
A. Ferracane, N. Manousi, P.Q. Tranchida et al.
Journal of Chromatography A 1676 (2022) 463241
Table 1
Comparative study of SPME Arrow and conventional SPME for the analysis of whiskey samples. The table reports the peak area values for those peaks that have been
tentatively identified by their mass spectra and retention indices.
Nr.
Compound
LRI
1
2
3
4
5
6
7
8
9
10
11
12
13
14
15
16
17
18
19
20
21
22
23
24
25
26
27
28
29
30
31
32
33
34
35
36
37
38
39
40
41
42
43
44
45
46
47
48
49
50
51
52
53
54
55
56
57
58
59
60
61
62
63
64
65
66
67
68
69
70
71
Heptane
3-Ethoxy-3-methyl-1-butene
Ethyl propanoate
Propyl acetate
1,1-Diethoxyethane
3-Methyl-1-butanol
Ethyl isobutyrate
Isobutyl acetate
Octane
Ethyl butanoate
Hexanal
1,1-Diethoxypropane
1-(1-Ethoxyethoxy)-propane
Butyl acetate
1-Ethoxy-3-methyl-but-2-ene
Ethyl-2-methylbutanoate
Furfural
Ethyl-3-methylbutanoate
1,1-Diethoxy-2-methyl-propane
Ethylbenzene
Isobutyl propionate
Amyl acetate
1-(1-Ethoxyethoxy)butane
Styrene
Acetyl valeryl
2-Heptanone
Ethyl pentanoate
3-Methyl-1-hexanol
1,3-Diethoxybutane
Heptanal
p-Xylene
Heptan-2-ol
Furfuryl ethyl ether
Ethyl-2-methyl-2-butenoate
1,1-Diethoxy-2-propanone
1,1-Diethoxy-3-methyl-butane
α -pinene
3-Methyl-nonane
2-Methyl-1,3-pentanediol
1-Heptanol
Acetaldehyde ethyl-isoamyl-acetal
Benzaldehyde
1-Octen-3-ol
Pentyl propanoate
3-Octanone
6-Methyl-hept-5-en-2-one
2-Pentylfuran
Myrcene
Ethyl-(E)-4-hexenoate
2,6-Dimethyl-2,4,6-octatriene
Isooctanol
Decane
Ethyl hexanoate
(S)-2-Octanol
1-(1-Ethoxyethoxy)-pentane
1,1-Diethoxy pentane
Dehydro-cis-linalool oxide
Octanal
3-Carene
Hexyl acetate
Isopentyl isobutyrate
Benzofuran
1,2,3-Trimethylbenzene
2-Ethyl-1-hexanol
Limonene
2,2,6-Trimethyl-cyclohexanone
Ethyl-hex-(2E)-enoate
p-Cymene
Ethyl-2-furoate
Isopentyl butyrate
2-Octenal
700
700
708
715
721
733
752
768
800
803
805
805
805
813
817
842
845
850
851
857
863
871
872
891
885
887
889
896
904
906
907
913
917
938
941
946
948
951
959
960
960
960
969
984
986
986
991
991
992
993
995
1000
1003
1004
1004
1004
1006
1006
1009
1012
1014
1018
1020
1030
1030
1035
1041
1042
1053
1054
1058
Blended Scotch
Irish
Single malt Scotch
ARROW
Conv.
ARROW
Conv.
ARROW
Conv.
73,034
189,651
3,682,418
408,318
1,422,4188
256,740,608
1,661,640
7,806,245
213,278
9,581,642
847,079
113,351
88,966
118,631
220,572
1,924,584
970,286
3,944,547
2,522,513
175,601
84,585
646,506,264
297,147
70,022,248
201,739
541,075
2,646,562
624,101
380,783
508,578
1,434,986
1,711,569
490,305
6,572,391
644,324
513,950
2,321,991
396,420
1,688,544
117,136
2,380,969
68,001
306,259
339,480
369,126,970
929,777
366,816
363,538
440,951
1,048,031
12,306,645
159,020
165,970
1,154,270
765,378
682,130
331,099
100,440
644,764
45,053,251
776,523
1,416,587
220,643
200,786
275,377
532,723
235,489
87,683,226
304,844
191,952
427,767
226,207
645,396
1,204,577
266,241
470,475
245,865
49,266,562
83,225
2,027,077
761,385
438,193
109,855
-
63,179
971,281
2,812,5510
137,905
116,978,703
426,900,243
1,203,447
1,177,424
941,190
5,927,820
2,050,915
200,224
371,070
2,891,763
5,516,170
458,982
8,322,583
2,330,023
510,481
17,662,980
882,779
394,642
369,344
3,308,238
1,253,761
825,853
3,396,283
1,982,383
2,923,117
8,770,094
563,397
2,262,277
7,819,253
2,707,909
2,189,878
377,336
121,816
132,070
1,541,199
692,199
308,637,512
294,376
78,204
114,247
112,708
1,480,107
229,674
1,000,981
190,798
126,085
790,488
724,476
205,783
126,316
5,819,773
9,099,701
59,850,519
136,227
62,249
742,485
1,118,996
367,268
430,786
177,450
663,528
153,047
123,485
1,524,849
96,283
341,939
107,887
672,604
356,563
356,778
721,220
185,386
637,891
1,253,642
177,810
11,4646
252,517
105,565
27,909,070
922,615
143,596
143,801
153,352
184,940
-
3,519,745
17,576,932
1,050,679,561
5,527,551
327,235
13,154,245
1,595,564
2,419,673
3,388,896
2,120,634
789,921,174
259,240
1,415,508
3,079,270
202,172
66,9864
143,433
1,551,749
1,033,854
1,012,049
2,392,095
3,452,251
599,152
654,185,383
357,653
698,921
6,366,443
271,163
14,998,434
718,317
723,842
82,612
-
634,104
660,341
120,195,386
2,061,469
158,871
1,726,130
758,566
418,175
94,097,412
73,988
188,182
169,610
420,468
80,747
1,927,031
333,375
265,470
13,307,1449
654,919
916,037
60,941
2,898,160
560,294
591,419
-
(continued on next page)
6
A. Ferracane, N. Manousi, P.Q. Tranchida et al.
Journal of Chromatography A 1676 (2022) 463241
Table 1 (continued)
Nr.
Compound
LRI
ARROW
Conv.
ARROW
Conv.
ARROW
72
73
74
75
76
77
78
79
80
81
82
83
84
85
86
87
88
89
90
91
92
93
94
95
96
97
98
99
100
101
102
103
104
105
106
107
108
109
110
111
112
113
114
115
116
117
118
119
120
121
122
123
124
125
126
127
128
129
130
131
132
Ethyl-4-methylhexanoate
1-Octanol
1,1,3-Triethoxypropane
Hexanal diethyl acetal
(E)-Hept-4-enoate
2-Nonanone
Propyl hexanoate
Undecane
Ethyl heptanoate
Linalool
3-Methylbutyl 2-methylbutanoate
2-Nonanol
Nonanal
Heptyl acetate
1,1,3-Triethoxybutane
2-Ethyl-1,4-dimethyl-benzene
Methyl octanoate
Acetic acid, 2-ethylhexyl ester
Ethyl benzoate
(E)-2-Nonenal
Linalool ethyl ether
1-Nonanol
Diethyl butanedioate
Butyl hexanoate
1,1-Diethoxy-Heptane
3-Decanone
(Z)-4-Octanoate
Octanoic acid
Dodecane
Ethyl octanoate
Ethyl-oct-(2Z)-enoate
Decanal
Benzenecarboxylic acid
Octyl acetate
Ethyl-2-methyloctanoate
1,3-bis(1,1-Dimethylethyl)-benzene
Ethyl-oct-(2E)-enoate
Isopentyl hexanoate
2-Phenylethyl acetate
(Z)-4-Decen-1-ol
Ethyl benzeneacetate
Isopropyl phenylacetate
Citronellyl formate
Methyl 3-phenylpropionate
1-Decanol
Vitispirane
3-Nonenoate
2-Undecanone
Ethyl nonanoate
Tridecane
2-Undecanol
Nonyl acetate
Methyl decanoate
β -Methyl-γ -octalactone
Citronellyl acetate
Ethyl-3-phenylpropionate
cis-Geranyl acetate
Butyl octanoate
9-Decenoic acid
(Z)-4-Decenoate
1,2-Dihydro-1,1,6-trimethylnaphthalene
Decanoic acid
Ethyl decanoate
Tetradecane
Dodecanal
Decyl acetate
3-Methylbutyl octanoate
Ethyl-trans-2-decenoate
trans-Geranylacetone
(E)-β -Farnesene
Methyl-undeca-(2Z,4Z)-dienoate
1-Dodecanol
Ethyl-undec-10-enoate
1068
1076
1079
1088
1091
1093
1096
1100
1101
1101
1104
1105
1107
1114
1115
1119
1125
1150
1160
1163
1166
1176
1183
1183
1190
1190
1191
1192
1200
1202
1203
1208
1213
1214
1218
1249
1250
1252
1259
1266
1266
1273
1275
1276
1278
1286
1290
1294
1297
1300
1303
1313
1327
1344
1350
1359
1361
1381
1386
1389
1396
2,124,966
505,162
3,415,551
153,613
1,985,618
108,711
204,490
5,460,882
1,374,987
487,331
908,425
1,234,407
260,604
317,363
72,056
6,420,703
806,573
471,401
121,760
897,646
516,083
391,776
292,691
5,247,366
491,936
1,586,412,800
583,503
5,635,838
777,128
209,798
3,269,618
341,228
104,823,707
6,837,285
1,200,514
1,161,833
620,010
19,361,719
87,079
144,167
147,747
574,098
497,000
247,167
83,142
5,614,739
4,127,094
1,703,448
-
621,420
724,253
1,577,250
134,603
445,004
396,729
135,217
4,445,586
577,159
232,367
217,340
212,168
146,313
5,046,693
388,723
1,114,327,809
579,501
3,213,238
6,233,912
158,193
1,834,900
6,7891,244
4,070,032
817,574
782,295
12,368,239
111,004
416,983
387,769
171,528
3,879,198
3,247,172
1,301,762
-
45,938,779
3,743,836
525,494
6,008,143
2,501,447
585,203
16,152,079
111,827
1,046,514
1,050,184
758,691
225,873
435,423
215,001
1,136,036
1,838,957
181,521
572,073
3,576,155
243,726
1,194,340
1,137,944,977
106,819
517,484
1,580,340
524,954
3,229,506
815,996
803,975
351,406
705,516
4,458,914
2,180,266
2,558,468
212,448
32,324,905
428,587
2,474,887
976,818
14,805,595
3,784,060
192,516
783,055
435,208
434,619
186,761
3,067,650
445,572
478,641
97,083
302,040
105,868
324,909
510,407
237,643
1,424,090
227,258
765,292
765,514,793
466,111
996,999
306,725
1,860,017
433,043
383,459
2,376,529
1,581,599
1,428,374
106,238
2,0328,920
305,472
804,813
839,976
11,169,603
2,978,127
186,698
11,844,895
400,875
1,204,467
325,664
5,454,688
7,388,299
6,251,635
621,552
7,145,584
18,912,350
293,265
2,808,640
3,243,909
1,197,768
8,185,114
246,297
1,528,553
471,828
579,307
367,096
1,341,827
25,292,71,628
59,1550
7,111,540
7,710,664
529,670
4,707,274
250,282,814
1,616,740
403,966
160,716,786
31,309,218
1,132,083
6,404,575
25,977,921
210,016
769,175
939,055
140,122
9,144,770
24,674,526
-
2,008,432
76,961
827,439
64,717
1,612,116
2,232,399
1,069,449
2,796,054
765,960
242,326
1,695,570
363,845
139,854
1,452,982
1,097,424
202,562
232,318
367,096
740,272
881,782,120
346,170
4,664,672
3,210,691
198,640
1,902,631
99,953,771
381,081
9,903,634
450,811
2,353,697
11,187,761
105,679
301,298
263,066
69,264
3,457,942
18,044,741
-
1398
1399
1400
1410
1412
1446
1447
1450
1452
1470
1476
1485
49,808,638
2,113,245,433
368,498
4,455,537
36,406,688
588,635
134,860
108,075
137,982
1,518,159
88,516
25,278,501
3,475,267,362
229,772
3,135,322
25,351,152
425,400
96,899
1,108,395
-
20,431,211
1,497,463,092
365,783
171,560
4,781,894
904,613
117,608
604,838
170,534
15,686,902
1,520,138,861
387,097
180,723
4,934,941
824,999
463,566
228,980
137,475,276
2,137,248,679
4,240,662
38,297,774
952,380
223,443
-
22,340,012
1,335,001,224
1,815,455
16,545,348
387,768
174,269
-
133
134
135
136
137
138
139
140
141
142
143
144
Blended Scotch
Irish
Single malt Scotch
Conv.
(continued on next page)
7
A. Ferracane, N. Manousi, P.Q. Tranchida et al.
Journal of Chromatography A 1676 (2022) 463241
Table 1 (continued)
Nr.
Compound
LRI
145
146
147
148
149
150
151
152
153
154
155
156
157
158
159
160
161
162
163
164
165
166
167
Propyl decanoate
Undecyl methyl ketone
Ethyl-undecanoate
Tridecanal
Isobutyl decanoate
3,5-bis(1,1-Dimethylethyl)-phenol
(E)-Nerolidol
cis-5-Dodecenoic acid
Methyl tridecanoate
Dodecanoic Acid
Ethyl dodecanoate
Lauryl acetate
Tetradecanal
Phenethyl-hexanoate
Isoamyl decanoate
Propyl dodecanoate
Isobutyl laurate
Farnesyl acetate
Isopentyl dodecanoate
Phenylethyl-octanoate
Ethyl-(E)-11-hexadecenoate
Ethyl-9-hexadecenoate
Ethyl hexadecanoate
1487
1495
1498
1516
1545
1555
1561
1578
1580
1581
1598
1610
1614
1643
1644
1680
1744
1846
1846
1848
1986
1986
1993
Blended Scotch
Irish
Single malt Scotch
ARROW
Conv.
ARROW
Conv.
ARROW
2,485,987
202,513
2,792,411
211,534
5,457,541
1,512,300
460,827
2,418,664
588,572,307
533,326
123,069
519,570
13,653,735
164,735
197,222
248,585
153,281
675,037
672,880
3,340,669
-
1,482,612
128,644
144,5825
4,464,081
842,382
2,290,054
585,470,244
453,090
486,864
13,459,306
139,418
151,408
420,758
1,314,151
-
2,474,762
738,062
802,946
1,228,875
370,531,682
1,793,787
-
631,066
516,504
147,996
309,865,147
1,149,205
-
3,263,535
218,512
1,393,231
94,013
8,903,720
731,681,168
606,016
430,502
2,275,755
1,285,178
Conv.
1,047,891
93,779
121,172
2,184,079
354,099,250
263,360
117,825
1,072,366
1,057,578
LRI: linear retention index
∗
Bold: most abundant compounds
3.1.1. Optimization of salt content
The salt content of the SPME Arrow procedure was investigated
by adding different quantities of sodium chloride. Salt addition can
reduce the solubility of the target analytes in the sample matrix,
allowing them to be sorbed onto the fibre and thus resulting in enhanced extraction efficiency [28]. In this work, three different NaCl
concentrations (i.e., 0, 15 and 30% w/v) were evaluated. Extraction
of the target analytes took place within 45 min under constant stirring at 500 rpm. As shown in Fig. 1, sample saturation with 30%
w/v NaCl resulted in increased extraction efficiency for most analytes (i.e., 2-nonanone, dodecanoic acid, 1-octanol and 1-decanol).
Thus, further experiments were conducted using a NaCl content of
30% w/v.
between 15 and 60 min. As shown in Fig. 3, equilibrium was obtained at 30 min for nonanoic acid ethyl ester and at 45 min for
1-octanol. On the other hand, an increase of the extraction time
up to 60 min has a positive impact on the extraction efficiency
of 2-nonanone, dodecanoic acid, octanoic acid ethyl ester and 1decanol. This observation can be attributed to the difference of
volatility between the monitored analytes. An increase of the extraction time can enhance the extraction efficiency of compounds
with high boiling point, while compounds with lower boiling point
may remain unaffected as they reach equilibrium already after a
shorter time [32]. Likewise, the equilibration time is also known
to increase with an increasing fibre/headspace partition coefficient.
Since adequate sensitivity was obtained at 60 min and to ensure
an acceptable cycle time, an extraction time of 60 min was finally
chosen.
3.1.2. Optimization of stirring rate
The stirring rate of the SPME procedure was also investigated.
For this purpose, three different stirring rates (i.e., 250 rpm “weak
stirring”, 500 rpm “medium stirring” and 10 0 0 rpm “intensive stirring”) were evaluated. Sample agitation can enhance the extraction, especially for analytes with higher molecular mass [29]. The
extraction of the target analytes was carried out for 45 min using a sample containing 30% w/v NaCl. Fig. 2 summarizes the results of the evaluation of the different stirring rates. As it can be
observed, the extraction efficiency increased by increasing the stirring rate from 250 rpm to 500 rpm. However, a further increase up
to 10 0 0 rpm had a negative impact on the extraction efficiency. A
likely explanation is that at higher stirring rates significantly more
ethanol is transferred to the headspace, and may then compete
with the other VOCs for the adsorption sites, because ethanol is
present in whiskey at a concentration much higher than the aroma
volatiles [30]. As a result, a stirring rate of 500 rpm was finally
chosen.
3.2. Comparison of conventional SPME and SPME Arrow
The performance evaluation of the conventional SPME and
SPME Arrow, under their respective optimum conditions, was carried out taking into consideration the total number of VOCs identified in different whiskey samples, as well as the sensitivity and
the precision of the two techniques. Table 1 presents the VOCs
that were identified in the whiskey samples by means of the SPME
Arrow and a conventional SPME fiber of comparable enrichment
phase. Values are reported as peak area results in this table, while
the relative results, reported as area% are reported in the electronic
supplementary material (Table S1).
As it can be observed, a total of 167 VOCs were identified
for the three different varieties of whiskeys using the SPME Arrow, while only 121 VOCs were identified when the conventional SPME fiber was utilized. SPME Arrow enables the determination of compounds (e.g., 2-octenal, 3-ethoxy-3-methyl-1-butene,
isopentyl-butyrate, heptan-2-ol, hexanoic acid butyl ester, etc.) that
are present in whiskey samples, even though their identification
under the same experimental conditions was not possible when
conventional SPME was used.
Accordingly, SPME Arrow and conventional SPME were compared in terms of their overall sensitivity. For this purpose, a
3.1.3. Optimization of extraction time
Finally, the effect of the extraction time on the SPME Arrow
method was investigated. Similarly to conventional SPME, it is important to find the optimum extraction time that ensures the extraction of the maximum amounts of analytes, leading to a high
sensitivity [31]. In this study, extraction times were investigated
8
A. Ferracane, N. Manousi, P.Q. Tranchida et al.
Journal of Chromatography A 1676 (2022) 463241
Table 2
Analysis of whiskey samples by SPME Arrow combined with GC × GC–MS, expressed as the normalised peak area ratio normalized to the internal standard, 3-methyl-3pentanol.
Nr.
Compounds
Blended Scotch [rel.
intensity±SD]
Irish [rel.
intensity±SD]
Single malt Scotch
[rel. intensity±SD]
1
2
3
4
5
6
7
8
9
10
11
12
13
14
15
16
17
18
19
20
21
22
23
24
25
26
27
28
29
30
31
32
33
34
35
36
37
38
39
40
41
42
43
44
45
46
47
48
49
50
51
52
53
54
55
56
57
58
59
60
61
62
63
64
65
66
67
68
69
70
71
72
Heptane
3-Ethoxy-3-methyl-1-butene
Ethyl propanoate
Propyl acetate
1,1-Diethoxyethane
3-Methyl-1-butanol
Ethyl-isobutyrate
Isobutyl acetate
Octane
Ethyl butanoate
Hexanal
1-(1-Ethoxyethoxy)-propane
1,1-Diethoxy-propane
Butyl acetate
1-Ethoxy-3-methyl-but-2-ene
Ethyl-2-methylbutanoate
Furfural
Ethyl 3-methylbutanoate
1,1-Diethoxy-2-methyl-propane
Ethylbenzene
Isobutyl propionate
Amyl acetate
1-(1-Ethoxyethoxy)butane
Acetyl valeryl
2-Heptanone
Ethyl pentanoate
Styrene
3-Methyl-1-hexanol
1,3-Diethoxybutane
Heptanal
-Xylene
Heptan-2-ol
Furfuryl ethyl ether
Ethyl-2-methyl-2-butenoate
1,1-Diethoxy-2-propanone
1,1-Diethoxy-3-methyl-butane
α -pinene
3-Methyl-nonane
2-Methyl-1.3-pentanediol
1-Heptanol
Acetaldehyde ethyl-isoamyl acetal
Benzaldehyde
1-Octen-3-ol
Pentyl propanoate
3-Octanone
6-Methyl-hept-5-en-2-one
2-Pentylfuran
Myrcene
Ethyl (E)-4-hexenoate
2,6-Dimethyl-2,4,6-octatriene
Isooctanol
Decane
Ethyl hexanoate
(S)-2-Octanol
1-(1-Ethoxyethoxy)-pentane
1,1-Diethoxy-pentane
Dehydro-cis-linalool oxide
Octanal
3-Carene
Hexyl acetate
Isopentyl Isobutyrate
Benzofuran
1,2,3-Trimethyl-benzene
2-Ethyl-1-hexanol
Limonene
2,2,6-Trimethyl-cyclohexanone
Ethyl-hex-(2E)-enoate
p-Cymene
2-Ethyl-furoate
Isopentyl butyrate
2-Octenal
Ethyl-4-methylhexanoate
0.064 ± 0.002
0.032 ± 0.002
0.628 ± 0.190
0.069 ± 0.014
2.421 ± 0.562
43.691 ± 8.662
0.033 ± 0.002
109.605 ± 4.324
0.075 ± 0.020
0.669 ± 0.061
0.015 ± 0.004
0.019 ± 0.004
0.020 ± 0.003
0.042 ± 0.004
0.327 ± 0.035
0.428 ± 0.037
0.100 ± 0.013
0.014 ± 0.004
62.590 ± 2.991
0.050 ± 0.008
0.034 ± 0.001
0.092 ± 0.003
0.062 ± 0.010
11.871 ± 0.476
0.105 ± 0.022
0.086 ± 0.009
0.020 ± 0.006
0.164 ± 0.014
0.290 ± 0.006
0.083 ± 0.017
0.037 ± 0.009
0.058 ± 0.001
0.155 ± 0.031
0.110 ± 0.029
0.067 ± 0.005
0.286 ± 0.006
0.023 ± 0.013
0.405 ± 0.066
0.062 ± 0.004
0.052 ± 0.014
0.027 ± 0.002
0.099 ± 0.002
0.087 ± 0.002
0.116 ± 0.023
0.158 ± 0.028
0.080 ± 0.008
0.178 ± 0.043
2.088 ± 0.140
0.283 ± 0.061
17.806 ± 2.443
0.393 ± 0.006
0.091 ± 0.007
0.927 ± 0.080
269.170 ± 21.681
0.243 ± 0.007
0.952 ± 0.021
0.017 ± 0.001
-
0.123 ± 0.048
0.138 ± 0.028
1.126 ± 0.065
0.021 ± 0.005
16.835 ± 1.144
60.641 ± 10.994
2.557 ± 0.303
1.192 ± 0.166
0.053 ± 0.012
0.030 ± 0.003
0.366 ± 0.040
0.018 ± 0.002
0.802 ± 0.140
0.346 ± 0.037
0.136 ± 0.024
45.002 ± 3.974
0.131 ± 0.020
0.059 ± 0.008
0.054 ± 0.006
0.182 ± 0.023
0.422 ± 0.025
0.079 ± 0.014
0.288 ± 0.082
0.452 ± 0.065
0.417 ± 0.065
0.154 ± 0.024
0.329 ± 0.056
1.194 ± 0.333
0.322 ± 0.012
0.056 ± 0.005
0.017 ± 0.001
0.016 ± 0.001
0.020 ± 0.003
0.012 ± 0.003
0.021 ± 0.008
0.017 ± 0.009
0.075 ± 0.008
0.025 ± 0.001
0.045 ± 0.003
0.120 ± 0.058
0.032 ± 0.008
0.016 ± 0.008
0.018 ± 0.003
0.170 ± 0.017
0.427 ± 0.038
0.074 ± 0.010
2.358 ± 0.248
168.624 ± 15.551
0.149 ± 0.048
0.019 ± 0.002
6.678 ± 0.976
0.066 ± 0.002
0.384 ± 0.024
1.643 ± 0.384
101.135 ± 13.937
128.651 ± 8.109
0.341 ± 0.080
0.126 ± 0.002
0.093 ± 0.009
0.156 ± 0.002
0.207 ± 0.007
0.095 ± 0.014
64.357 ± 1.385
0.027 ± 0.008
0.701 ± 0.190
0.307 ± 0.045
0.022 ± 0.008
0.015 ± 0.005
0.234 ± 0.035
0.706 ± 0.040
0.109 ± 0.072
0.109 ± 0.095
0.348 ± 0.087
0.023 ± 0.006
0.027 ± 0.006
0.008 ± 0.001
0.066 ± 0.006
0.023 ± 0.008
0.037 ± 0.015
0.069 ± 0.004
0.370 ± 0.489
1.445 ± 0.253
16.057 ± 2.678
0.232 ± 0.019
0.061 ± 0.015
0.039 ± 0.003
0.723 ± 0.018
250.604 ± 22.265
1.186 ± 0.210
(continued on next page)
9
A. Ferracane, N. Manousi, P.Q. Tranchida et al.
Journal of Chromatography A 1676 (2022) 463241
Table 2 (continued)
Nr.
Compounds
Blended Scotch [rel.
intensity±SD]
Irish [rel.
intensity±SD]
73
74
75
76
77
78
79
80
81
82
83
84
85
86
87
88
89
90
91
92
93
94
95
96
97
98
99
100
101
102
103
104
105
106
107
108
109
110
111
112
113
114
115
116
117
118
119
120
121
122
123
124
125
126
127
128
129
130
131
132
1-Octanol
1,1,3-Triethoxy-propane
Hexanal diethyl acetal
(E)-Hept-4-enoate
2-Nonanone
Propyl hexanoate
Undecane
Ethyl heptanoate
Linalool
3-Methylbutyl 2-methylbutanoate
2-Nonanol
Nonanal
Heptyl acetate
1,1,3-Triethoxybutane
2-Ethyl-1,4-dimethyl-benzene
Methyl octanoate
Acetic acid, 2-ethylhexyl ester
Ethyl benzoate
(E)-2-Nonenal
Linalool ethyl ether
1-Nonanol
Diethyl butanedioate
Butyl hexanoate
1,1-Diethoxy-Heptane
3-Decanone
(Z)-4-Octanoate
Octanoic acid
Dodecane
Ethyl octanoate
Ethyl-oct-(2Z)-enoate
Decanal
Benzenecarboxylic acid
Octyl acetate
Ethyl-2-methyloctanoate
1,3-bis(1,1-Dimethylethyl)-benzene
Ethyl-oct-(2E)-enoate
Isopentyl hexanoate
2-Phenylethyl acetate
(Z)-4-Decen-1-ol
Ethyl benzeneacetate
Isopropyl phenylacetate
Citronellyl formate
Methyl-3-phenylpropionate
1-Decanol
Vitispirane
3-Nonenoate
2-Undecanone
Ethyl nonanoate
Tridecane
2-Undecanol
Nonyl acetate
Methyl decanoate
β -methyl-γ -octalactone
Citronellyl acetate
Ethyl-3-phenylpropionate
cis-Geranyl acetate
Butyl octanoate
9-Decenoic acid
(Z)-4-Decenoate
1,2-Dihydro-1,1,6-trimethylnaphthalene
Decanoic acid
Ethyl decanoate
Tetradecane
Dodecanal
Decyl acetato
3-Methylbutyl octanoate
Ethyl-trans-2-decenoate
trans-Geranylacetone
(E)-β -Farnesene
Methyl-undeca-(2Z,4Z)-dienoate
1-Dodecanol
Ethyl-undec-10-enoate
Propyl decanoate
0.360 ±
0.086 ±
0.144 ±
0.026 ±
0.337 ±
0.088 ±
0.034 ±
0.067 ±
0.133 ±
0.153 ±
0.083 ±
0.257 ±
0.210 ±
0.131 ±
0.889 ±
0.012 ±
0.028 ±
0.137 ±
0.233 ±
0.021 ±
1.115 ±
0.018 ±
0.012 ±
0.049 ±
0.114 ±
0.063 ±
6.179 ±
0.036 ±
0.956 ±
0.054 ±
0.196 ±
3.282 ±
0.058 ±
0.044 ±
0.084 ±
0.030 ±
1.159 ±
0.204 ±
0.197 ±
0.105 ±
0.087 ±
0.015 ±
0.024 ±
0.025 ±
358.434
1.090 ±
0.078 ±
0.114 ±
1.628 ±
0.701 ±
0.289 ±
0.012 ±
0.544 ±
0.082 ±
0.292 ±
0.364 ±
0.085 ±
0.087 ±
0.148 ±
0.272 ±
0.171 ±
0.117 ±
0.476 ±
0.041 ±
0.067 ±
0.163 ±
1.332 ±
0.009 ±
0.530 ±
0.026 ±
0.712 ±
0.122 ±
0.029 ±
0.102 ±
0.032 ±
0.220 ±
4.938 ±
0.052 ±
0.116 ±
0.648 ±
0.469 ±
0.379 ±
0.032 ±
0.079 ±
224.226
0.110 ±
0.849 ±
2.218 ±
0.568 ±
-
133
134
135
136
137
138
139
140
141
142
143
144
145
0.931
8.450
0.409
0.756
0.014
0.030
0.023
0.257
0.015
0.097
0.010
0.002
0.006
0.001
0.014
0.009
0.010
0.025
0.015
0.026
0.019
0.019
0.025
0.012
0.022
0.001
0.005
0.002
0.004
0.001
0.104
0.001
0.001
0.005
0.004
0.005
0.587
0.010
0.075
0.003
0.014
0.095
0.002
0.008
0.005
0.006
0.061
0.017
0.009
0.001
0.022
0.001
0.005
0.005
± 22.560
0.120
0.016
0.014
0.238
0.073
0.012
0.001
± 0.110
± 0.632
± 0.097
± 0.049
±
±
±
±
±
±
0.004
0.005
0.005
0.029
0.003
0.011
0.105
2.999
0.052
0.362
0.078
0.072
0.090
0.024
0.065
±
±
±
±
0.060
0.003
0.029
0.010
0.006
0.026
0.016
0.026
0.023
0.017
0.075
0.004
0.004
0.027
0.273
0.001
0.047
0.009
0.091
0.053
0.003
0.028
0.008
0.048
0.632
0.009
0.029
0.093
0.073
0.049
0.005
0.010
± 18.354
0.013
0.089
0.077
0.255
0.020
0.127
0.006
0.017
± 0.019
± 0.012
± 0.015
± 0.003
± 0.011
Single malt Scotch
[rel. intensity±SD]
1.193 ± 0.288
0.039 ± 0.001
0.032 ± 0.003
0.534 ± 0.013
0.148 ± 0.018
0.072 ± 0.013
0.822 ± 0.076
0.062 ± 0.011
0.132 ± 0.042
1.681 ± 1.666
0.037 ± 0.008
0.283 ± 0.068
0.627 ± 0.126
0.120 ± 0.026
0.154 ± 0.018
0.047 ± 0.011
0.057 ± 0.000
0.043 ± 0.008
3.821 ± 0.529
0.052 ± 0.002
0.163 ± 0.031
0.768 ± 0.104
0.028 ± 0.006
0.071 ± 0.003
2.593 ± 0.411
24.983 ± 3.960
3.142 ± 0.251
0.110 ± 0.010
0.657 ± 0.270
0.021 ± 0.007
214.390 ± 23.777
0.759 ± 0.394
2.121 ± 2.853
13.740 ± 2.339
0.308 ± 0.021
0.405 ± 0.099
0.226 ± 0.026
0.014 ± 0.002
0.076 ± 0.009
(continued on next page)
10
A. Ferracane, N. Manousi, P.Q. Tranchida et al.
Journal of Chromatography A 1676 (2022) 463241
Table 2 (continued)
Nr.
Compounds
Blended Scotch [rel.
intensity±SD]
Irish [rel.
intensity±SD]
146
147
148
149
150
151
152
153
154
155
156
157
158
159
160
161
162
163
164
165
166
167
Undecyl methyl ketone
Ethyl-undecanoate
Tridecanal
Isobutyl decanoate
3,5-bis(1,1-Dimethylethyl)-phenol
(E)-Nerolidol
cis-5-Dodecenoic acid
Methyl tridecanoate
Dodecanoic Acid
Ethyl dodecanoate
Lauryl acetate
Tetradecanal
Phenethyl-hexanoate
Isoamyl decanoate
Propyl dodecanoate
Isobutyl laurate
Farnesyl acetate
Isopentyl dodecanoate
Phenylethyl-octanoate
Ethyl (E)-11-hexadecenoate
Ethyl-9-hexadecenoate
Ethyl hexadecanoate
0.034 ± 0.001
0.473 ± 0.021
0.036 ± 0.004
2.416 ± 0.301
0.449 ± 0.035
0.056 ± 0.007
0.026 ± 0.008
0.410 ± 0.034
0.554 ± 0.020
0.021 ± 0.001
0.581 ± 0.091
99.991 ± 14.485
1.327 ± 0.233
0.018 ± 0.001
0.084 ± 0.016
0.036 ± 0.007
0.028 ± 0.013
0.042 ± 0.001
-
0.251 ± 0.024
0.478 ± 0.125
0.031 ± 0.012
0.031 ± 0.007
0.155 ± 0.030
0.121 ± 0.014
0.914 ± 0.169
0.104 ± 0.049
52.700 ± 9.882
0.163 ± 0.007
0.183 ± 0.027
0.131 ± 0.008
0.226 ± 0.035
blended Scotch whiskey sample was analyzed in three repetitions
and the comparison of the two techniques was carried out in terms
of the obtained areas for selected compounds. As shown in Fig. 4,
the sensitivity of the determination for the VOCs is considerably
higher when the sample is extracted with the use of SPME Arrow
fiber for all the determined classes of compounds. Enhancement
factors are calculated as the peak area ratio of the SPME Arrow
measurement in relation to the conventional SPME measurement
of individual compounds in the same sample. Individual enhancement factors have been grouped and averaged according to compound class to be more representative. The utilization of SPME Arrow resulted in sensitivity enhancement factors of up to 6.1. These
results are in accordance with previous studies that reported the
superiority of SPME Arrow in terms of method sensitivity [6,33].
Finally, the repeatability of SPME Arrow and conventional SPME
were compared on the basis of average relative standard deviation (RSD) values for the peak areas. The data were obtained
from the triplicate analysis of the blended Scotch whiskey sample. Fig. 5 presents the results for the two techniques, according
to chemical compound class. The higher precision as well as the
greater sensitivity of the SPME Arrow fiber is attributed to the
greater amount of sorptive phase and the greater surface area compared to the conventional SPME fiber, and the consequently resulting larger peak areas in most cases [14].
As it can be observed, the utilization of SPME Arrow fibers
leads to more reproducible results in comparison with conventional SPME fibers. All things considered, the use of the SPME Arrow technique brings considerable advantages over conventional
SPME technique since it enables the extraction of a higher number
of total compounds, as well as higher sensitivity and reproducibility.
Single malt Scotch
[rel. intensity±SD]
0.021 ± 0.001
0.138 ± 0.011
0.009 ± 0.001
0.879 ± 0.052
0.464 ± 0.014
0.114 ± 0.012
0.059 ± 0.003
72.068 ± 2.373
0.558 ± 0.148
0.136 ± 0.043
0.033 ± 0.007
-
whiskey includes five distinct categories, i.e., single malt Scotch
whiskey, single grain Scotch whiskey, blended Scotch whiskey,
blended malt Scotch whiskey and blended grain Scotch whiskey.
Irish whiskey is another type of distilled beverage internationally
recognised by Geographical Indication and it is produced from either malted barley or a mixture of unmalted and malted other cereals and barley. In the latter case, the minimum content of malted
barley is 25% [34]. Many of the VOCs that are expected to be determined in whiskey samples are common to different whiskeys but
differ analytically in terms of the relative amount [24]. In Fig. 6,
three expansions of a representative chromatogram of a Blended
Scotch whiskey sample are shown.
Moreover, Table 2 summarizes the results from all samples. The
semi-quantitative analysis of the concentration ranges for the VOCs
in all samples was conducted by comparing the peak area of each
analyte to the peak area of the internal standard (ISTD) 3-methyl3-pentanol.
Fatty acid esters comprise a significant group of VOCs in
whiskey samples. These compounds exbibit a pleasant odour and
some of them have a high odour impact and as a result they
play an important role as aroma components of whiskey samples. Short-chain fatty acid esters including ethyl-, isobutyl- and
3-methylbutyl esters are common constituents of whiskey samples
and their presence is associated with a pleasant aroma [35]. For
example, isoamyl acetate and ethyl hexanoate are compounds with
fruity aromas, while 2-phenylethyl acetate exhibits floral aroma
[4]. Other esters that are determined in whiskey samples in significant amounts are the ones of octanoic, decanoic and dodecanoic
acids, while ethyl E-11-hexadecenoate is a common compound that
is mainly found in Scotch whiskeys [35].
Furanic compounds that were detected in the whiskey samples included 2-pentylfuran and furfural. Furfural exhibits a roasty
aroma described as “baked/toasted almond”. 2-pentylfuran exhibits
an earthy aroma, described as “gas/bad smell” and “stable”, respectively. Among the major alcohols that were detected in the
whiskey samples, most of the detected VOCs (i.e., 3-methyl-1butanol or isoamyl alcohol) exhibit a fatty odour type [4].
A wide range of aldehydes with diverse odour type were also
determined in the whiskey samples. Among them, compounds
with vegetal [e.g., (E)-2-octenal described as “vegetable/cabbage”
and hexanal described as “green/vegetative”], chemical (e.g.,
nonanal described as “soap/fresh”), fatty [e.g., (E)-2-nonenal de-
3.3. Application of SPME Arrow for the determination of VOCs in
whiskey samples
As proof-of-concept, the optimized SPME Arrow method was
employed for the extraction and preconcentration of VOCs from
different types of whiskey samples prior to their determination
by GC × GC–MS. Unequivocally, Irish whiskey and Scotch whiskey
are among the most famous whiskey types. Scotch whiskey is produced and matured in oak casks for at least three years in Scottish distilleries located in specific designated regions. This type of
11
A. Ferracane, N. Manousi, P.Q. Tranchida et al.
Journal of Chromatography A 1676 (2022) 463241
2-methyl-butanoic acid ethyl ester
1.2
Dodecanoic acid ethyl ester
(E)-2-nonenal
1.0
0.8
0.6
3-methyl-1-butanol
Hexanoic acid ethyl ester
0.4
0.2
0.0
2-nonanol
Octanoic acid ethyl ester
1,1-Diethoxyethane
Butanoic acid ethyl ester
3-methyl-butanoic acid ethyl ester
Blended Scotch Wiskey
Irish Whiskey
Single Malt Scotch Whiskey
Fig. 7. Comparison of key odorants VOCs in three different whiskey samples in the form of a spider plot. In this plot, the individual rays represent the relative concentration
of each key odorant in the three whiskey varieties, normalized to the whiskey type that has highest concentration of each compound.
scribed as “fried/toasted/fatty”] and grassy aromas (e.g., heptanal
described as “seaweed/grass/rubber” and decanal described as
“grass/lemon”) were found in the whiskey samples [4,36]. In contrast to this, the presence of styrene can be attributed to sample
contamination [37]. Alcoholic beverages are known to be good extractants for polystyrene from packaging materials [38]. In the current case, the polymer liner of the screw cap is suspected to be the
source of the observed contamination.
The evaluation of the differences between different types of
whiskey by means of SPME Arrow was also investigated. Fig. 7
shows three spider plots providing the comparison of the intensity of ten VOCs that have been identified as key odorant compounds and that were tentatively identified in the whiskey samples (i.e., 1,1-diethoxyethane, 3-methyl-1-butanol, 2-nonanol, (E)-2nonenal, dodecanoic acid ethyl ester, octanoic acid ethyl ester, hexanoic acid ethyl ester, butanoic acid ethyl ester, 3-methyl-butanoic
acid ethyl ester and 2-methyl-butanoic acid ethyl ester) [39–41].
The concentration of each compound was normalized to the highest concentration found for the respective compound among the
three different Whiskey samples. The relative concentration of each
compound was plotted along the rays of this spider diagram with
a span of 0-10, representing 0–100% of the maximum concentration. As it can be observed, relatively high differences were observed between the particular whiskey types that were analyzed
in this study. Thus, SPME Arrow could potentially serve as a simple
and efficient extraction technique for the differentiation of different types of whiskey samples.
optimum conditions, the utilization of the SPME Arrow fibers resulted in better sensitivity and repeatability compared to conventional CAR/PDMS fibers. Moreover, the utilization of the SPME Arrow technique enabled the detection of more volatile constituents
compared to the conventional SPME format. It can thus be concluded that the coupling of SPME–Arrow and GC × GC-MS results
in a powerful analytical workflow that provides more comprehensive information compared to already existing sample preparation
techniques, making it most appropriate for hunting molecules in
complex samples.
Declaration of Competing Interest
The authors declare no conflict of interest.
CRediT authorship contribution statement
Antonio Ferracane: Data curation, Formal analysis, Investigation, Methodology, Visualization, Writing – original draft. Natalia
Manousi: Investigation, Data curation, Formal analysis, Investigation, Methodology, Validation, Visualization, Writing – original
draft. Peter Q. Tranchida: Conceptualization, Funding acquisition,
Project administration, Supervision, Writing – review & editing.
George A. Zachariadis: Conceptualization, Project administration,
Supervision, Writing – review & editing. Luigi Mondello: Conceptualization, Project administration, Supervision, Writing – review &
editing. Erwin Rosenberg: Conceptualization, Funding acquisition,
Methodology, Project administration, Supervision, Resources, Writing – review & editing.
4. Conclusions
Acknowledgments
In this work, the SPME Arrow technique combined with
GC × GC-MS was evaluated for the first time for the sampling
of VOCs of different types of whiskey samples. The main parameters affecting the performance of the SPME Arrow protocol were
investigated and optimized and the proposed method was compared with the procedure using conventional SPME fibers. Under
We would like to acknowledge the support of this work through
the Restek Academic Support Program (RASP - Restek, Bellefonte,
PA, USA) under agreement no. 201722830. The authors acknowledge TU Wien Bibliothek for financial support through its Open
Access Funding Programme.
12
A. Ferracane, N. Manousi, P.Q. Tranchida et al.
Journal of Chromatography A 1676 (2022) 463241
Supplementary materials
[22] X. Zhang, C. Wang, L. Wang, S. Chen, Y. Xu, Optimization and validation of a
head space solid-phase microextraction-Arrow gas chromatography-mass spectrometry method using central composite design for determination of aroma
compounds in Chinese liquor (Baijiu), J. Chromatogr. A 1610 (2020) 460584,
doi:10.1016/j.chroma.2019.460584.
[23] G. Purcaro, P.Q. Tranchida, R.A. Jacques, E.B. Caramão, S. Moret, L. Conte,
P. Dugo, G. Dugo, L. Mondello, Characterization of the yerba mate
(Ilex paraguariensis) volatile fraction using solid-phase microextractioncomprehensive 2-D GC-MS, J. Sep. Sci. 32 (2009) 3755–3763, doi:10.1002/jssc.
20 090 0343.
[24] M. Caldeira, F. Rodrigues, R. Perestrelo, J.C. Marques, J.S. Câmara, Comparison of
two extraction methods for evaluation of volatile constituents patterns in commercial whiskeys. Elucidation of the main odour-active compounds, Talanta 74
(2007) 78–90, doi:10.1016/j.talanta.2007.05.029.
[25] A.G.L. Abdullah, N.M. Sulaiman, M.K. Aroua, C.R.C. Hassan, Optimization of
headspace sampling using Solid-phase microextraction (SPME) for volatile
components in starfruit juice, Int. J. Food Eng. 9 (2013) 227–232, doi:10.1515/
ijfe- 2012- 0 0 04.
[26] J.S. Câmara, J.C. Marques, R.M. Perestrelo, F. Rodrigues, L. Oliveira, P. Andrade, M. Caldeira, Comparative study of the whisky aroma profile based on
headspace solid phase microextraction using different fibre coatings, J. Chromatogr. A 1150 (2007) 198–207, doi:10.1016/j.chroma.2006.09.014.
[27] K.L. de Santana, M. de S. Galvão, M.S. de Jesus, J.P. Nogueira, N. Narain, HSSPME optimization and extraction of volatile compounds from soursop (Annona muricata L.) pulp with emphasis on their characteristic impact compounds, Food Sci. Technol. 37 (2017) 250–260, doi:10.1590/1678-457X.20916.
[28] G. Fitzgerald, K.J. James, K. MacNamara, M.A. Stack, Characterisation
of whiskeys using solid-phase microextraction with gas chromatographymass spectrometry, J. Chromatogr. A 896 (20 0 0) 351–359, doi:10.1016/
S0 021-9673(0 0)0 0737-8.
[29] C.S. Tsoutsi, T.A. Albanis, Optimization of headspace solid-phase microextraction conditions for the determination of organophosphorus insecticides
in olive oil, Int. J. Environ. Anal. Chem. 84 (2004) 3–13, doi:10.1080/
03067310310 0 01597635.
[30] F. Rodrigues, M. Caldeira, J.S. Câmara, Development of a dynamic headspace
solid-phase microextraction procedure coupled to GC-qMSD for evaluation the
chemical profile in alcoholic beverages, Anal. Chim. Acta 609 (2008) 82–104,
doi:10.1016/j.aca.2007.12.041.
[31] E. Rianawati, R. Balasubramanian, Optimization and validation of solid phase
micro-extraction (SPME) method for analysis of polycyclic aromatic hydrocarbons in rainwater and stormwater, Phys. Chem. Earth 34 (2009) 857–865,
doi:10.1016/j.pce.20 09.07.0 03.
[32] C. Dadalı, Y. Elmacı, Optimization of Headspace-Solid Phase Microextraction
(HS-SPME) technique for the analysis of volatile compounds of margarine, J.
Food Sci. Technol. 56 (2019) 4834–4843, doi:10.1007/s13197- 019- 03945- w.
[33] L.M.F. Barreira, G. Duporté, T. Rönkkö, J. Parshintsev, K. Hartonen, L. Hyrsky,
E. Heikkinen, M. Jussila, M. Kulmala, M.L. Riekkola, Field measurements of
biogenic volatile organic compounds in the atmosphere using solid-phase
microextraction Arrow, Atmos. Meas. Tech. 11 (2018) 881–893, doi:10.5194/
amt- 11- 881- 2018.
[34] A.C. Power, C.N. Néill, S. Geoghegan, S. Currivan, M. Deasy, D. Cozzolino, A
brief history of whiskey adulteration and the role of spectroscopy combined
with chemometrics in the detection of modern whiskey fraud, Beverages 6 (3)
(2020) 49, doi:10.3390/beverages6030049.
[35] J.C.R. Demyttenaere, J.I. Sánchez Martínez, R. Verhé, P. Sandra, N. De Kimpe,
Analysis of volatiles of malt whisky by solid-phase microextraction and stir
bar sorptive extraction, J. Chromatogr. A 985 (2003) 221–232, doi:10.1016/
S0021-9673(02)01471-1.
[36] L. Poisson, P. Schieberle, Characterization of the most odor-active compounds
in an American Bourbon whisky by application of the aroma extract dilution
analysis, J. Agric. Food Chem. 56 (2008) 5813–5819, doi:10.1021/jf800382m.
[37] Z. Amirshaghaghi, Z. Emam Djomeh, A. Oromiehie, Studies of Migration of
Styrene Monomer from Polystyrene Packaging into the Food Simulant, Iran. J.
Chem. Eng. 8 (2011) 43–49.
[38] P.L. Dawson, A.C. Seydim, D. Hirt, Styrene monomer migration from expanded
polystyrene into food acids and ethanol, J. Food Res. 9 (3) (2020) 39–52,
doi:10.5539/jfr.v9n3p39.
´ M. Majcher, A. Szwengiel, Key odorants in peated malt whisky and
[39] H.H. Jelen,
its differentiation from other whisky types using profiling of flavor and volatile
compounds, LWT 107 (2019) 56–63, doi:10.1016/j.lwt.2019.02.070.
[40] L. Poisson, P. Schieberle, Characterization of the key aroma compounds in
an American Bourbon whisky by quantitative measurements, aroma recombination, and omission studies, J. Agric. Food Chem. 56 (2008) 5820–5826,
doi:10.1021/jf800383v.
[41] A. Wanikawa, K. Hosoi, T. Kato, K.I. Nakagawa, Identification of green note
compounds in malt whisky using multidimensional gas chromatography,
Flavour Fragr. J. 17 (2002) 207–211, doi:10.1002/ffj.1073.
Supplementary material associated with this article can be
found, in the online version, at doi:10.1016/j.chroma.2022.463241.
References
[1] A. Pawlaczyk, M. Gajek, K. Jozwik, M.I. Szynkowska, Multielemental analysis of various kinds of whisky, Molecules 24 (7) (2019) 1193, doi:10.3390/
molecules24071193.
[2] Y.P. Zhao, X.P. Zheng, P. Song, Z.L. Sun, T.T. Tian, Characterization of volatiles
in the six most well-known distilled spirits, J. Am. Soc. Brew. Chem. 71 (2013)
161–169, doi:10.1094/ASBCJ- 2013- 0625- 01.
[3] J. Cha, Y.W. Chin, J.Y. Lee, T.W. Kim, H.W. Jang, Analysis of volatile compounds
in soju, a korean distilled spirit, by SPME-Arrow-GC/MS, Foods 9 (10) (2020)
1422, doi:10.3390/foods9101422.
[4] M. Kyraleou, D. Herb, G.O. Reilly, N. Conway, T. Bryan, K.N. Kilcawley, The impact of terroir on the flavour of single malt whisk(e)y new make spirit, Foods
10 (2) (2021) 443, doi:10.3390/foods10020443.
[5] T.G. Nam, J.Y. Lee, B.K. Kim, N.E. Song, H.W. Jang, Analyzing volatiles in brown
rice vinegar by headspace solid-phase microextraction (SPME)–Arrow: optimizing the extraction conditions and comparisons with conventional SPME,
Int. J. Food Prop. 22 (2019) 1195–1204, doi:10.1080/10942912.2019.1634099.
[6] N. Manousi, E. Rosenberg, G.A. Zachariadis, Solid-phase microextraction arrow
for the sampling of volatile organic compounds in milk samples, Separations 7
(4) (2020) 75, doi:10.3390/separations7040075.
[7] B. d’Acampora Zellner, P. Dugo, G. Dugo, L. Mondello, Gas chromatographyolfactometry in food flavour analysis, J. Chromatogr. A 1186 (2008) 123–143,
doi:10.1016/j.chroma.20 07.09.0 06.
[8] C. Diez-Simon, R. Mumm, R.D. Hall, Mass spectrometry-based metabolomics
of volatiles as a new tool for understanding aroma and flavour chemistry in processed food products, Metabolomics 15 (2019) 41, doi:10.1007/
s11306- 019- 1493- 6.
[9] G. Dugo, F.A. Franchina, M.R. Scandinaro, I. Bonaccorsi, N. Cicero,
P.Q. Tranchida, L. Mondello, Elucidation of the volatile composition of
marsala wines by using comprehensive two-dimensional gas chromatography,
Food Chem. 142 (2014) 262–268, doi:10.1016/j.foodchem.2013.07.061.
[10] J.R.B. de Souza, F.F.G. Dias, J.D. Caliman, F. Augusto, L.W. Hantao, Opportunities
for green microextractions in comprehensive two-dimensional gas chromatography /mass spectrometry-based metabolomics – a review, Anal. Chim. Acta
1040 (2018) 1–18, doi:10.1016/j.aca.2018.08.034.
[11] F. Stilo, C. Bicchi, A. Robbat, S.E. Reichenbach, C. Cordero, Untargeted approaches in food-omics: the potential of comprehensive two-dimensional
gas chromatography/mass spectrometry, TrAC Trends Anal. Chem. 135 (2021)
116162, doi:10.1016/j.trac.2020.116162.
[12] C.L. Arthur, J. Pawliszyn, Solid phase microextraction with thermal desorption
using fused silica optical fibers, Anal. Chem. 62 (1990) 2145–2148, doi:10.1021/
ac00218a019.
[13] W. Kaziur, A. Salemi, M.A. Jochmann, T.C. Schmidt, Automated determination of
picogram-per-liter level of water taste and odor compounds using solid-phase
microextraction arrow coupled with gas chromatography-mass spectrometry,
Anal. Bioanal. Chem. 411 (2019) 2653–2662, doi:10.10 07/s0 0216- 019- 01711- 7.
[14] J.S. Herrington, G.A. Gómez-Ríos, C. Myers, G. Stidsen, D.S. Bell, Hunting
molecules in complex matrices with SPME Arrows: a review, Separations 7 (1)
(2020) 12, doi:10.3390/separations7010012.
[15] S.J. Kim, J.Y. Lee, Y.S. Choi, J.M. Sung, H.W. Jang, Comparison of different types
of SPME arrow sorbents to analyze volatile compounds in Cirsium setidens
nakai, Foods 9 (6) (2020) 785, doi:10.3390/foods9060785.
[16] A. Helin, T. Rönkkö, J. Parshintsev, K. Hartonen, B. Schilling, T. Läubli,
M.L. Riekkola, Solid phase microextraction Arrow for the sampling of volatile
amines in wastewater and atmosphere, J. Chromatogr. A 1426 (2015) 56–63,
doi:10.1016/j.chroma.2015.11.061.
[17] A. Kremser, M.A. Jochmann, T.C. Schmidt, PAL SPME Arrow – evaluation of a
novel solid-phase microextraction device for freely dissolved PAHs in water,
Anal. Bioanal. Chem. 408 (2016) 943–952, doi:10.10 07/s0 0216- 015- 9187- z.
[18] I. Šikuten, P. Štambuk, J.K. Konti, E. Maleti, Optimization of SPME-Arrow-GC/MS
Method for determination of free and bound volatile organic compounds from
grape skins, Molecules 26 (23) (2021) 7409, doi:10.3390/molecules26237409.
[19] N.E. Song, J.Y. Lee, Y.Y. Lee, J.D. Park, H.W. Jang, Comparison of headspace–
SPME and SPME-Arrow–GC–MS methods for the determination of volatile
compounds in Korean salt–fermented fish sauce, Appl. Biol. Chem. 62 (2019),
doi:10.1186/s13765- 019- 0424- 6.
[20] J.Y. Lee, W.S. Kim, Y.Y. Lee, Y.S. Choi, H. Choi, H.W. Jang, Solid-phase microextraction Arrow for the volatile organic compounds in soy sauce, J. Sep. Sci. 42
(2019) 2942–2948, doi:10.10 02/jssc.20190 0388.
[21] X.B. Xu, K. Murtada, J. Pawliszyn, Determination of selected volatile terpenes
in fish samples via solid phase microextraction arrow coupled with GC-MS,
Talanta 221 (2021) 121446, doi:10.1016/j.talanta.2020.121446.
13