Calibration quartz: An update on dose calculations for luminescence dating
Bạn đang xem bản rút gọn của tài liệu. Xem và tải ngay bản đầy đủ của tài liệu tại đây (748.61 KB, 5 trang )
Radiation Measurements 157 (2022) 106828
Contents lists available at ScienceDirect
Radiation Measurements
journal homepage: www.elsevier.com/locate/radmeas
Calibration quartz: An update on dose calculations for luminescence dating
M. Autzen a, *, C.E. Andersen b, M. Bailey b, A.S. Murray c
a
DTU Physics, Risø Campus, Technical University of Denmark, Frederiksborgvej 399, 4000, Roskilde, Denmark
DTU Health Tech, Risø Campus, Technical University of Denmark, Frederiksborgvej 399, 4000, Roskilde, Denmark
c
Nordic Laboratory for Luminescence Dating, Department of Geology, Aarhus University and DTU Physics, Risø Campus, Technical University of Denmark,
Frederiksborgvej 399, 4000, Roskilde, Denmark
b
A B S T R A C T
Previous calculations of the γ dose given to Risø Calibration Quartz (RCQ) were performed using mass absorption and mass attenuation coefficients. In this paper, we
update the γ dose given to RCQ using Geant4 simulations and provide a comparison with three other γ sources in Denmark. We also show experimental evidence that
the luminescence response to a137Cs γ irradiation is 4% higher than that resulting from a60Co γ irradiation for the same dose, confirming the suggestions of Autzen
et al. (2021) based on simulations.
1. Introduction
Dating natural sediments using optically or thermally stimulated
luminescence depends on accurate and precise calibration of the labo
ratory dose rate. Laboratory doses are typically given using a β source
mounted on the luminescence reader. This source must be crosscalibrated against some independently calibrated source, usually
a60Co or 137Cs γ source, in order to provide an accurate dose rate. Such a
comparison is undertaken by matching sensitivity-corrected light-levels,
i.e.
Dγ χ γ = tD˙β χ β
where Dγ is the given γ dose, χ γ and χ β are the luminescence efficiencies
for γ and β irradiations respectively, D˙β is the β source dose rate and t is
the β irradiation time required to match the luminescence produced by
the γ dose.
In practice the comparison also relies on the fundamental assump
tion that the luminescence response for a γ dose (χγ) is the same as that
from a beta dose (χβ) (Hansen et al., 2018), and so
D˙β =
Dγ χ γ Dγ
∼
tχ β
t
(Eq. 1)
The γ source is usually calibrated under certain reference conditions
(e.g. at 2 m distance) using an ionisation chamber providing traceability,
usually to a national or international accredited standard for air kerma
(free in air) or dose to water (in a water phantom). The reference value
must be converted to a dose to the medium of interest – in our case,
quartz.
Risø Calibration Quartz (RCQ, Hansen et al., 2015, 2018) and its
predecessors have been used for calibrating β sources in laboratories
worldwide for the past 30 years. In the past we have used mass ab
sorption coefficient tables to calculate the conversion from air kerma in
a137Cs beam to a given quartz dose, and mass attenuation coefficient
tables to calculate the attenuation of the primary photon beam through
the glass cell used to provide buildup of secondary electrons. Previous
work (Bos et al., 2006) found good agreement between calibrations
performed using Fricke dosimetry and RCQ, however, recent work by
Tribolo et al. (2019) suggests that there may be a discrepancy in the
calibrated dose rates achieved using RCQ and LexCal. This comparison
has been investigated in Richter et al. (submitted).
In this paper we will first go through the past calculations of dose to
RCQ (Section 2) based on mass-attenuation and mass-absorption co
efficients in the two different irradiation geometries used for past and
current batches. In section 3 we show that the past calculations have
underestimated the actual dose due to neglecting scatter of the primary
beam, as well as showing the impact of sample-source distance errors
and backscatter on the final dose. Finally, we compare the new dose
based on the results of section 3 with irradiations performed in other
calibrated sources in order to gain additional confidence in the new dose
(Section 4).
2. Past calculations of dose to RCQ
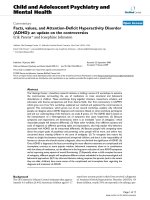
Until 2002, RCQ (Batch 6) was irradiated using a137Cs source in glass
vials (Fig. 1a) taped to a cardboard sheet and packed in black plastic.
* Corresponding author.
E-mail address: (M. Autzen).
/>Received 9 August 2021; Received in revised form 4 July 2022; Accepted 7 July 2022
Available online 20 July 2022
1350-4487/© 2022 The Authors. Published by Elsevier Ltd. This is an open access article under the CC BY license ( />
M. Autzen et al.
Radiation Measurements 157 (2022) 106828
Since 2002, irradiations have been carried out using a different but
similar 137Cs source (Nucomat facility, DTU Risø Campus, dose rate
~0.1 Gy/h at 2 m). In 2005 (Batch 7 onwards), the irradiation cell was
changed to one with a planar geometry, with a wall thickness normal to
the γ beam of 1.85 mm, see Fig. 1b. This change was driven by the need
for a material suitable for the calibration of systems intended for the
measurement of luminescence from individual grains. For this, it is
important that each individual grain absorbs the same γ dose, and our
preliminary calculations suggested that, using the new irradiation ge
ometry, this would be true to within 1%.
Both 137Cs sources were calibrated using an ionisation chamber to
provide the Kinetic Energy Released per unit Mass (Kerma) in air; Kerma
is defined as the sum of the initial kinetic energies of all charged par
ticles created by uncharged ionising radiation, per unit mass of sample.
The ionisation chambers used for these calibrations were traceable to
primary standards at NPL (UK) or PTB (Germany). For more information
on how the sources are accredited we direct the reader to the homepage
of the Medical Dosimetry group at DTU Healthtech (
lthtech.dtu.dk/english/services-and-products/hdrl). To ensure that
secondary electron equilibrium was achieved (i.e. each electron entering
the volume of interest containing quartz grains is balanced by an elec
tron leaving) some solid material must be placed in front of the quartz
grains to be irradiated; we use soda-glass, because its mass attenuation
and absorption characteristics are almost identical to those of quartz.
Kerma may then be equated to dose inside the sample, and the dose to
quartz derived using:
(μ ) /( )
μen *A
DQ = Kair * en
(Eq. 2)
ρ
Q
ρ
the mass energy absorption coefficients for quartz and air respectively,
and A is the attenuation through the glass wall and sample calculated
using
)
( ( )
)
( ( )
μ
μ
* ρglass * Lglass *exp −
* ρquartz * Lquartz
A = exp −
ρ
ρ
glass
quartz
(Eq. 3)
where (μ/ρ)i is the mass attenuation coefficient for glass or quartz, ρi is
the glass or quartz density and Li is the glass or quartz effective atten
uation path length. Mass energy absorption and mass attenuation co
efficients for air, glass, Si, and O are shown in Table 1. This simple
calculation assumes that end effects, and build-up of scattered radiation
Table 1
Mass energy absorption and mass energy attenuation coefficients.
Mass energy absorption coefficients, cm2 g−
Energy/
Si (μen/
O (μen/
MeV
ρ)Si
ρ)O
0.600
0.0295
0.0296
0.662
0.0293
0.0294
0.800
0.0288
0.0289
Mass attenuation coefficients
Energy/
Si (μ/ρ)Si
O (μ/ρ)O
MeV
0.600
0.0804
0.0805
0.662
0.0774
0.0775
0.800
0.0706
0.0707
a
1
Q (μen/
ρ)Q
0.0296
0.0293
0.0289
Q (μ/ρ)Q
0.0805
0.0774
0.0707
Glass (μen/
ρ)Glass
0.0294
0.0292
0.0287
Air (μen/
ρ)Air
0.0295
0.0293
0.0289
Glass
(μ/ρ)Glass
0.0800
0.0770
0.0703
a
Data derived from Berger (1993) and Berger et al. (2005). (μen/ρ)Q derived
from (μen/ρ)Si and (μen/ρ)O following the recommendations of the National
Institute of Standards and Technology, NIST (Berger, 1993; Berger et al., 2005),
see text.
air
where DQ is the dose to quartz, Kair is the air kerma measured at the
centre of the position of the quartz volume, (μen/ρ)Q and (μen/ρ)air are
Fig. 1. a) Glass tubes used for irradiating Batch 1–6, b) Glass cell used for irradiating Batch 7 – present.
2
M. Autzen et al.
Radiation Measurements 157 (2022) 106828
within the cell, are negligible; the resulting attenuation is small, as is
described below.
In Table 1, we have calculated the mass absorption and mass
attenuation coefficients for quartz by summing the relevant coefficients
weighted by their relative mass fractions (Berger, 1993; Berger et al.,
2005)
(μ )
en
ρ
Q
=
mSi (μen )
2*mO (μen )
*
+
*
mQ
ρ Si
mQ
ρ O
Table 2
Results of simulating kerma and dose to air and quartz in the irradiation post2005 geometry. Uncertainties given at k = 1 level.
Planar geometry (2005 – Present)
Depth/
mm
0.5
(Eq. 4)
1.5
We also interpolate linearly between 0.6 and 0.8 MeV in order to
calculate the mass absorption and mass attenuation coefficients for the
primary γ energy of 0.662 MeV; no significant difference is observed if
logarithmic interpolation is used. From Table 1, (μen/ρ)Q/(μen/ρ)air =
1.0008 at 662 keV; the mass energy absorption coefficients are indis
tinguishable, and so any difference between air kerma and quartz dose
will arise from attenuation of the primary beam through the cell wall
and half of the sample thickness.
In our calculations we assumed that the maximum path length of a
0.662 MeV electron in glass is 0.3 mm; this was subtracted from the total
wall thickness (because the dose absorbed at a point is derived from
photons that interact upstream of that point). Until 2002, attenuation
path lengths of 1.7 mm in glass (ρ = 2.66 g cm− 3) and 1.675 mm in
quartz (ρ = 2.00 g cm− 3) (to the middle of the quartz sample) were
assumed. Using Eq. (3), and an assumed (but realistic) packing density
of 2 g cm− 3, this gave attenuation factors of 0.966 and 0.975, respec
tively, and a total attenuation of 0.966 × 0.975 = 0.941 ± 0.010, where
we have estimated the uncertainty on the attenuation; all uncertainties
in this paper are presented at a coverage factor k = 1.
After the change to the planar geometry (in 2005), these calculations
were revised with an effective glass wall thickness of 1.6 mm and a
density of 2.66 g cm− 3 and a half mean path length through the sample
of 0.5 mm with an effective density of 2.00 g cm− 3. Using the same
calculations as before gives a total attenuation of 0.965 ± 0.010, where
we have again estimated the uncertainty on the attenuation. From these
data, a standard exposure equivalent to an air Kerma of 5.00 Gy leads to
a dose of 4.71 ± 0.07 Gy until 2002 and 4.82 ± 0.07 Gy after 2002.
2.5
3.5
4.5
KAir (pGy)
KQ (pGy)
DQ (pGy)
KQ/KAir
DQ/KQ
304.8 ±
3.4
302.8 ±
3.4
313.9 ±
3.5
309.1 ±
3.4
309.4 ±
3.5
314.5
0.4
312.9
0.3
311.5
0.3
309.1
0.3
306.9
0.3
269.1
0.3
312.4
0.3
310.1
0.3
308.8
0.3
298.1
0.3
1.03 ±
0.01
1.03 ±
0.01
0.99 ±
0.01
1.00 ±
0.01
0.99 ±
0.01
0.86 ±
0.01
1.00 ±
0.02
1.00 ±
0.02
1.00 ±
0.02
0.97 ±
0.02
±
±
±
±
±
±
±
±
±
±
material was chosen as SiO2) having a density of 2.38 g cm− 3 and filling
the sample space with 0.1 mm thick slices of reduced density quartz (ρ =
1.78 g cm− 3), which is more comparable to loosely-packed grains, and
were unable to detect a difference in the relationship between air kerma
and quartz dose compared to that of Table 1. Similarly, we also tested
the effect of the density of the glass by varying the density between 2.00
and 2.65 g cm− 3 and found no difference between the results.
3.1. Impact of scattering on initial calculations
The simulations in the previous section showed that the ratio be
tween air kerma and quartz dose was indistinguishable from unity at the
points in the sample volume. This is in contrast to the calculations
described above in section 2, where we predicted an attenuation of 3.5%
at the sample position. In the earlier calculations we only considered the
behaviour of the primary 662 keV photon beam; the build-up of sec
ondary (scattered) photons within the irradiation cell was neglected. In
the Geant4 simulations, if we disregard interactions with scattered
photons (i.e. only consider interactions with the primary beam) the
dose-to-kerma ratio at 2.5 mm into the cell decreases to 0.97 ± 0.01,
consistent with our simple calculations.
3. Dose calculations using Geant4
3.2. Source-sample distance, backscatter and build-up in air
To test the validity of the explicit calculations summarised above, we
have simulated the flat irradiation geometry in Geant4 (Agostinelli
et al., 2003; Allison et al., 2006) based on Fig. 1b. The planar geometry
was simulated by dividing the 5 mm thick cell (Fig. 1b) into five 1 mm
thick, 10 × 10 cm slices of quartz (ρ = 2.65 g cm− 3) or air (ρ =
0.00120479 g cm− 3) stacked against each other facing the beam. As the
geometry is scatter-free we can assume that the γ beam is parallel in the
position of the sample (sample located 2 m from the origin) and the
source is simulated as a square emission located at the origin with
parallel emission in the direction of the sample. The kerma in the quartz
sample was calculated as the initial energy of electrons created by
photons in each 1 mm slice. The dose in each slice was recorded in the
same simulation.
The results of these simulations are summarised for the various
depths in the container in Table 2, using a normalised number of emitted
photons emitted as a parallel beam of cross section identical to that of
the sample (10 × 10 cm). A simulation was also run with a point source
and a radial emission of photons, but no difference between the simu
lations was observed.
The simulations (Table 2) show that, as expected, the quartz-to-air
kerma ratios are close to unity through the length of the sample hold
er. However, the dose-to-kerma ratio for quartz is only significantly
below 1 in the first millimetre; further into the cell the ratio of dose to
kerma increases as the secondary electron flux builds up until it is again
indistinguishable from unity.
We further tested a more accurate simulation of the sample holder,
created to the same specifications as seen in Fig. 1b, with the glass (the
The 137Cs source was calibrated with the centre of the ionisation
chamber at a distance of 0.6 m from the source, but quartz irradiations
were performed at a distance of 2.0 m. In these simulations, we assumed
that the sample volume is centred on 2.0 m in air, with no support
material behind the irradiation cell. In reality, the glass cell was
mounted on the front of a 5 mm thick perspex plate (simullated using
included NIST Material in GEANT4, ρ = 1.19 g cm− 3), and the front of
this plate was mounted at 2.0 m distance from the source. This moved
the centre of the sample volume forward by approx. 3 mm, leading to an
increase in dose of 0.2%. However, at some point this 5 mm plate was
replaced by a 10 mm plate, with the back edge at 2.0 m. This led to an
undetected positioning error, with the centre of the sample lying
1.0–1.5 cm closer to the source and gave rise to a 1.0–1.5% increase in
dose given to the quartz. Modelling suggests that the presence of the
perspex plate will itself lead to an increase in absorbed dose of 1.6%
(because of secondary photons backscattered towards the sample). The
calibration of the source at 0.6 m was extrapolated to 2.0 m using the
inverse square law, and build-up in the intervening 1.4 m of air was
neglected. A new calibration with the ionisation chamber at 2.0 m was
undertaken, and this showed that the previous dose had been under
estimated by 1.3% due to the neglect of air build-up. These factors are all
summarised in Table 3.
Only for very few sub-batches used to make a single batch would we
expect the error in the positioning of the cell to be 1.5 cm in total. In the
calculation below we have assumed a distance of 1.25 cm (leading to
1.25% increase in dose) to be the most likely. Since these correction
3
Radiation Measurements 157 (2022) 106828
M. Autzen et al.
given a dose to water of 5 Gy. These laboratory irradiators have been
simulated using the EGSnrc Monte Carlo code (Kawrakow et al., 2017),
and a similar conversion factor was found between dose to water and
dose to quartz.
These various known-dose samples were used to calibrate the beta
source on two OSL readers (laboratory code ‘D’ and ‘E’) and the resulting
calibrations are listed in Table 4. The aliquots were measured in pairs on
each reader, so for each aliquot of the different known-dose samples, an
aliquot of RCQ (Batch #122) was also measured on the same wheel. We
have taken the average and standard uncertainty of the pair ratios to
avoid variability resulting from run to run variations.
We observe agreement between the two 137Cs sources (Risø and SIS)
and between the two 60Co sources, however we observe a consistent 4%
difference between 137Cs and 60Co. Autzen et al. (2021) recently sug
gested that the luminescence generated by a137Cs source should be 4%
higher than that generated by a60Co for the same dose because of the
slight differences in ionisation density produced by the two different
gamma energies. Gu´erin et al. (2018) observed an energy dependence
on the luminescence response of natural quartz when irradiating with
low energy x-rays compared to 137Cs Here, we observe this predicted 4%
difference between our two types of sources. Correcting for this differ
ence in luminescence generation we get Table 5.
Following the correction to the expected luminescence from 60Co we
observe complete agreement between all five sources used in the ex
periments. Table 4 supports the modelling hypothesis that the dose
given to RCQ should be increased by 8% to agree with the other irra
diation sources. It is interesting to note that the dry and wet irradiations
using the LFMD 60Co source does not result in a difference in dose rate.
This suggests that the medium between the grains does not played a
significant role in the final dose absorbed by the grains.
Table 3
Sources of error for dose estimate.
Error component
Increase in dose compared to original
calculation (with estimated uncertainty, k = 1)
Contribution from build up of
scattered photons in cell
Error in positioning
Backscattered photons from
support material
Contribution from build-up in air
Relative combined dose change
3.5 ± 0.5%
1.25 ± 0.25%
1.6 ± 0.5%
1.3 ± 0.5%
8.25 ± 1.00%
factors are ratio quantities close to unity, other non-statistical compo
nents of the uncertainty will cancel.
4. Comparing RCQ with material irradiated at other sources
Having identified a number of errors in previous batches of RCQ,
batch 122 was irradiated in the Nucomat facility at Risø and the dose
calculated making allowance for all the factors listed in Table 3. To gain
additional confidence in the dose given, we compare with irradiations
performed in three other γ sources. Unirradiated calibration quartz
(Batch #122) was used for the comparison.
(a) Danish Health Authority – Radiation Protection (SIS)
A137Cs point source in a scatter-free geometry at the Radiation
Protection division (SIS) of the Danish Health Authority with air kerma
calibration traceable to PTB, Germany. We used our planar geometry
and a new sample holder with no rear support to avoid backscatter and
ensure that the sample was centred on the desired distance. The sample
holder was centred on a distance of 1 m from the source and given 2.00
Gy air kerma, with an estimated total calibration uncertainty of 1.4% (k
= 1). This air kerma is, according to the modelling presented in Table 2,
equivalent to a dose to quartz of 2.00 ± 0.03 Gy.
5. Discussion and conclusion
Using Geant4 modelling we have tested the validity of the simple
calculations of γ dose delivered to RCQ used over the past 30 years.
Modelling shows that while these calculations were indeed correct, they
were also incomplete. Because the contributions from photons scattered
within and from behind the irradiation cell were neglected, and because
the cell was inadvertently placed 1–1.5 cm closer to the source than
intended, the γ dose given to RCQ was underestimated by 8% prior to
Batch #122. Using the new estimate of given dose gives results consis
tent with those obtained using the same source material irradiated in by
different sources traceable to both PTB (the same primary standard used
for RCQ), NPL and Bureau International des Poids et Mesures (BIPM,
France).
The exact correction factor needed for each batch of RCQ (see
Table 6) is not well-known, because of small variations in the distance to
the source and the amount of backscatter through time. We estimate the
average increase to be 8.25%, with an uncertainty of 2%. This correction
should be applied to RCQ calibrations from Batch 1 to Batch 121.
(b) Therapy Cobalt source (LFMD)
A60Co point source is located at the Laboratory for Fundamental
Medical Dosimetry (LFMD) at DTU Health, Risø Campus, with trace
ability to PTB for absorbed dose to water. The sample was irradiated in a
plastic housing designed for ionisation chambers at a distance of 1 m and
given a dose to water of 4.956 ± 0.017 Gy (k = 1) at 5 cm depth centred
in a 30 cm × 30 cm x 30 cm water phantom. The sides of the water
phantom were simulated as 5 mm thick perspex with a 0.5 cm perspex
window. A further irradiation was carried out with the sample sus
pended in water inside the plastic housing at a depth of 5 cm, at the same
location.
The source geometry was simulated according to the specifications
provided. The ionisation chamber sleeve was modelled as a perspex tube
(ρ = 1.19 g cm− 3) with an outer diameter of 6 mm and an inner diameter
of 5 mm. The detector was simulated as a water (ρ = 1.00 g cm− 3) or
quartz cylinder with a height of 26 mm, centred on the plane of the
beam. The 60Co source was simulated as a point source at 1 m distance
from the centre of the sample with a radial emission due to the water
phantom. Using these parameters we obtained a ratio of dose to quartz
to dose to water of 0.944 ± 0.02 (at k = 1).
Table 4
Comparison of dose rates from the same source material irradiated with different
sources. The irradiated sample was divided into multiple aliquots for lumines
cence readout as indicated.
Gamma irradiation
facility
137
Cs, Nucomat (RCQ
standard)
137
Cs, SIS
(c) Gamma Cell 1 (GC1)
This is a shielded 60Co laboratory irradiator with cobalt source
pencils arranged in a ring around the irradiation position (inner diam
eter of the source ring ~150 mm) located at the High Dose Reference at
DTU Health, Risø Campus, and traceable to the National Physical Lab
oratory (NPL), UK); this is a national standard for Denmark. The sample
was irradiated in a thin plastic tube surrounded by build-up material and
4
N (# of paired
aliquots)
Dose
given
Dose Rate Ratio to
Standard Irradiation
–
5.22 ±
0.05 Gy
2.00 ±
0.03 Gy
4.53 ±
0.04 Gy
4.49 ±
0.01 Gy
4.49 ±
0.01 Gy
1
76
60
Co, GC1
76
60
Co, LFMD (Dry)
36
60
Co, LFMD (Wet)
24
1.001 ± 0.011
1.043 ± 0.014
1.042 ± 0.013
1.043 ± 0.013
M. Autzen et al.
Radiation Measurements 157 (2022) 106828
interests or personal relationships that could have appeared to influence
the work reported in this paper.
Table 5
Comparison of dose rates from the same source material irradiated with different
sources, corrected for the modelled difference in ionisation density of137Cs
and60Co.
Gamma irradiation
facility
137
Cs, Nucomat (RCQ
standard)
137
Cs, SIS
N (# of paired
aliquots)
Dose
given
Dose Rate Ratio to
Standard Irradiation
–
5.22 ±
0.05 Gy
2.00 ±
0.03 Gy
4.53 ±
0.04 Gy
4.49 ±
0.01 Gy
4.49 ±
0.01 Gy
1
76
60
Co, GC1
76
60
Co, LFMD (Dry)
36
60
Co, LFMD (Wet)
24
Data availability
Data will be made available on request.
Acknowledgements
1.001 ± 0.011
The authors would like to thank Dr. Peter Kaidin Frederiksen and Dr.
Anders Ravnsborg Beierholm from SIS for the irradiations performed at
SIS. M. Autzen receive funding from the European Research Council
(ERC) under the European Union’s Horizon 2020 research and innova
tion programme ERC-2014-StG 639904 – RELOS.
1.003 ± 0.014
1.002 ± 0.013
1.003 ± 0.013
References
Table 6
Average batch specific dose correction.
Batch No.
Dose on package
Correction needed
1–121
122–125
126 -
4.82 Gy (Some variation in earlier batches)
5.00 Gy
6.00 Gy
8.25%
4.4%
0.0%
Agostinelli, S., Allison, J., Amako, K., Apostolakis, J., Araujo, H., Arce, P., et al., 2003.
(Geant4 Collaboration). Geant4 – a simulation toolkit. Nucl. Instrum. Methods Phys.
Res., Sect. A 506 (3), 250–303.
Allison, J., Amako, K., Apostolakis, J., Araujo, H., Arce, P., Asai, M., et al., 2006. (Geant4
Collaboration). Geant4 development and applications. IEEE Trans. Nucl. Sci. 53 (1),
270–278.
Autzen, M., Gu´erin, G., Murray, A.S., Jain, M., Buyalert, J.-P., 2021. Comparing natural
and laboratory irradiations: a simulation approach. J. Lumin. 238, 118272.
Berger, M.J., 1993. NISTIR 4999. National Institute of Standards and Technology,
Gaithersburg, MD.
Berger, M.J., Coursey, J.S., Zucker, M.A., Chang, J., ESTAR, P.S.T.A.R., ASTAR, 2005.
Computer Programs for Calculating Stopping-Power and Range Tables for Electrons,
Protons, and Helium Ions. version 1.2.3) [Online] Available:. National Institute of
Standards and Technology, Gaithersburg, MD />Bos, A.J.J., Wallinga, J., Johns, C., Abellon, R.D., Brouwer, J.C., Schaart, D.R.,
Murray, A.S., 2006. Accurate calibration of a laboratory beta particle dose rate for
dating purposes. Radiat. Meas. 41 (7–8), 1020–1025.
Gu´
erin, G., Mihailescu, L.-C., Jain, M., 2018. Photon energy (8-250 keV) response of
optically stimulated luminescence: implications for luminescence geochronology.
J. Lumin. 204, 135–144.
Hansen, V., Murray, A., Buylaert, J.P., Yeo, E.Y., Thomsen, K., 2015. A new irradiated
quartz for beta source calibration. Radiat. Meas. 81, 123–127.
Hansen, V., Murray, A., Thomsen, K., Jain, M., Autzen, M., Buylaert, J.-P., 2018. Towards
the origins of over-dispersion in beta source calibration. Radiat. Meas. 120, 157–162.
Kawrakow, I., Hing-Mainegra, E., Rogers, D.W.O., Tessier, F., Walters, B.R.B., 2017. The
EGSnrc Code System: Monte Carlo Simulation of Electron and Photon Transport,
PIRS-701. National Research Council Canada.
Richter, D., Autzen, M., Woda, C., Dornich, K., Murray, A.S. Comparison of beta dose
rates derived by transfer calibration from Risø and LexCal calibration quartzes.
Radiat. Meas.. Under review.
Tribolo, C., Kreutzer, S., Mercier, N., 2019. How reliable are our beta-source
calibrations? Ancient TL 37 (1), 1–10.
Starting with batch 122 in October 2019, the dose was corrected to 5.00
Gy in response to our updated simulations, however, this correction did
not take into account the distance and backscatter corrections, and so
calibrations performed with batch 122 to 125 should be corrected by an
average of 4.4%. Newer batches of RCQ (Batch 126 and onwards) now
use the fully updated correction factors and can be identified by the
given dose of 6.00 ± 0.12 Gy.
We observe that the luminescence generated from a137Cs source was
4% higher than the luminescence generated from a60Co source for the
same dose, in agreement with predictions from the modelling of Autzen
et al. (2021). This has significant implications for luminescence dosim
etry, because the luminescence generated by different γ sources is usu
ally regarded as energy independent. Further investigations are
necessary to determine how far these differences extend but preliminary
modelling suggests that identical gamma doses from different isotopes
or spectra may not give rise to an identical luminescence response.
Declaration of competing interest
The authors declare that they have no known competing financial
5