Multiple equilibria describe the complete adsorption isotherms of nonporous, microporous, and mesoporous adsorbents
Bạn đang xem bản rút gọn của tài liệu. Xem và tải ngay bản đầy đủ của tài liệu tại đây (5.53 MB, 11 trang )
Microporous and Mesoporous Materials 330 (2022) 111563
Contents lists available at ScienceDirect
Microporous and Mesoporous Materials
journal homepage: www.elsevier.com/locate/micromeso
Multiple equilibria describe the complete adsorption isotherms of
nonporous, microporous, and mesoporous adsorbents
Gion Calzaferri a, *, Samuel H. Gallagher b, Dominik Brühwiler b, **
a
b
Department of Chemistry, Biochemistry and Pharmaceutical Sciences, Freiestrasse 3, 3012 Bern, Switzerland
Institute of Chemistry and Biotechnology, Zurich University of Applied Sciences (ZHAW), 8820 Wă
adenswil, Switzerland
A R T I C L E I N F O
A B S T R A C T
Keywords:
Stă
ober-type particles
Zeolite L
MCM-41
Type I
Type II
Type IV
Type VI adsorption isotherms
Cluster
Cavity
Sequential chemical equilibria
The adsorption of simple gases begins with the formation of a monolayer on the pristine surface, not always
followed by the formation of a second or more monolayers. Subsequently, cluster formation or cavity filling
occurs, depending on the properties of the surface. The characteristically different shape of the isotherms related
to these processes allows to clearly differentiate them. We analyzed argon and N2 adsorption isotherms quan
titatively over the entire relative pressure range for adsorbents bearing different properties: the nonporous
Stă
ober-type particles, the microporous zeolite L (ZL) and zeolite L filled with indigo (Indigo-ZL), and three
mesoporous silica adsorbents of different pore size. The formal equilibria involved in cluster formation and in
cavity filling have been derived and successfully applied to quantitatively describe the isotherms of the adsor
bents. No indication regarding formation of a second monolayer on top of the first one was observed for the
Stă
ober-type particles. Instead, cluster generation, which minimizes surface tension, starts early. The behavior of
microporous ZL and of Indigo-ZL is different. A second monolayer sets up and cluster formation starts with some
delay. The enthalpy of cluster formation is, however, practically identical with that seen for the Stă
ober-type
particles. The difference between the experimental and the calculated inflection points is very small. The shapes
of the isotherms seen for the mesoporous adsorbents differ significantly from those seen for the nonporous and
for the microporous adsorbents. The quantitative analysis of the data proves that formation of a second
monolayer is followed by filling of cavities which ends as soon as all cavity sites are filled. The sum of the in
dividual fractional contributions, namely the monolayer formation ΘmL, the appearance of a second monolayer
Θ2L on top of the first one, and the cavity filling Θcav , yields a calculated adsorption isotherm Θcalc which de
scribes the experimental data Θexp well. The experimental and the calculated first inflection points are in
excellent agreement, which is also the case for the second inflection points. The value of the cavity filling
enthalpy is roughly 10% larger than that for the cluster formation seen in the nonporous and the microporous
adsorbents. The volume for cavity filling is significantly smaller than the monolayer volume for the mesoporous
adsorbent with a pore diameter of 2.7 nm, while it is the same or larger for pore diameters of 4.1 nm and 4.4 nm,
respectively. We conclude that understanding the adsorption isotherms as signature of several sequential
chemical equilibrium steps provides additional information data for clusters, cavities, and position of the in
flection points, not accessible by means of the conventional models. The theory reported herein covers type I, II,
IV and to some extent also type VI isotherms.
1. Introduction
An important goal when studying adsorption isotherms is to deter
mine the specific surface area AmL, the volume VmL of adsorptive bound
as a monolayer, and the binding strength measured by the enthalpy
Δads H∅ of adsorption [1–9]. This information refers to the low relative
pressure range of the isotherm to make sure that the data are charac
teristic of the adsorptive-adsorbent interaction. A successful theory that
allows obtaining the desired knowledge goes back to Irving Langmuir
who already in 1918 mentioned that a surface can consist of different
* Corresponding author.
** Corresponding author.
E-mail addresses: (G. Calzaferri), (D. Brühwiler).
URL: (G. Calzaferri), (D. Brühwiler).
/>Received 22 September 2021; Received in revised form 4 November 2021; Accepted 8 November 2021
Available online 15 November 2021
1387-1811/© 2021 The Authors.
Published by Elsevier Inc.
This is an open access
( />
article
under
the
CC
BY-NC-ND
license
G. Calzaferri et al.
Microporous and Mesoporous Materials 330 (2022) 111563
sites and that in such cases isotherms should be described as a linear
combination of individual isotherms [10,11]. This led, many years later,
to the description of systems consisting of several sites with different
ease of adsorption and for multi-component gas analysis by means of
DSL, dual-site Langmuir, and DPL, dual-process Langmuir [12–27]. We
have extended the analysis of multiple equilibria of compounds with
different coordination sites [28] to the explanation of adsorption iso
therms for adsorbates bearing different sites, focusing on the low rela
tive pressure range, i.e., on conditions where the adsorptive-adsorbent
binding strength is larger than the adsorptive-adsorbate, so that mono
layer coverage is favored [29]. We found on a rigorous basis that this
leads to Langmuir’s equation for each site independently, so that the
total fractional amount of bound adsorptive can be described as linear
combination of individual Langmuir isotherms. This allows to accurately
determine the specific surface area, the volume of adsorptive bound as a
monolayer, and the adsorption enthalpy. We are now interested in un
derstanding the adsorption process taking place once monolayer
coverage has been realized. The related problem can be well specified by
observing the difference between the experimental adsorption isotherm
and the monolayer coverage as a function of the relative pressure prel of
the adsorptive. The relative pressure prel is defined by eqn (1), where p is
the experimental pressure and p0 is the saturation pressure of the gas at
the experimental temperature.
prel =
p
p0
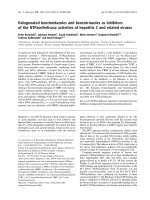
ăber-type silica particles [30], microporous zeolite L [31,32], and
Sto
mesoporous silica, average pore diameter of 4.4 nm [33,34]. The
isotherm (A) is classified according to IUPAC as type II, (B) as type I and
(C) as type IV [5,6]. Further examples can be seen in Figs SI1-SI4. The
blue curves represent the experimental values Θexp . The monolayer
coverage isotherm ΘmL is shown as red line. Its shape corresponds to type
I isotherms. The difference ΔΘ is shown as black dash-dot line.
We observe that the difference ΔΘ between the experimental data
and the monolayer coverage is of characteristically different shape for
ăberthe three types of adsorbents. The curve for the nonporous Sto
type particles seen in Fig. 1(A) shows a constant rise of the total volume
of additional adsorptive bound with increasing pressure. This means
that the adsorption isotherm Θexp consists of the first formed monolayer
described by ΘmL and of surface tension minimizing clusters formed on
top of it at larger relative pressure. There is no upper limit for cluster
formation. We express the corresponding fractional coverage by Θclust .
The process results finally in condensation when approaching saturation
pressure. We do not describe the condensation process but focus on the
adsorption including cluster formation at the surface of the previously
formed monolayer. We analyze data up to prel ≤ 0.9 in order to avoid the
region where condensation in inter-particle voids may start to
contribute. The adsorption isotherm in terms of the fractional coverage
Θ can therefore be expressed by means of eqn (4).
(1)
Θ = ΘmL + Θclust
The S-shape of the ΔΘ curve for the microporous zeolite L in Fig. 1(B)
indicates the presence of two sequential processes. Zeolite L shows a
ăber-type particles
30% larger enthalpy of adsorption than seen for the Sto
(see Table 2, ref [29]). This indicates that the monolayer is more
strongly bound to the polar surface of zeolite L. Therefore, extensive
monolayer coverage is already realized at small relative pressure. The
consequence is that the probability of building a second monolayer, the
corresponding fractional coverage we express by Θ2L, on top of the first
one increases and cluster formation starts at a later stage, a fact that
should be reflected by the binding strength. Eqn (4) must be extended as
expressed in eqn (5) as a consequence. We further observe that the total
volume of adsorptive bound by these two processes is much smaller than
VmL. This is understandable because the micropores are already filled
and only the outer surface of the particles is accessible.
It is convenient to picture the isotherms by using the notion of the
fractional coverage Θ, which is defined by the volume adsorbed Vads at a
given relative pressure prel divided by the complete monolayer adsorp
tion volume VmL, according to eqn (2). This allows a more comprehen
sible view of the properties of different adsorbents and of the different
adsorption processes.
Θ=
Vads
VmL
(2)
The adsorption of simple gases begins with the formation of a
monolayer on the pristine surface, not always followed by formation of
second or supplementary layers. Subsequently, cluster formation or
cavity filling occurs, depending on the properties of the surface. The
characteristically different shape of the isotherms related to these pro
cesses allows clear differentiation. It is therefore interesting to study the
difference ΔΘ between the experimental adsorption isotherm Θexp and
the monolayer coverage ΘmL as a function of the relative pressure prel.
This is expressed by eqn (3).
ΔΘ = Θexp − ΘmL
(4)
Θ = ΘmL + Θ2L + Θclust
(5)
A different situation is seen for the mesoporous silica adsorbent in
Fig. 1(C). The ΔΘ curve shows, after an initial period, first a moderate
increase followed by a step and a nearly flat continuation. This also
indicates the formation of a second monolayer, despite the fact that the
enthalpy of adsorption is identical to that of the Stă
ober-type particles
(see Table 2, ref [29]). This is followed by the almost instantaneous
filling of cavities that ends as soon as all cavity sites are completely filled
(3)
We use the ΘmL data reported in Ref. [29]. The calculated difference
ΔΘ is illustrated in Fig. 1 for three different adsorbents, nonporous
Fig. 1. Adsorption isotherms of Ar versus the relative pressure prel, measured at 87 K for a nonporous (A), a microporous (B), and a mesoporous (C) adsorbent. The
blue lines with the squares are the experimental data Θexp . The red lines show the shape of the monolayer adsorption coverage ΘmL . The black dash-dot lines are the
difference ΔΘ between the experimental Θexp and the monolayer formation isotherms ΘmL , eqn (3). The position of the experimental inflection point is shown as pink
vertical dash-dot line. (A) Stă
ober-type particles; VmL = 3.7 cm3/g. (B) Zeolite L; VmL = 88 cm3/g (C) MCM-41 (4.4 nm); VmL = 251 cm3/g [29]. (For interpretation of
the references to colour in this figure legend, the reader is referred to the Web version of this article.)
2
G. Calzaferri et al.
Microporous and Mesoporous Materials 330 (2022) 111563
[35]. The volume of available cavities defines the upper limit of the
process. This is in contrast to the cluster growth. We describe the cavity
filling fractional coverage using Θcav . The experimental adsorption
isotherm can therefore be expressed by means of eqn (6A) in absence
and as eqn (6B) in presence of a second monolayer. The total volume of
adsorptive bound by the cavity filling amounts to approximately twice
the value of VmL for monolayer coverage.
Θ = ΘmL + Θcav
(6A)
Θ = ΘmL + Θ2L + Θcav
(6B)
conducted by cooling with a liquid nitrogen bath. The saturation vapor
pressure p0 was experimentally determined during the measurements.
2.3. Data analysis
The Levenberg-Marquardt method [37] was used for the numerical
evaluation of the experimental data and to determine the parameters. It
is important to first analyze the low relative pressure region, so that the
monolayer coverage isotherm can be characterized separately. The
higher relative pressure region can then be analyzed with high accuracy
as reported in the theoretical section. Mathcad features for solving
problems analytically and numerically were used to determine the in
flection points [38].
The goal of this study is to describe and to test this qualitative
description quantitatively. This means that we attempt to understand
the processes by means of equations that allow expressing fractional
coverage for cluster formation Θclust and for cavity filling Θcav as a
function of the relative pressure prel. There is a natural way to achieve
this goal, namely by expressing the processes involved as multiple
equilibria, as we have done for describing, e.g., cation exchange of ze
olites [28] and for interpreting the adsorption isotherms of nonporous,
microporous, and mesoporous adsorbents in the low relative pressure
range [29]. We show that following this strategy leads to two expres
sions, one of them describing the cluster formation Θclust and the other
the cavity filling Θcav as a function of the relative pressure prel. The basis
for both is the same, but the consequences differ by the fact that the
sudden filling of cavities ends as soon as all cavity sites are occupied,
while cluster formation is not limited by this condition. The results are
tested by applying them to a significant number of different adsorption
isotherms mostly with Ar as adsorptive and some with N2. Enthalpies of
adsorption, inflection points, and the volume adsorbed by cluster for
mation or cavity filling are determined. Our results fill a longstanding
gap as complete isotherms, not only a specific part, can be described
based on the same principle, namely by analyzing multiple chemical
equilibria, and that we can quantitatively distinguish between the
different steps involved in the adsorption process.
3. Theory
The cluster formation and the cavity filling equilibria can be
expressed as reported in Table 1. X denotes the concentration of
adsorptive and L symbolizes the concentration of surface positions on
which the clusters are formed or, respectively, the concentration of
cavity positions where X can be adsorbed. Hence, both processes are
represented by sequential equilibria, similar to what we have discussed
in Ref. [28]. There is a formal resemblance to the equilibria formulated
for protein interactions with small molecules [39].
It is convenient to express the equilibria in Table 1 by means of the
stoichiometry matrix as explained in Refs. [41–43], where the labels
2.1. Materials
with the bar are the logarithm of the corresponding object: value =
log(value). We further use ci = [LXi ]/c∅ and hence: ci = log([LXi ] /c∅ ).
This allows writing eqn (7):
⎞
⎛
⎛
⎞⎛ cn ⎞
1− 10 0 000 0 − 1
K ⎟
cn− 1 ⎟ ⎜
⎜ n ⎟
⎜ 0 1 − 1 0 0 0 0 0 − 1 ⎟⎜
⎟ ⎜ K n− 1 ⎟
⎜
⎟⎜
c
⎜
⎟
⎜
⎜ 0 0 1 − 1 0 ⋅ ⋅ 0 − 1 ⎟⎜ n− 2 ⎟ ⎜ K n− 2 ⎟
⎟
⎜
⎟ ⋅ ⎟ ⎜
⎟
⎜ ⋅ ⋅ ⋅ ⋅ ⋅ ⋅ ⋅ ⋅ ⋅ ⎟⎜
⎟
⎟=⎜⋅
⎜
⎟⎜
⋅
⎜
⎟
⎟
⎜
⎜ ⋅ ⋅ ⋅ ⋅ ⋅ ⋅ ⋅ ⋅ ⋅ ⎟⎜
⎟
⎟
⎜
⋅
⎜
⎟⎜ ⋅ ⎟ ⎜
⎟
⎝ ⋅ ⋅ ⋅ ⋅ 0 ⋅ − 1 0 − 1 ⎠⎝
⎟
⎠ ⎜⋅
c0
⎠
⎝
00 0 0 ⋅ 1 1 1
K1
X
ăber-type silica particles were synthesized and characterized
The Sto
as reported in Ref. [29]. Zeolite L (ZL) and Indigo-Zeolite L (Indigo-ZL)
are described in Refs. [29,36]. The synthesis of the MCM-41 type mes
Linear transformation of this equation leads to the solution we ex
press in eqn (8) [42,43].
2. Experimental
⎛
1
⎜0
⎜
⎜0
⎜
⎜⋅
⎜
⎜⋅
⎜
⎝⋅
0
0
1
0
⋅
⋅
⋅
0
0
0
1
⋅
⋅
⋅
0
0
0
0
⋅
⋅
⋅
0
0
0
0
⋅
⋅
⋅
⋅
0
0
⋅
⋅
⋅
⋅
⋅
0
0
⋅
⋅
⋅
0
1
−
−
−
⋅
⋅
−
−
1
1
1
1
1
−
−
−
⋅
⋅
−
−
⎞⎛ cn
n
⎜ cn−
(n − 1) ⎟
⎟⎜
⎜c
⎟
(n − 2) ⎟⎜ n−
⋅
⎟⎜
⎟⎜
⋅
⎟⎜
⎟⎜
⎜⋅
⎠
2
⎝
c0
1
X
⎞
1
2
(7)
⎞
⎛
⎜ K + K n− 1 + ... + K 1 ⎟
⎟
⎟ ⎜ n
⎟ ⎜ K n− 1 + K n− 2 + ... + K 1 ⎟
⎟
⎟ ⎜
⎟ ⎜ K n− 2 + K n− 3 + ... + K 1 ⎟
⎟
⎟ ⎜
⎟
⎟=⎜⋅
⎟
⎟ ⎜
⎟
⎟ ⎜⋅
⎟
⎟ ⎜
⎟
⎠ ⎜⋅
⎠
⎝
K1
(8)
oporous silica materials with an average pore diameter of 4.4 nm, 4.1
nm and 2.7 nm is reported in Ref. [29].
It is natural within this context to choose X and c0 as free variables.
This allows writing eqn (9).
2.2. Physical measurements
i
∑
Prior to sorption measurements, the samples were vacuum-degassed
at 150 ◦ C for 3 h. The adsorption isotherms were measured with a
Quantachrome Autosorb iQ MP. A CryoCooler was used for the mea
surement of argon adsorption at 87 K. Measurements at 77 K were
ci = c0 + iX +
Kj
j=1
The form of eqn (9) becomes now more useful:
3
(9)
G. Calzaferri et al.
Microporous and Mesoporous Materials 330 (2022) 111563
Table 1
Sequential equilibria describing cluster formation and cavity
filling.
Equilibria
Equilibrium constantsa
L + X⇌LX
LX + X⇌LX 2
.
.
.
[LX]c∅
K1 =
[L][X]
[LX2 ]c∅
K2 =
[LX][X]
.
.
.
LXn− 1 + X⇌
LX n
Kn =
cclust = c0
[X] =
[LXn ]c∅
[LXn− 1 ][X]
The symbol c∅ stands for the concentration unit in order to
make sure that the equilibrium constants are dimensionless.
ci = c0 [X]
(17)
(p
)
0
RT
Kclust
(18)
It is convenient to replace the expression in parenthesis, which is
dimensionless, by the symbol kC.
)
(p
kC = 0 Kclust
(19)
RT
j=1
A simplification of eqn (10) is possible if the adsorptive-adsorbate
binding strength does not or only very weakly depend on the amount
of adsorptive already bound, which means that Kj is equal to the equi
librium constant K. It applies similarly for cluster formation as for cavity
filling. This condition is expected to hold for the adsorptives Ar and N2
investigated in the present study. The following arguments apply simi
larly if it is necessary to distinguish between two or more interactions.
The result is then a corresponding linear combination of expressions
addressing the individual situations, similarly to our discussion in
Ref. [28]. We show this in the SI5. However, it turns out not to be needed
in the present study, which means that eqn (10) can be simplified as
follows:
The total amount of X adsorbed into clusters is measured in terms of
adsorbed volume ΔVclust and the parameter c0, according to eqn (15,16),
which we name V0clust . Using this we can write the final result, eqn (20),
which describes the amount of adsorptive adsorbed as clusters as a
function of the relative pressure.
ΔVclust = V0clust
kC prel
(1 − kC prel )2
(20)
It is convenient to write this in terms of the fractional coverage Θclust
by dividing eqn (20) by the adsorbed volume for total monolayer
coverage VmL, as we have explained in eqn (2). We can thus express this
in terms of fractional amount of cluster-bonded X as follows:
(11)
ci = c0 ([X]K)i
p0
p
RT rel
[X]Kclust = prel
(10)
Kj
(16)
In the isotherms we investigate the volume of the adsorbed gas and
measured as a function of the relative pressure prel of the adsorptive X.
Using the ideal gas law for expressing the concentration of X in the gas
phase according to eqn (17), we write eqn (18), where p0 is the satu
ration pressure of the gas at the experimental temperature, as introduced
in eqn (1).
a
i
∏
i
[X]Kclust
(1 − [X]Kclust )2
Θclust = Θ0clust
The total concentration of X is equal to the sum of the concentrations
ci multiplied by the number i of X bound according to the equilibria
expressed in Table 1.
kC prel
(1 − kC prel )2
(21)
The algebraic equality of cluster formation and of cavity filling ends
here. We must now distinguish between them, and we start with the
cluster formation equilibria.
This is the final result which describes the cluster formation on a
surface covered by one or eventually also more than one monolayer of
adsorptive X. When using this equation we must pay attention to the
condition that the parameter q and hence also the product kC prel must be
positive and smaller than 1. Fig. 2(A) illustrates the dependence of Θclust
on the relative pressure prel for different values of the constant kC. We
observe that the shape of the curve is very sensitive to the value of the
equilibrium constant.
3.1. Adsorption by cluster formation on a monolayer
3.2. Adsorption by cavity filling
To find the description for cluster formation we substitute ci in eqn
(12) by the expression eqn (11) and use the symbol cclust . We also specify
the equilibrium constant K as Kclust. Hence, the concentration of species
that are present in the adsorbed clusters as a function of the concen
tration of free adsorptive X can be expressed as follows:
The description of cavity filling must take into account that the
number of cavities is limited and therefore also the amount of adsorptive
that can be bound by them. Equations (11) and (12) remain valid and in
eqn (13) we need only to substitute the symbols cclust and Kclust by ccav
and Kcav, respectively. Hence, the concentration of species adsorbed into
cavities as a function of the concentration of free adsorptive X can be
expressed by means of eqn (22)
n
∑
(12)
i⋅ci
ctot =
i=1
n
∑
cclust = c0
(13)
i([X]Kclust )i
i=1
n
∑
This equation converges rapidly for situations where the product q =
[X]Kclust , which has only positive values, is smaller than 1, a condition
that is easily met as we shall see. We write therefore:
{
}
∞
∞
∞
∑
∑
∑
(14)
cclust = c0
kqk = c0
(k + 1)qk −
qk
k=0
k=0
ccav = c0
n
∑
Λcav = c0 +
k=0
q
(1 − q)2
(22)
We denote the total concentration of cavities bearing adsorption sites
for X as Λcav and express it by means of eqn (23):
This equation converges for 0 ≤ q < 1 and leads to the interesting
result in eqn (15).
cclust = c0
i([X]Kcav )i
i=1
ci
(23)
i=1
The relative coverage Qcav of the cavities by the adsorptive X is
therefore equal to the ratio of ccav and Λcav:
(15)
Qcav =
We insert the expression for q and write eqn (16):
4
ccav
Λcav
(24)
G. Calzaferri et al.
Microporous and Mesoporous Materials 330 (2022) 111563
Fig. 2. Illustration of eqn (21), (A), and eqn (26), (B,B′ ), describing cluster formation and cavity filling, respectively. (A): Dependence of the fractional coverage Θclust
by cluster-bonded X as a function of the relative pressure for different values of the constant kC according to eqn (21). The values of Θclust are scaled to the same
height at prel = 0.9; red solid: kC = 0.1; blue dot: kC = 0.3; green dash: kC = 0.5; violet dash-dot: kC = 0.7; light blue solid: kC = 0.9; brown dot: kC = 1. (B) and (B′ ):
Dependence of the relative coverage Qcav on the parameters kcav and n as a function of the relative pressure prel. (B): Qcav is shown for the values kcav equal to 1, 1.2,
1.5, 2, 3, and 6 as indicated in the figure for equal values of n = 100. (B′ ) illustrates the scaled value of Qcav (Qcav/max(Qcav)) for n = 10, 20, 40, 80, 90, 100 for equal
values of kcav = 2.5. (For interpretation of the references to colour in this figure legend, the reader is referred to the Web version of this article.)
Substituting ccav by means of eqn (22) and ci by the expression (11)
leads to eqn (25).
∑n
i
i=1 i([X]Kcav )
Qcav =
(25)
∑
n
1 + i=1 ([X]Kcav )i
formation. As the pressure is increased, additional multilayers are
gradually adsorbed, followed by a sudden step in the same range of prel
corresponding to capillary condensation in uniform and regular pores
[45]. The total amount of X adsorbed into cavities is measured in terms
of adsorbed volume ΔVcav and can be expressed analogous to eqn. (20)
as follows:
∑n
i
i=1 i(prel kcav )
ΔVcav = Θ0cav VmL
(28)
∑
n
1 + i=1 (prel kcav )i
There is a formal resemblance to the equilibria formulated for pro
tein interactions with small molecules [39] and discussed recently in
connection with aspects of type IV and type V isotherms [40]. The
concentration [X] can be substituted by prel the same way as explained in
eqn (17) - (19). This leads to eqn (26) for the relative coverage Qcav as a
function of the relative pressure prel.
∑n
i
(p
)
0
i=1 i(prel kcav )
Qcav =
with kcav =
(26)
Kcav
∑
n
i
RT
1 + i=1 (prel kcav )
3.3. Comparison of monolayer formation, cluster formation, and cavity
filling
Equations (21) and (27) allow comparing the shape of isotherms
resulting from the formation of monolayers, clusters on top of such
monolayers, and cavity filling. We refer to situations, where monolayer
formation is described as linear combination of Langmuir isotherms as
expressed in eqn (29) [10,11,28]. We use the combination of two iso
therms, because it has been observed to be adequate for many situations
[12–27,29].
We can, of course, not apply the extrapolation to very large values of
n, as we have done for cluster formation, because the number of avail
able sites in the cavities is limited [44]. It is instructive to get an idea
regarding the dependence of Qcav not only on the value of the equilib
rium constant but also on the number n of X in a fully occupied cavity.
This information is presented in Fig. 2(B,B’).
We observe, that eqn (26) describes the step seen in the difference Δ
Θ we have reported in Fig. 1 for the isotherms of the mesoporous silica
adsorbents. The value of prel at which this step occurs is very sensitive to
the value of the equilibrium constant. The dependence of the steepness
on the number of positions n in the cavity is significant for values smaller
than about 80. This means that the number of n can be distinguished by
means of adsorption isotherms only for very small cavities with n < 80.
It follows that the description remains valid for situations where not all
cavities are of the same size but distributed within a certain range. We
will in such cases therefore always use n = 100 in our analysis. This
correspond for argon to a cavity diameter of about 2 nm and means that
their size is at least as large but can also be larger. The participation of
the relative coverage to the fractional coverage according to eqn (26) is
Θcav, which is equal to Qcav multiplied by a factor abbreviated as Θ0cav .
We therefore write eqn (27):
Θcav = Θ0cav Qcav
ΘmL =
1 ∑
KLi prel
ai
VmL i 1 + KLi prel
(29)
(27)
Cavity filling does not explain the moderate increase of the ΔΘ curve
observed in Fig. 1(C) prior to the step. It is the signature for the for
mation of a second monolayer on top of the first one as expressed by eqn
(6B). This is in line with results obtained by Carvalho et al. in a theo
retical analysis based on advanced Monte Carlo simulations including
the influence of surface irregularity and amorphous hexagonal pores.
The authors observed an initially rapid increase in the adsorbate amount
at very low relative pressures corresponding to the monolayer
Fig. 3. Graphical representation of the adsorption isotherms. The monolayer
coverage Θ = ΘmL is shown as green dash line. Cluster formation, eqns (4) and
(21) Θ = ΘmL + Θclust , is shown as red dash-dot line, and the characteristic
shape of cavity filling, eqns (6A) and (27) Θ = ΘmL + Θcav , is shown as blue
dash-dot line. The parameters used are reported in SI3. (For interpretation of
the references to colour in this figure legend, the reader is referred to the Web
version of this article.)
5
G. Calzaferri et al.
Microporous and Mesoporous Materials 330 (2022) 111563
The graphical representation of the adsorption isotherms by mono
layer coverage Θ = ΘmL eqn (29) with i = 1,2, by additional cluster
formation, eqn (4), Θ = ΘmL + Θclust , and by additional cavity filling, eqn
(6A), Θ = ΘmL + Θcav is presented in Fig. 3. The shape of the isotherms
corresponds to type I, type II and type IV according to IUPAC classifi
cation [5,6]. Fig. 3 illustrates very nicely the characteristically different
shape of the monolayer formation process, the formation of clusters, and
the cavity filling on top of the monolayer.
This concludes the theoretical section and we move to the analysis of
experimental data, where we evaluate to what extent this description
can account for the experimental observations and whether additional
information can be extracted.
in Fig. 1(A). This cluster formation equilibrium can be analyzed using
eqn (21). The result is reported in Fig. 4 for Ar isotherms measured at 87
K and at 77 K and for an isotherm using N2 as adsorptive and measured
at 77 K. A comparison of the calculated Θclust and the difference ΔΘ
between the experimental adsorption isotherm Θexp and the monolayer
coverage, eqn (3), as a function of the relative pressure prel is presented.
The calculated Θclust values plotted as red lines compare well with the
difference ΔΘ marked as blue line. This is supported by the residuals,
which is the difference between ΔΘ and Θclust , shown as green dash-dot
curves.
The constants resulting from this analysis are collected in Table 2.
The values of free enthalpy ΔclustG and also of the binding enthalpy
ΔclustH of cluster formation, as determined using eqn (34) in Ref. [29],
are smaller than those of the monolayer formation, as expected. They
are, however, larger than the enthalpy of vaporization which amounts to
6.506 kJ/mol for Ar and to 5.586 kJ/mol for N2 at the respective tran
sition temperatures [47]. The inflection point marks the point where the
curvature of the adsorption isotherm changes sign. It can be calculated
by evaluating the second derivative of Θ, which vanishes at this point
according to eqn (30).
4. Results and discussion
We apply the results reported in the theoretical section to the analư
ăber-type silica
ysis of three different adsorbents, the nonporous Sto
particles, the microporous zeolite L, and the mesoporous MCM-41 as
reported in Fig. 1 and Figs. SI1-SI4. The examination of the experimental
data includes the previously communicated low relative pressure
investigation using lc2-L (linear combination of 2 Langmuir isotherms)
[29], where the specific surface area, the volume of adsorptive bound as
a monolayer, and the binding strength are reported.
d2
Θ =0
dp2rel
(30)
The algebra of the calculation is outlined in the SI, section SI2. We
observe in Table 2 that the calculated inflection points and the experi
mental values match. It is interesting to compare the volume adsorbed
by monolayer formation VmL and the volume adsorbed by cluster for
mation ΔVclust at prel = 0.9. This can be calculated using eqn (31),
derived from eqn (20).
4.1. Adsorption by cluster formation on a monolayer
We start with the analysis of adsorption isotherms of the nonporous
ăber-type particles. These silica particles are well-known for their
Sto
almost perfect spherical morphology, their low polydispersity, and as
excellent nonporous reference materials for the investigation of
adsorption processes, provided that they have been calcined to remove
any residual microporosity [30,46]. The surface area of the samples used
in the present study amounts to 14 m2/g. Two sites were identified at
which the monolayer is formed, with the adsorption enthalpies
∅
Δads H∅
8 kJ/mol. The relative
1 = − 11 kJ/mol and Δads H2 = −
contribution of the two sites is approximately 0.8:3, Table 2 of ref. [29].
No indication of a second monolayer formation is observed. Instead,
cluster formation on top of the first monolayer takes place as illustrated
0
ΔV0.9
clust = Θclust VmL
0.9kC
(1 − 0.9kC )2
(31)
We observe that the amount of adsorptive bound by cluster forma
tion at prel = 0.9, 87 K, is roughly 1.4 times larger than that adsorbed as a
monolayer. We would also like to know how the calculated fractional
coverage Θcalc according to eqn (4) compares with the experimental
values Θexp over the whole range 0 < prel ≤ 0.9. The comparison
Fig. 4. Analysis of cluster formation on Stă
ober-type adsorbents. Blue squares: Difference between exp and the lc2-L Langmuir isotherm, eqn (3). Red solid:
Calculated isotherm Θclust according to eqn (21). Green dash-dot: Residuals (difference between ΔΘ and Θclust ), right axis. Light blue line: Zero reference for residuals.
(A,A‘) Ar at 87 K, (B,B‘) Ar at 77 K, and (C,C‘) N2 at 77 K. (For interpretation of the references to colour in this figure legend, the reader is referred to the Web version
of this article.)
6
G. Calzaferri et al.
Microporous and Mesoporous Materials 330 (2022) 111563
Table 2
Results for the Stă
ober-type silica particles.
Adsorptive
VmLa [cm3/g]
3
V0.9
clust [cm /g]
Kclust (kC)
0clust
clust H∅
i [kJ/mol]
Δclust G∅
i [kJ/mol]
infl. pointa
exp [prel]
infl. point
calc [prel]
Ar p0 = 1.069 bar, 87 K
Ar p0 = 0.260 bar, 77 K
N2 p0 = 0.983 bar, 77 K
3.7
2.8
3.3
5.3
–
4.6
4.73 (0.70)
23.3 (0.25)
4.41 (0.67)
0.31
3.6
0.38
− 7.56
− 7.76
6.69
1.08
2.02
0.95
0.35
0.35
0.26
0.34
0.36
0.29
a
From ref [29].
Fig. 5. Stă
ober-type particles, complete isotherms. (A,A‘) Ar at 87 K; (B,B‘) Ar at 77 K; (C,C‘) N2 at 77 K. Blue squares: Experimental isotherms Θexp versus the relative
pressure prel and versus log(prel). Red solid: Calculated isotherm Θcalc according to eqns (4) and (21). Green dash-dot: Residuals (difference Θexp - Θcalc ), right axis.
Light blue line: Zero reference for residuals. The position of the calculated inflection point is shown as red vertical dash-dot line. It matches with the experimental
one. The contributions of the monolayer adsorption ΘmL and the cluster formation Θclust are shown as an orange and as a violet dash-dot line, respectively. (For
interpretation of the references to colour in this figure legend, the reader is referred to the Web version of this article.)
reported in Fig. 5 shows good agreement. This supports our theoretical
reasoning.
indicated as orange dash-dot line. The residuals Θexp − Θcalc are well
distributed. It is interesting to compare the contributions of the second
monolayer Θ2L formed on top of the first one and the contribution due to
cluster formation Θclust . This comparison is shown in Fig. 6 (A′′ ) and (B′′ )
where we see the difference ΔΘ between the experimental adsorption
isotherm Θexp and the lc2-L monolayer coverage isotherm ΘmL according
to eqn (2). The red solid lines show the calculated isotherm ΔΘcalc =
Θ2L + Θclust . The dark-green and pink dash-dot lines illustrate the indi
vidual contributions Θclust and Θ2L , respectively. We observe for zeolite
L, Fig. 6(A′′ ), that the second monolayer has been developed to a large
extent before cluster formation takes place. This means that clusters are
formed on top of the second monolayer. Both contributions to ΔΘ are
about the same at prel = 0.9. The volume adsorbed by cluster formation
3
ΔV0.9
clust calculated using eqn (22) amounts to 12 cm /g and is therefore
less significant than the monolayer coverage volume VmL, which is 88
cm3/g, see Table 3. The cluster binding enthalpy Δclust H∅i is slightly less
favorable with respect to that for the second monolayer Δads H∅2L . How
ever, both are favorable with respect to the enthalpy of vaporization,
which amounts to 6.506 kJ/mol, as we have mentioned above. The
situation is less pronounced for Indigo-ZL, where we observe, in
contrast, that the relative contribution of the volume ΔV0.9
clust for cluster
formation at prel = 0.9 is more important than the monolayer coverage
volume and that it exceeds the value due to the second monolayer for
mation. The monolayer coverage volume VmL of the Indigo-ZL adsorbent
is, however, small with respect to the pristine zeolite L, because the
4.2. Formation of a second monolayer and adsorption by cluster
formation
We have observed that extensive monolayer coverage is already
realized at small relative pressure for the microporous zeolite L and that
the S-shape of the ΔΘ curve in Fig. 1(B) indicates the presence of two
processes. The monolayer is more strongly bound to the highly polar
ăber-type particles. The consequence is
surface of zeolite L than for the Sto
that large coverage is already realized at low relative pressure, which
favors the formation of a second monolayer, expressed as Θ2L, on top of
the first one, before cluster formation, which minimizes surface tension,
starts. This means that eqn (4) must be extended as expressed in eqn (5).
The formation of a second monolayer on top of the first one is expressed
in eqn (32), where a2L measures the amount of adsorptive bound as a
′
second monolayer and K2L is the corresponding equilibrium constant.
′
Θ2L = a2L
K2L prel
′
1 + K2L prel
(32)
The result of this description is reported in Fig. 6 and in Table 3 for
zeolite L (A), and for Indigo-ZL (B). The agreement between experi
mental data Θexp and the calculated values Θcalc , seen in Fig. 6 (A,A’) and
(B,B′ ), is good. The contribution of the monolayer coverage ΘmL is
7
G. Calzaferri et al.
Microporous and Mesoporous Materials 330 (2022) 111563
Fig. 6. Analysis of ZL (top), and of Indigo-ZL (bottom) isotherms. Ar at 87 K. (A,A′ ) and (B,B′ ): The blue line marked by squares denotes the experimental isotherms
Θexp . The red solid line shows the calculated isotherms Θcalc according to eqn (5) and the orange dash-dot curve shows the contribution of ΘmL . Green dash-dot lines
are the residuals. Light blue line: Zero reference for residuals. The positions of the experimental and the calculated inflection points are shown by blue and red
vertical dash-dot lines. (A′′ ,B′′ ) show the ΔΘ between the experimental adsorption isotherm Θads and the lc2-L monolayer coverage isotherm ΘmL . The red solid lines
show the calculated isotherm ΔΘcalc = Θ2L + Θclust and the green and pink dash-dot lines illustrate the individual contributions Θclust and Θ2L , respectively. (For
interpretation of the references to colour in this figure legend, the reader is referred to the Web version of this article.)
Table 3
Results for ZL and Indigo-ZL adsorbents. (Adsorptive: Ar, p0 = 1.069 bar, 87 K).
Adsorbent
VmLa [cm3/
g]
3
ΔV0.9
clust [cm /
g]
Kclust/kC
Θ0clust
Δclust H∅ [kJ/
mol]
Δclust G∅ [kJ/
mol]
K2L/a2L
Δads H∅
2L [kJ/
mol]
Δads G∅
2L [kJ/
mol]
infl. point expa/calc
[prel]
ZL
88
12
1.74
− 7.6
− 1.14
− 1.4
0.42/0.45
3.5
9
0.48
− 7.7
− 1.24
7.67/
18.5
0.45/
29.4
− 7.9
Indigo-ZL
4.81/
0.76
5.58/
0.88
− 5.9
0.58
0.30/0.37
a
From ref [29].
pores are blocked by the indigo molecules. As a consequence, only the
outer surface of the particles is accessible, so that this sample resembles
a nonporous adsorbent. The cluster binding enthalpies Δclust H∅i for the
ăber-type silica and for ZL at 87 K are equal, and that of the Indigo-ZL
Sto
differs by a non-significant amount. We observe that the calculated and
the experimental inflection points differ very little for zeolite L. They
also agree well for Indigo-ZL.
The value ΔV0.9
clust is small with respect to VmL for ZL but larger for
Table 4
Results for the mesoporous silica adsorbents with Ar and N2 as adsorptive. (Ar, p0 = 1.069 bar, 87 K; N2, p0 = 0.983 bar, 77 K).
Adsorbent
Adsorptive
VmLa
[cm3/g]
3
ΔV0.9
cav [cm /
g]
Kcav/
kC
Θ0cav
Δcav H∅ [kJ/
mol]
Δcav G∅ [kJ/
mol]
K2L/
a2L
Δads H∅
2L [kJ/
mol]
Δads G∅
2L [kJ/
mol]
infl. pt.
expa/calc
[prel]
Second infl.
pt. calc [prel]
MCM-41 (4.4
nm)
Ar, 87 K
MCM-41 (4.1
nm)
Ar, 87 K
MCM-41 (2.7
nm)
Ar, 87 K
MCM-41 (4.4
nm)
N2, 77 K
MCM-41 (4.1
nm)
N2, 77 K
MCM-41 (2.7
nm)
N2, 77 K
251
342
14.3/
2.3
0.014
− 8.4
− 1.9
0.42/
437
− 5.8
0.64
0.24/0.28
0.44
286
311
16.5/
2.6
0.011
− 8.5
− 2.0
0.86/
174
− 6.4
0.11
0.24/0.25
0.38
208
46
37.3/
5.9
0.007
− 9.1
− 2.6
b
b
b
0.09/0.11
0.17
151
168
16.3/
2.5
0.011
− 7.5
− 1.8
0.93/
333
− 5.7
0.05
0.22/0.25
0.41
169
170
19.6/
3.0
0.010
− 7.6
− 1.9
2.3/
189
− 6.3
− 0.54
0.21/0.22
0.34
100
36
54/
8.1
0.012
− 8.3
− 2.6
3.4/40
− 6.5
− 0.78
0.07/0.07
0.12
a
b
From ref [29].
These parameters could not be determined reliably and are therefore omitted.
8
)
)
)
Microporous and Mesoporous Materials 330 (2022) 111563
G. Calzaferri et al.
(caption on next page)
9
G. Calzaferri et al.
Microporous and Mesoporous Materials 330 (2022) 111563
Fig. 7. Isotherms of mesoporous silica MCM-41. (A,B,C): Ar at 87 K. (a,b,c): N2 at 77 K. (A),(a) MCM-41 (4.4 nm); (B),(b) MCM-41 (4.1 nm); (C),(c) MCM-41 (2.7
nm). Blue lines marked by squares: Experimental isotherms Θexp . Red solid lines: Calculated isotherms Θcalc . Green dotted lines: Residuals. Light blue line: Zero
reference for the residuals. Blue and red vertical dash-dot lines: Experimental and the calculated position of the inflection point in (A,B,C) and (a,b,c). The orange, the
dark green, and the pink dash-dot curves show the contributions of ΘmL , of Θ2L , and of Θcav to Θ. The blue lines marked by squares seen in (A′′ ,B′′ ,C′′ ) and (a”,b”,c”)
show the difference ΔΘ between the experimental isotherm Θexp and the lc2-L monolayer coverage isotherm ΘmL . The red solid lines show the calculated isotherm
ΔΘcalc = Θ2L + Θcav and the pink and the green dash-dot lines are the individual contributions Θcav and Θ2L , respectively. Red vertical dash-dot lines: Position of the
calculated second inflection point. (For interpretation of the references to colour in this figure legend, the reader is referred to the Web version of this article.)
Indigo-ZLIt is, however, similar for both adsorbents and indicates that
cluster formation takes place exclusively at the outer surface, which is of
similar magnitude for both adsorbents. This is supported by the fact that
the Δclust H∅ values are practically the same.
over the entire relative pressure range. Ar and N2 adsorption isotherms
were investigated for adsorbents bearing different properties: the
ăber-type particles, the microporous zeolite L, zeolite L
nonporous Sto
filled with indigo, and three mesoporous silica adsorbents with different
pore sizes. We analyzed the equilibria which resulted in cluster forma
tion and those which resulted in cavity filling. The formal equilibria can
be expressed for both cases in the same way. They differ in terms of the
conditions, which means no restriction for cluster growth and limitation
by the extension of cavities which limits the space for accepting
adsorptive. The equations describing the relative coverage due to cluster
formation and the relative coverage due to cavity filling have been
derived, eqn (21) and eqn (26), respectively. They have been success
fully used, by applying the results for monolayer formation reported
previously [29], to quantitatively describe the complete isotherms of
nonporous, microporous and mesoporous adsorbents. It is interesting
that no indication for the formation of a second monolayer on top of the
ăber-type particles. Instead, cluster for
first one is observed for the Sto
mation, which minimizes surface tension, starts early. The behavior of
the microporous zeolite L and the Indigo-ZL is substantially different. A
second monolayer emerges and cluster formation starts with some delay.
The enthalpy of cluster formation is, however, practically identical with
ăber-type particles. A finding which makes sense,
that seen for the Sto
because the clusters formed have the same purpose, namely to minimize
surface tension. In addition, the difference between the experimental
and the calculated inflection points is very small, a fact which underlines
the correctness of the description. The shape of the isotherms for the
mesoporous silica adsorbents differs very much from those seen for the
nonporous and for the microporous adsorbents as illustrated in Fig. 1(C),
where we have discussed that the ΔΘ curve shows, after an initial
period, first a moderate increase followed by a sharp step and a near flat
continuation. The quantitative analysis of the data proves that formation
of a second monolayer is followed by filling of cavities which ends as
soon as all cavity sites are filled. This is illustrated in Fig. 7 for Ar iso
therms measured at 87 K and for N2 isotherms measured at 77 K. In this
Figure the individual contributions are shown, namely the monolayer
formation ΘmL, the appearance of a second monolayer expressed as Θ2L,
and the fractional cavity filling contribution Θcav . The sum of these
contributions constitutes the calculated adsorption isotherm Θcalc,
which compares well with the experimental data Θexp. The experimental
and the calculated first inflection points agree very well. This applies
also for the second inflection point. The cavity filling enthalpy reported
in Table 4 is roughly 10% larger than that for the cluster formation of the
nonporous and the microporous adsorbents shown in Tables 2 and 3.
The volume for cavity filling is significantly smaller than VmL for mes
oporous silica with a pore diameter of 2.7 nm, while it is the same or
larger for the two other mesoporous silica adsorbents featuring pore
sizes of 4.1 and 4.4 nm. We conclude that understanding the adsorption
isotherms as signature of several sequential chemical equilibrium steps
as reported in Ref. [29] and in the present study is not only adequate but
provides us with interesting otherwise hidden additional information,
such as data for clusters, cavities, and precise positions of the inflection
points presented in Tables 2–4, not accessible by means of the conven
tional models. The theory presented covers type I, II and IV isotherms
and can be extended to type VI as shown in Fig. SI5. It is based on a
thermodynamic concept and applies for many situations.
4.3. Formation of a second monolayer and adsorption by cavity filling
We have seen in Fig. 1(C), SI3, and SI4 that the ΔΘ curve shows, after
an initial period, first a moderate increase followed by a step and a
nearly flat continuation for all mesoporous silica adsorbents for both
adsorptives Ar and N2. The adsorption isotherms resemble in all cases
the blue dash-dot curve in Fig. 3 which describes the Θ = ΘmL + Θcav
function. They also show, however, an additional contribution which
can be attributed to a second monolayer formation Θ2L . This means that
eqn (6B) is adequate for describing the mesoporous silica adsorption
isotherms. The result of this description is reported in Table 4 and in
Fig. 7, where we compare the calculated isotherms with the experi
mental ones and where we also add the individual contributions ΘmL ,
Θ2L , and Θcav . The agreement between calculated and experimental
values is convincing and supported by the residuals. It is remarkable
how well the calculated and the experimental inflection points match.
This applies also for the calculated second inflection point, which is
characteristic for this type of isotherms. We observe that the values for
the cavity filling enthalpy Δcav H∅ are slightly larger than those found for
the cluster formation in Tables 2 and 3. They are significantly smaller
than those measured for monolayer formation as reported in Tables 2
and 4 of ref [29]. The values for the second monolayer formation
Δads H∅
2L , however, underline what is seen in Fig. 7, namely that this
process plays a less important role, which nevertheless influences the
shape of the isotherms, so that it cannot be neglected. The second
monolayer formation for the Ar isotherm of MCM-41 (2.7 nm) is, how
ever, so weak, that the thermodynamic parameters could not be deter
mined reliably and are therefore omitted in Table 4. It is interesting to
observe that the volume adsorbed by cavity filling ΔVcav at prel = 0.9 as
described in eqn (32), which can be derived analogous to eqn (31), is
larger or at least equal to VmL for pore diameters of 4.4 nm and 4.1 nm,
but significantly smaller than VmL for mesoporous silica with a pore
diameter of 2.7 nm. This applies for both Ar and N2 as adsorptive.
∑n
i
0
i=1 i(0.9kcav )
ΔV0.9
(33)
∑
cav = Θcav VmL
n
1 + i=1 (0.9kcav )i
5. Conclusions
The adsorption of simple gases begins with the formation of a
monolayer on the pristine surface, sometimes followed by the formation
of a second or more monolayers. Subsequently, cluster formation on top
of the layer or cavity filling occurs, depending on the properties of the
surface. This means that the adsorption isotherms must be understood as
the signature of several sequential chemical equilibrium steps [48]. The
characteristically different shape of the isotherms related to these pro
cesses allows differentiation. However, it is custom to analyze only
specific pressure ranges of the isotherms quantitatively, usually the re
gion which allows determining the specific surface area, the volume of
adsorptive bound as a monolayer, and the enthalpy of adsorption.
Hence, only part of the information provided by the adsorption iso
therms is extracted. Our aim is to analyze the isotherms quantitatively
10
G. Calzaferri et al.
Microporous and Mesoporous Materials 330 (2022) 111563
Declaration of competing interest
[16]
[17]
[18]
[19]
[20]
[21]
The authors declare that they have no known competing financial
interests or personal relationships that could have appeared to influence
the work reported in this paper.
[22]
[23]
[24]
[25]
[26]
Acknowledgements
This work was supported by the Swiss National Science Foundation
(project 200021_172805).
[27]
Appendix A. Supplementary data
[28]
Supplementary data to this article can be found online at https://doi.
org/10.1016/j.micromeso.2021.111563.
[29]
[30]
[31]
Supplementary data
[32]
Supplementary data to this article has been added.
[33]
[34]
References
[35]
[1] R.M. Barrer, Zeolites and Clay Minerals as Sorbents and Molecular Sieves (Chapter
4), Academic Press, London, 1978, ISBN 0120793504.
[2] W. Rudzinski, D.H. Everett, Adsorption of Gases on Heterogeneous Surfaces,
Academic Press, London, 1992, ISBN 0-12-601690-9.
[3] F. Rouquerol, J. Rouquerol, K. Sing, Adsorption by Powders and Porous Solids,
Academic Press, London, 1999.
[4] M.P.L. Llewellyn, G. Maurin, in: J. Cejka, H. Bekkum, A. Corma, F. Schüth (Eds.),
Introduction to Zeolite Science and Practice, third ed., Elsevier Amsterdam, 2007,
pp. 556–610 (Chapter 17).
[5] T. Horikawa, D.D. Do, D. Nicholson, Adv. Colloid Interface Sci. 169 (2011) 40–58.
[6] M. Thommes, K. Kaneko, A.V. Neimark, J.P. Olivier, F. Rodriguez-Reinoso,
J. Rouquerol, K.S.W. Sing, IUPAC technical report), Pure Appl. Chem. 87 (9–10)
(2015) 1051–1069.
[7] T.C. Brown, D.J. Miron, Ch M. Fellows, Phys. Chem. Chem. Phys. 21 (2019)
2558–2566.
[8] N. Narayanaswamy, C.A. Ward, J. Phys. Chem. C 123 (2019) 18336–18346.
[9] a) A. Sarkar, B. Paul, Microporous Mesoporous Mater. 302 (2020) 110191;
b) L. Wu, J. Liu, H. Shang, S. Li, J. Yang, L. Li, J. Li, Microporous Mesoporous
Mater. 316 (2021) 110956.
[10] I. Langmuir, J. Am. Chem. Soc. 40 (1918) 1361–1403.
[11] H. Swenson, N.P. Stadie, Langmuir 35 (2019) 5409–5426.
[12] A.L. Myers, AlChE J 29 (4) (1983) 691–693.
[13] R.G. Jordi, D.D. Do, J. Chem. Soc. Faraday. Trans. 88 (16) (1992) 2411–2419.
[14] P. M. Mathias, R. Kumar, J. D. Moyer, Jr, J. M. Schork, S. R. Srinivasan, S. R. Auvil,
O. Talu, Ind. Eng. Chem. Res. 351 (996) 2477-2483.
[15] A. Micke, M. Billow, M. Kocirik, P. Struve, J. Phys. Chem. 98 (1994) 12337–12344.
[36]
[37]
[38]
[39]
[40]
[41]
[42]
[43]
[44]
[45]
[46]
[47]
[48]
11
W. Zhu, F. Kapteijn, J.A. Moulijn, Chem. Commun. (1999) 2453–2454.
L. Song, L.V.C. Rees, J. Chem. Soc. Faraday. Trans. 93 (4) (1997) 649–657.
T.J.H. Vlugt, R. Krishna, B. Smit, J. Phys. Chem. B 103 (1999) 1102–1118.
R. Krishna, T.J.H. Vlugt, B. Smit, Chem. Eng. Sci. 54 (1999) 1751–1757.
D. Paschek, R. Krishna, Phys. Chem. Chem. Phys. 2 (2000) 2389–2394.
W. Zhu, F. Kapteijn, J.A. Moulijn, M.C. den Exter, J.C. Jansen, Langmuir 16 (2000)
3322–3329.
J.A. Ritter, S.J. Bhadra, A.D. Ebner, Langmuir 27 (2011) 4700–4712.
S. Keskin, J. Liu, J.K. Johnson, D.S. Sholl, Langmuir 24 (2008) 8254–8261.
S. García, J.J. Pis, F. Rubiera, C. Pevida, Langmuir 29 (2013) 6042–6052.
S.J. Bhadra, A.D. Ebner, J.A. Ritter, Langmuir 28 (2012) 6935–6941.
K. Liu, B. Li, Y. Li, X. Li, F. Yang, G. Zeng, Y. Peng, Z. Zhang, G. Li, Z. Shi, S. Feng,
D. Song, Chem. Commun. 50 (2014) 5031–5033.
A. Farzaneh, M. Zhou, E. Potapova, Z. Bacsik, L. Ohlin, A. Holmgren, J. Hedlund,
M. Grahn, Langmuir 31 (2015) 4887–4894.
a) G. Calzaferri, Phys. Chem. Chem. Phys. 20 (2018) 29070–29084;
b) G. Calzaferri, Phys. Chem. Chem. Phys. 19 (2017) 10611–10621.
G. Calzaferri, S.H. Gallagher, D. Brỹhwiler, Microporous Mesoporous Mater. 312
(2021) 110744.
W. Stă
ober, A. Fink, E. Bohn, J. Colloid Interface Sci. 26 (1968) 62–69.
a) Ch Baerlocher, W.M. Meier, D.H. Olson, in: Atlas of Zeolite Framework Types,
fifth ed., Elsevier, Amsterdam, 2001;
(b) International zeolite association. />G. Calzaferri, Structure and Bonding, Springer, Berlin, 2020. />10.1007/430_2020_57.
D. Brühwiler, H. Frei, J. Phys. Chem. B 107 (2003) 8547–8556.
J.A.S. Costa, R.A. de Jesus, D.O. Santos, J.F. Mano, L.P.C. Rom˜
aod, C.M. Paranhos,
Microporous Mesoporous Mater. 291 (2020) 109698.
Cavity filling is often referred to as capillary condensation, however, we prefer
using the more specific term “cavity filling” within the present context.
P. Woodtli, S. Giger, P. Mỹller, L. Să
agesser, N. Zucchetto, M.J. Reber, A. Ecker,
D. Brühwiler, Dyes Pigments 149 (2018) 456–461.
D.W. Marquardt, J. Soc. Ind. Appl. Math. 11 (1963) 431–441.
The Levenberg-Marquardt Method Implemented in Mathcad 14, Mathsoft Eng. &
Edu., Inc. ().
I.M. Klotz, Acc. Chem. Res. 7 (1974) 162–168.
a) C. Buttersack, Phys. Chem. Chem. Phys. 21 (2019) 5614–5626;
b) C. Buttersack, Microporous Mesoporous Mater. 316 (2021) 110909.
I. Prigogine, in: Thermodynamics of Irreversible Processes, third ed., Wiley & Sons,
Hoboken, NJ, USA, 1967.
Th Dubler, C. Maissen, G. Calzaferri, Z. Naturforsch. 31b (1976) 569–579.
G. Calzaferri, Sciforum Electronic Conf. Ser., ECEA 2017. Proceedings, 2, 2018,
pp. 1–9, 168.
It is trivial that eqn (26) reduces formally to Langmuir’s equation for n=1. This
should, however, not be understood as a derivation of the Langmuir isotherm
equation; see ref [28].
A.J.P. Carvalho, T. Ferreira, A.J.E. Candeiasa, J.P.P. Ramalho, THEOCHEM 729
(2005) 65–69.
S. Li, Q. Wan, Z. Qin, Y. Fu, Y. Gu, Langmuir 31 (2015) 824–832.
P.W. Atkins, J. de Paula, Physikalische Chemie, 4, Wiley-VCH Weinheim, Auflage,
2006, ISBN 3-527-31546-2.
Chemical equilibrium language is Thermodynamic and therefore independent of
the kind of interaction, whether this Is called physisorption or chemisorption.