Mass transport of CO2 over CH4 controlled by the selective surface barrier in ultra-thin CHA membranes
Bạn đang xem bản rút gọn của tài liệu. Xem và tải ngay bản đầy đủ của tài liệu tại đây (8.88 MB, 13 trang )
Microporous and Mesoporous Materials 332 (2022) 111716
Contents lists available at ScienceDirect
Microporous and Mesoporous Materials
journal homepage: www.elsevier.com/locate/micromeso
Mass transport of CO2 over CH4 controlled by the selective surface barrier
in ultra-thin CHA membranes
Mojtaba Sinaei Nobandegani *, Liang Yu , Jonas Hedlund
Chemical Technology, Luleå University of Technology, SE-971 87, Luleå, Sweden
A R T I C L E I N F O
A B S T R A C T
Keywords:
Adsorption
Mass transport
Surface barrier
Surface diffusion
Activation energy
The adsorption and mass transport of CO2 and CH4 in CHA zeolite were studied experimentally. First, large and
well-defined CHA crystals with varying Si/Al ratios and morphologies ideal for adsorption studies were prepared.
Then, adsorption isotherms were measured, and adsorption parameters were estimated from the data. In the next
step, permeation experiments for pure components and mixtures were conducted for a defect-free CHA mem
brane with a Si/Al ratio of 80 and a thickness of 600 nm over a wide temperature range. A maximum selectivity
of 243 in combination with a CO2 permeance of 70 × 10− 7 mol/(m2 s Pa) was observed for a feed of an equimolar
CO2/CH4 mixture at 273 K and 5.5 bar. Finally, a simple model accounting for adsorption and diffusion through
the surface barriers and the interior of the pores of the membrane was fitted to the permeation data. The fitted
model indicated that the surface barrier was a surface diffusion process at the pore mouth with higher activation
energy than the diffusion process within the pores. The model also showed that the highly selective mass
transport in the membrane was mostly a result of a selective surface barrier and, to a lesser extent, a result of
adsorption selectivity.
1. Introduction
Natural gas and biogas are mainly composed of a mixture of methane
and carbon dioxide [1–3], and the removal of CO2 is usually required to
satisfy grid and fuel specifications. Water scrubbing, pressure swing
adsorption (PSA), amine sorption, cryogenic separation, and membrane
techniques [4–13] have been employed to remove CO2 from CH4.
However, the existing technologies have some drawbacks such as low
selectivity, complexity, high energy consumption, and high cost [14].
Due to their high efficiency, low energy demand, compact equipment,
and straightforward operation, membrane-based techniques have been
studied intensively [11,15] and polymeric membranes have been used
for gas separation on a large scale. However, polymeric membranes
display relatively poor selectivity, permeability, and stability, which
makes them disadvantageous and less applicable. For instance, for cel
lulose acetate membranes that are used on a large scale for CO2/CH4
separation, a CO2 permeance of approximately 0.6 × 10− 7 mol/(m2 s Pa)
in combination with a CO2/CH4 ideal selectivity of 35 has been observed
in the laboratory [16]. For commercial polymeric membranes, the CO2
permeance is even lower; for example, polyetherimide (Ultem® 1000)
has an indicated CO2 permeance of 0.09 × 10− 7 mol/(m2 s Pa) coupled
with a CO2/CH4 selectivity of 40 [17]. Zeolites are ceramic materials
with well-defined pores and much higher chemical and thermal stabil
ities than polymeric materials and have been used as adsorbents for
industrial gas upgrading [18–20]. Ceramic zeolite membranes have the
potential to display a higher selectivity, permeability, and stability than
polymeric membranes for gas separations; however, zeolite membranes
have not yet been commercialized for gas separations. Consequently,
much research and development work has been devoted to zeolite
membranes during the past decades [21].
The pore system of CHA zeolite has a window size of 3.7 × 3.7 Å.
Because this window size is in between the kinetic diameters of CO2 (3.3
Å) and CH4 (3.8 Å), CHA zeolite can separate CO2/CH4 mixtures by
molecular sieving [22–29]. The CHA membranes with different chemi
cal compositions and Si/Al ratios but the same CHA pore system have
been reported for CO2/CH4 separation. “Pure silica” (implying an
infinite Si/Al ratio) CHA membranes [30] and “high silica” (implying a
finite Si/Al ratio) membranes [25,31,32] have also been reported. These
“pure silica” and “high silica” CHA membranes are alternatively denoted
as SSZ-13 membranes. There are also reports on SAPO-34 membranes
[33,34], in which the CHA framework comprises phosphate in addition
to silica and alumina.
* Corresponding author.
E-mail address: (M.S. Nobandegani).
/>Received 30 October 2021; Received in revised form 30 December 2021; Accepted 20 January 2022
Available online 29 January 2022
1387-1811/© 2022 The Authors.
Published by Elsevier Inc.
This is an open
( />
access
article
under
the
CC
BY-NC-ND
license
M.S. Nobandegani et al.
Microporous and Mesoporous Materials 332 (2022) 111716
In previous studies [35,36], we have prepared and evaluated CHA
membranes for the separation of CO2/CH4 mixtures. A high CO2/CH4
separation factor of 99 in combination with a high CO2 permeance of 60
× 10− 7 mol/(m2 s Pa) was observed for a feed of an equimolar CO2/CH4
mixture at room temperature. A high separation factor in combination
with high permeance is a desirable membrane property. The observed
CO2 permeance was approximately 2–20 times higher than that reported
for CHA membranes in the literature [25,37,38]. This high permeance
was attributed to the very thin CHA film (approximately 450 nm) sup
ported on a highly permeable support. Furthermore, the CO2 permeance
was about 100 times higher than that typically observed for polymeric
membranes, e.g., cellulose acetate membranes in the laboratory [16],
and more than 600 times larger than the indicated permeance for
commercial polyetherimide (Ultem® 1000) membranes [17]. Conse
quently, these highly permeable CHA membranes are promising for in
dustrial applications, but the fundamental mass transfer process in thin
membranes has hitherto been poorly understood. A fundamental un
derstanding of the mass transfer process is essential for the development
of tools for engineering and, in the next step, to enable the design of
industrial CO2/CH4 separation processes.
Adsorption, surface diffusion, and desorption are the main mass
transfer steps in nanoporous materials. In sufficiently large crystals, the
surface diffusion step must be rate-limiting. Krishna et al. modeled the
mass transport of molecules through zeolite membranes with a thickness
of 50 μm using the Maxwell–Stefan equations to describe the surface
diffusion process in the pores [39,40]. Similar work has also been re
ported by Kapteijn et al. for silicalite-1 membranes having a thickness of
20–60 μm [41–44]. Surface barriers may influence the mass transfer as
first described by Bülow et al. [45], and in small crystals and thin
membranes, the mass transfer may even be limited by the surface barrier
[46–48]. The effect of surface barriers on the molecular mass transport
ărger and Bỹlows groups using various
in zeolites has been studied by Ka
experimental methods such as micro-imaging, NMR tracer desorption,
frequency response (FR), and barometric (or piezometric) techniques
[49–54]. However, the origin of the surface barrier has been unknown
[51], although pore narrowing and pore blockage have been suggested
as possible reasons for the barrier [55]. We have studied the surface
barrier in ultra-thin MFI and CHA membranes by careful permeation
experiments over a wide temperature range [56]. The results indicated
that the surface barrier was the rate-limiting mass transfer step and that
it was a surface diffusion process with higher activation energy than that
for the surface diffusion process within the pores. It appeared that the
activation energy was higher because there were fewer molecular in
teractions at the pore mouth than within the pores themselves. The pore
mouth was in direct contact with the gas phase where the concentration
of molecules was very low compared to the concentration in the pores.
Consequently, the origin of the surface barrier may be due to the dif
ference in geometries between the pore mouth and the pore interior.
In our previous work [56], the adsorption parameters were taken
from the literature. However, the chemical properties of the zeolite, such
as the Si/Al ratio and the concentration of silanol groups, affect the
adsorption parameters. In addition, most of the reported adsorption data
has been determined in a narrow temperature range [27,57–59].
Determination of the parameters in a temperature range similar to the
membrane experiments may serve to avoid systematic errors caused by
taking the two measurements at different temperatures. Thus, the
determination of adsorption parameters for a zeolite with the same
chemical properties as the zeolite in the membrane as well as the use of
similar temperature ranges for the adsorption and membrane experi
ments are essential to accurately determine the surface permeability and
the corresponding activation energy. Experimental studies of both
adsorption and permeation over CHA zeolites are rare, however, due to
the more extensive experimental work that they require.
In the present work, the adsorption isotherms of CO2 and CH4 were
measured for CHA crystals with Si/Al ratios of 45, 77, and ∞ over a wide
temperature range of 150–350 K; the adsorption parameters were
determined from the isotherms. In the next step, permeation experi
ments for the same components in their pure forms and as mixtures were
conducted for an ultra-thin CHA membrane with a Si/Al ratio of 80. The
crystals and membrane were synthesized in fluoride media, which has
been shown to eliminate silanol groups (i.e., the concentration of silanol
groups should be very low or even zero in both the crystals and the
membrane) [60,61]. Furthermore, the synthesis of the crystals was
optimized to produce large and well-defined crystals with morphologies
that were optimal for adsorption studies (e.g., a low external area/
internal area ratio). Finally, a simple mathematical model [56] ac
counting for adsorption and surface diffusion through the two surface
barriers and the pores of the membrane was fitted to more extensive
permeation data for the CHA membrane than in previous work [56]. The
permeation experiments were conducted over a wider temperature
range than the CO2 adsorption experiments, i.e. from 210 to 450 K. This
also allowed a more precise estimation of the surface permeability and
the corresponding activation energy. In addition, the permeance selec
tivity (usually denoted as permselectivity), adsorption selectivity, and
surface permeability selectivity were evaluated, which led to a deeper
understanding of the selective mass transfer processes.
2. Material and methods
2.1. Synthesis of CHA crystals
To synthesize relatively large pure silica CHA crystals in fluoride
media [35], distilled water, colloidal silica (40%, Ludox AS-40), N,N,
N-trimethyl-1-adamantyl ammonium hydroxide (TMAdaOH 25%,
SACHEM, Inc.), and hydrofluoric acid (48%) were mixed in a plastic
bottle and stirred overnight at room temperature. The mixture was then
freeze-dried, and a small amount of water was added to obtain a gel with
a molar composition of 1.0 SiO2:1.4 TMAdaF:9.4H2O. The gel was
placed in an autoclave that was kept in an oven at 175 ◦ C for 1 day. The
crystals were purified by repeated centrifugation and re-dispersion in a
0.1 M NH3 solution a total of 6 times. This sample will be furthermore
denoted as Si-CHA. Two additional CHA samples with Si/Al ratios of 45
and 77 were synthesized using a similar procedure; these samples will be
furthermore denoted as CHA45 and CHA77, respectively. These samples
were prepared by adding aluminum isopropoxide (99.99%,
Sigma-Aldrich) to the synthesis gel, followed by stirring for 15 min
before freeze-drying. The compositions of the synthesis mixtures used to
prepare CHA45 and CHA77 were 1.0 SiO2:0.01 Al2O3:1.4 TMA
daF:9.4H2O and 1.0 SiO2:0.005 Al2O3:1.4 TMAdaF:9.4H2O, respec
tively. Finally, the crystals were calcined at 480 ◦ C in ambient air for 16
h to remove the template molecules from the pores.
2.2. CHA membranes
CHA membranes supported on graded α-alumina discs with a
diameter of 25 mm were provided by ZeoMem Sweden AB. The thick
ness of the top layer of the support was about 35 μm with a pore size of
approximately 100 nm, and the thickness of the base layer was 3 mm
with a pore size of about 3 μm.
2.3. Characterization
Scanning electron microscope (SEM) images of the samples were
recorded by using an extreme-high-resolution SEM (XHR-SEM)
(Magellan 400, FEI Company, Eindhoven, The Netherlands). The in
strument was operated using an accelerating voltage of 3 kV and a probe
current of 6.3 pA. No conductive coating was applied to the samples
prior to imaging. A PANalytical Empyrean X-ray diffractometer equip
ped with a Cu LFF HR X-ray tube and a PIXcel3D detector was employed
to record XRD patterns of the zeolite crystals and the membrane in the
2θ range of 5◦ –35◦ . The accelerating voltage and current were 45 kV and
40 mA, respectively. The Si/Al ratios of the CHA crystals were measured
2
M.S. Nobandegani et al.
Microporous and Mesoporous Materials 332 (2022) 111716
by inductively coupled plasma-sector field mass spectroscopy (ICPSFMS, ALS Analytica). The samples were prepared by digesting 0.1 g
zeolite powder in LiBO2 followed by dissolving in HNO3. Loss on ignition
was estimated by heating the sample to 1000 ◦ C.
2.5. Modeling
2.5.1. Gas adsorption
To consider the heterogeneity of the adsorbate, Toth adsorption
isotherms were fitted to the measured adsorption data [63]:
2.4. Adsorption and permeation experiments
C = Csat
A Micromeritics ASAP 2020 Plus instrument equipped with a
Micromeritics Cryostat I was used to measure the adsorption isotherms
of CO2 (99.995%) and CH4 (99.9995%) at pressures up to 125 kPa. The
CO2 and CH4 isotherms were measured over the temperature range of
230–350 K and 150–300 K, respectively. A lower temperature range was
selected for CH4 to arrive at sufficient adsorption. The samples were
degassed under vacuum conditions at 350 ◦ C for 12 h before measure
ment. The equilibrium time for CO2 and CH4 was 40 and 630 s,
respectively. To evaluate membrane quality, the permeance of H2 and
SF6 was measured at a feed pressure of 2 bar(a) and a permeate pressure
of 1 bar(a) at room temperature. Since H2 molecules are small enough to
permeate the CHA pores while SF6 molecules can only permeate defects,
a high H2/SF6 permeance ratio indicates a high membrane quality.
The membrane was mounted in a stainless steel cell and sealed with
graphite gaskets for permeation measurements over a wide temperature
range using equipment that has been detailed in previous work [62]. The
membrane was dried at 573 K for 6 h in a flow of dry He, and then the
permeation experiments with pure CO2 and CH4 were conducted in the
temperature ranges of 220–450 K and 210–450 K, respectively. The
membrane experiments were carried out in a slightly wider temperature
range than the temperature range for the CO2 adsorption measurements
in order to more accurately determine the activation energy for surface
permeability. The pure components were fed to the membrane through a
mass flow controller, and the pressure on the feed side of the membrane
was controlled by a backpressure regulator set to 1.5 or 2 bar(a). The
pressure on the permeate side was maintained at 1 bar(a). The permeate
flow was measured by a bubble flowmeter. Finally, permeation experi
ments for the feeds comprised of the CO2/CH4 mixtures with molar ra
tios of 50/50 and 80/20 were carried out at feed pressures of 3 and 6 bar
(a) and a permeate pressure of 1 bar(a). A drum-type flowmeter was
used to measure the permeate flow rate, and the composition of the
permeate was analyzed using an online GC (Micro GC 490, Agilent).
bP
/
1
[
t] t
1 + (bP)
(1)
In this equation, C represents the adsorbed concentration and Csat
represents the adsorbed concentration at saturation. The parameter b is
the affinity constant, t is the Toth heterogeneity parameter, and P is the
pressure. The parameter Csat was estimated by fitting the isotherm to the
adsorption data recorded at the lowest temperature, while the param
eters b and t were fitted at all temperatures. The heat of adsorption
(ΔHads.) for the three samples with varying Si/Al ratios was estimated by
fitting the van’t Hoff equation to the experimental data:
ln b =
− ΔHads. ΔSads.
+
RT
R
(2)
where ΔSads. is the adsorption entropy, which was assumed to be con
stant for all three samples.
2.5.2. Gas permeation
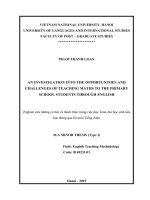
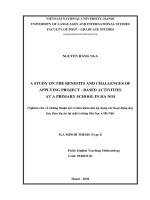
Fig. 1 illustrates the mass transfer process in the zeolite membrane at
steady conditions, and for component i, the flux through the zeolite film
Jfi can be described as [56]:
Jfi =
α
i i
fD
( f
)
αif αip Di
p
C − Ceq,i
ε
+ αif αip L + αip Di eq,i
(3)
where αif and αip are the surface permeabilities of i at the surface barrier
at the feed side f and permeate side p of the zeolite film, respectively. Di
is the diffusion coefficient of i in the zeolite pores, ε is the fractional pore
f
volume (0.382 for CHA [40]), and L is the zeolite film thickness. Ceq,i and
Cpeq,i
are the concentrations of i in the zeolite pores at the feed and
permeate sides, respectively. As shown in previous work [56], the mass
transfer process in these thin membranes is controlled by the surface
barrier and not by the diffusion process inside the pores. Adsorption
equilibrium was assumed at the feed and permeate sides of the zeolite
film, and consequently, the concentrations in the zeolite pores at the
f
feed (Ceq,i ) and permeate (Cpeq,i ) sides were estimated from the
f
Fig. 1. Schematic of the mass transfer process through a zeolite membrane. Ceq denotes the concentration within the pores in equilibrium with the feed gas with
(partial) pressure
f
pg ,
f
Cb
is the concentration at the other side of the barrier,
Cpb
is the concentration within the pores before the barrier at the permeate side, and Cpeq is
the concentration after the barrier within the pores in equilibrium with the gas with (partial) pressure ppg at the permeate side of the membrane.
3
M.S. Nobandegani et al.
Microporous and Mesoporous Materials 332 (2022) 111716
f
corresponding pressures (pg and ppg ) using Equations (1) and (2) with the
fitted adsorption parameters.
The surface permeability is a function of the concentration and
temperature as follows [56]:
α=(
1−
α*
C
Csat
( (
))
E
1
1
)n exp α
−
R 300 T
(4)
In Equation (4), Eα is the activation energy for surface permeability,
α* is the surface permeability at 300 K and zero concentration, and the
parameter n is equal to 1.2 [56]. The diffusion coefficient D is considered
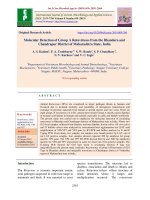
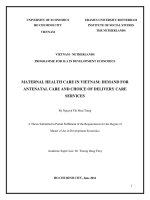
Fig. 2. SEM images of CHA crystals and a membrane: a) Si-CHA, b) CHA77, c) CHA45, d) Cross-sectional view of a CHA membrane, e) High resolution image of the
cross-section rotatated 90◦ anti-clockwise as compared to the image in d), and f) Top-view of a CHA membrane.
4
M.S. Nobandegani et al.
Microporous and Mesoporous Materials 332 (2022) 111716
to be a function of temperature and is independent of loading [64]:
D = A2 e
for pure components and as “mixture” when estimated for mixtures.
(5)
− EDiffusion
/RT
3. Results and discussion
EDiffusion is the activation energy for diffusion in the zeolite pores.
The flux through the support Js was considered to be a combination
of Poiseuille flow and Knudsen diffusion [56]:
(
√̅̅̅̅̅ )
B0 P 194K0 T
dP
Js =
(6)
+
M
dx
μRT
RT
3.1. General characterization of CHA crystals and membrane
The Si/Al ratios of the CHA45 and CHA77 crystals were determined
by ICP-SFMS to be 45 and 77, respectively. The Si/Al ratio of a CHA
membrane was estimated to be 80 by first performing an ion exchange of
the membrane to the Cs+ form and then measuring the Cs signal by EDS
analysis, as described in previous work [66,67].
Fig. 2 shows SEM images of the crystals and CHA membrane. The
CHA crystals displayed the typical pseudo-cubic habit [28,35]. No
crystals with other morphologies or any amorphous materials were
observed by the SEM. The width of the crystals was approximately 10
μm with a narrow size distribution for the three samples (Fig. 2a–c).
Consequently, the ratio of the external-to-internal surface areas of these
large crystals was as small as 1/1000 (i.e., the adsorption data reflected
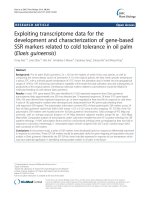
only the internal surface of the crystals). Fig. 3a shows the XRD patterns
recorded for the CHA crystals (black traces). All observed reflections are
typical for the CHA phase, as indicated by the reference pattern
(ICDD-00-052-0784) for CHA crystals (blue bars). No signal from
amorphous material was observed.
Fig. 2d and e shows SEM images of the cross-section of a CHA
membrane. A continuous film with a thickness of around 600 nm
(Fig. 2d) was observed. In addition, the pores of the support were
completely open, which indicated that the support was highly perme
able (Fig. 2d). Furthermore, this demonstrated that the mass transfer in
the support could be described using Equation (6) with parameters fitted
to the permeation data for the support (without zeolite). Fig. 2e shows a
high-resolution image of the cross-section of the film, which is rotated
90◦ anticlockwise compared to Fig. 2d. The high-resolution image of the
cross-section (Fig. 2e) shows that the grain boundaries within the film
were closed. The SEM image of the membrane surface (Fig. 2f) dem
onstrates that the film was comprised of well inter-grown zeolite crys
tals, and no cracks or pinholes were present. The XRD pattern of the CHA
membrane (black trace in Fig. 3b) only displayed reflections from the
CHA and alumina phases, which confirmed the high purity of the CHA
membrane.
where B0 (1.90 × 10− 16 m2) is the Poiseuille structural parameter, K0
(2.40 × 10− 9 m) is the Knudsen structural parameter, M is the molar
mass (g/mol), μ is the viscosity (N⋅s/m2), and x is the thickness (35 μm)
of the top layer of the support, which is where the main mass transfer
resistance in the support is generated.
The Sutherland model was used to estimate the viscosity [65]:
T
Tref
)32
/
(
μ = μref
Tref + S
T +S
(7)
In this model, S is the Sutherland constant equal to 275 and 179 K for
CO2 and CH4, respectively. The parameter μref is the viscosity of the gas
at the reference temperature Tref of 273 K, which is 1.37 × 10− 5 and
1.03 × 10− 5 (N s)/m2 for CO2 and CH4, respectively.
The adsorption selectivity, permeance selectivity, surface perme
ability selectivity, and driving force were estimated according to
Equations (8)–(11):
AdsorptionSelectivity =
PermeanceSelectivity =
θfCO2
(8)
θfCH4
πfCO2
πfCH4
SurfacePermeabilitySelectivity =
(9)
αfCO2
αfCH4
(11)
Drivingforce = θf − θp
Here, θ is the loading (θ =
Ji
f
p ),
pi − pi
(10)
Ceq
)
Csat
and π represents the permeance (π i =
where Ji and pi are the flux and partial pressure, respectively, of
3.2. Gas adsorption
component i. These selectivities are denoted as “ideal” when estimated
The points in Fig. 4 represent the measured adsorption isotherms of
Fig. 3. XRD patterns of the as-synthesized: a) CHA crystals and b) CHA membrane (black trace). Blue bars represent reflections from the reference database and the
red bar represents the reflection from the α-alumina support. (For interpretation of the references to colour in this figure legend, the reader is referred to the Web
version of this article.)
5
M.S. Nobandegani et al.
Microporous and Mesoporous Materials 332 (2022) 111716
Fig. 4. Adsorption isotherms of single components over CHA crystals. Measured data are shown by points and curves represent the fitted model.
6
M.S. Nobandegani et al.
Microporous and Mesoporous Materials 332 (2022) 111716
CO2 and CH4 for the CHA crystals. The adsorption measurements were
repeated and almost the same results were obtained, see Fig. S1a. All the
isotherms appeared to be of type I [68], which is typical for microporous
materials, although saturation was not reached even at the lowest
investigated temperatures. The observed CO2/CH4 ideal adsorption
selectivity was around 4.3 at 298 K and 100 kPa for Si-CHA, which is
comparable with the reported adsorption selectivity of 4.06 at 298 K and
100 kPa [29].
Fig. 4 also shows that the Toth adsorption isotherms (curves) are
fitted well to the adsorption data; the R-squared values (>0.99) are
summarized in Table S1. Single site Langmuir isotherms were also fitted
to the adsorption data, but the fit was not as good, particularly for CH4 at
low temperatures, as illustrated by much lower R-squared values, see
Table S1. Fig. S2 shows Toth and Langmuir isotherms fitted to CO2
adsorption data over Si-CHA crystals. It shows that a Langmuir isotherm
cannot be fitted well to the data recorded at the lowest temperature, and
that the Toth isotherm can be fitted well to data recorded at all tem
peratures. To determine the adsorption capacities at saturation, the Toth
adsorption isotherms were fitted to the adsorption data recorded at the
lowest temperatures, e.g., 230 and 150 K for CO2 and CH4, respectively.
The parameters b and t were then estimated by fitting the Toth
adsorption isotherms to the data recorded at all temperatures. Finally,
the parameters ΔHads. and ΔSads. were estimated from the fitted b-values
by fitting the van’t Hoff equation (Equation (2)) to the data. As illus
trated by the van’t Hoff plots in Fig. S3, the fit was excellent (R2 > 0.99).
The fitted parameters are presented in Tables 1 and 2 and discussed
below.
The fitted adsorbed concentration at saturation was 35.0 and 30.0
kmol/m3 for CO2 and CH4, respectively. These values are quite similar to
those estimated by configurational-bias Monte Carlo (CBMC) simulation
and reported by Krishna et al. (34.98 and 30.61 kmol/m3 for CO2 and
CH4, respectively) [40]. A higher CO2 adsorption capacity is mainly be
an effect of the smaller size of the CO2 molecule compared to the CH4
molecule. As shown in Tables 1 and 2, the same adsorbed concentration
at saturation was observed for all samples independent of the Si/Al ratio.
This can be rationalized by the facts that only a small amount of
aluminum was introduced in the samples CHA77 and CHA45, and that
protons are the counterions, which should result in a minor influence of
the pore volume accessible for pore filling by the adsorbates.
The estimated b-values at 300 K for Si-CHA of 2.9 × 10− 6 and 5.25 ×
10− 7/Pa for CO2 and CH4, respectively, are also quite similar to those
reported by Krishna et al. (1.7 × 10− 6 and 6.1 × 10− 7/Pa for CO2 and
CH4, respectively) [40]. The higher b-value for CO2 should be an effect
of the larger polarizability of CO2 compared to that of CH4 [69]. Higher
b-values were observed for samples with lower Si/Al ratios. For CO2, this
should be an effect of the increased basicity and polarity of the frame
work [70,71], and for CH4, this should be an effect of the increased
polarity [72,73] caused by the introduction of Al in the zeolite.
The fitted Toth heterogeneity parameter (t) deviated further from
unity by decreasing the Si/Al ratio. This indicated that the adsorption
sites became more heterogeneous when more Al was introduced in the
zeolite, as observed for other zeolites [74–77]. The fitted heterogeneity
parameter was also lower for CH4 than for CO2, which indicated that the
adsorption sites for CH4 are more heterogeneous than those for CO2.
The heats of adsorption ΔHads. for CO2 and CH4 were estimated
within the ranges of − 26.75 to − 25.82 kJ/mol and − 17.76 to − 17.23
kJ/mol, respectively, which are close to the values reported by other
groups [27,40,78]. A more negative heat of adsorption is expected for
adsorption systems with larger polarities [47,79], which is in concert
with the observed heat of adsorption for CO2.
Fig. 5 shows plots of -ΔHads. (Fig. 5a), b-values (Fig. 5b), and t
(Fig. 5c) as a function of the Al/Si ratio, i.e., the inverse of the more
common Si/Al ratio. More details can be found in Fig. S4. It is evident
that the parameters -ΔHads. and b are increasing nearly linearly with the
Al/Si ratio, while the parameter t is decreasing nearly linearly with the
Al/Si ratio, as shown by the fitted lines. The values of -ΔHads., b, and t for
the membrane with an Al/Si ratio of 1/80 were estimated from these
linear dependencies, and the estimated values are given in Tables 1 and
2 These estimated values differ only slightly from the literature data that
we used in previous work [56].
3.3. Single-component permeation experiments
The permeances of pure H2 and SF6 over the membrane were
measured to be 52 × 10− 7 and 7 × 10− 11 mol/(m2 s Pa), respectively.
The H2/SF6 permeance ratio was as high as 75,000, which was indica
tive of a high membrane quality [25,30] and shows permeation data
should reflect only mass transfer in the pores of the zeolite, and not in
the defects. This ratio is much higher than the ratios previously reported
for CHA membranes [25,30], which were in the range of 200–600.
In the next step, single-component permeation experiments with CO2
and CH4 at feed pressures of 1.5 and 2 bar(a) were carried out at various
temperatures. The maximum CO2 fluxes were observed at 280 K and
were 0.42 and 0.88 mol/(m2⋅s) for feed pressures of 1.5 and 2 bar(a),
respectively (Fig. 6a). Comparable results were obtained from repeating
the permeation measurement, e.g. Fig. S1b shows the results for CH4
permeation at 2 bar(a) feed pressure. The corresponding CO2 per
meances were as high as 82 × 10− 7 and 86 × 10− 7 mol/(m2 s Pa), which
is similar to the permeance of 78 × 10− 7 mol/(m2 ⋅ s ⋅ Pa) that we have
reported for an ultra-thin MFI membrane [80] and significantly higher
than the permeance reported by Falconer et al. for SSZ-13 membranes
[23]. High CO2 permeance must have been a result of the low membrane
thickness of 600 nm in combination with a highly permeable and open
support as observed by the SEM. At the same temperature, considerably
lower CH4 fluxes of 2.6 × 10− 3 and 5.8 × 10− 3 mol/(m2⋅s) were
observed, which corresponded to low CH4 permeances of 0.51 × 10− 7
and 0.57 × 10− 7 mol/(m2 s Pa) at feed pressures of 1.5 and 2 bar(a),
respectively. Consequently, a high maximum ideal CO2/CH4 permeance
selectivity of 160 was observed (see Fig. 6b). This selectivity is much
higher than the reported selectivities of 54 [30] and 76 [35] at com
parable test conditions and membrane types.
Based on the parameters estimated from the adsorption data (see
Tables 1 and 2), Equation (3) was fitted to the data. Since the mass
transfer process is controlled by the surface barrier in thin membranes
[56], the experimental data could not be used to determine the diffusion
coefficient; thus, diffusion coefficients (Di) were taken from the litera
ture (2.5 × 10− 9 and 5 × 10− 11 m2/s at 300 K for CO2 and CH4,
respectively [40]). These diffusion coefficients were assumed to be in
dependent of loading, while the surface permeability at zero concen
tration (α*), the activation energy of the surface permeability (Eα), and
Table 1
Fitted parameters for CO2 adsorption in CHA.
Sample
ΔHads. (kJ/mol)
Si-CHA
CHA77
CHA45
Membrane (Si/Al = 80)
−
−
−
−
25.82
26.29
26.75
26.32
ΔSads. (J/mol)
−
−
−
−
132.7
132.7
132.7
132.7
b (at 300 K)
(/Pa)
2.94 ×
3.86 ×
4.28 ×
3.74 ×
10−
10−
10−
10−
7
6
6
6
6
t (at 300 K)
Csat. (kmol/m3)
0.9367
0.9201
0.8952
0.9159
35.0
35.0
35.0
35.0
Ref ΔHads. (kJ/mol)
[40]
− 25.0
[27]
− 23.1
[78]
− 23.2
M.S. Nobandegani et al.
Microporous and Mesoporous Materials 332 (2022) 111716
Table 2
Fitted parameters for CH4 adsorption in CHA.
Sample
ΔHads. (kJ/mol)
Si-CHA
CHA77
CHA45
Membrane (Si/Al = 80)
−
−
−
−
17.23
17.46
17.76
17.50
ΔSads. (J/mol)
−
−
−
−
117.9
117.9
117.9
117.9
b (at 300 K)
(/Pa)
5.25 × 10−
5.93 × 10−
6.52 × 10−
5.94 × 10−
7
7
7
7
t (at 300 K)
Csat. (kmol/m3)
0.8387
0.8012
0.8006
0.8121
30.0
30.0
30.0
30.0
Ref ΔHads. (kJ/mol)
[40]
− 16.0
[27]
− 16.8
Fig. 5. a) -ΔHads, b) b-values, and c) t-values as a function of the Al/Si ratio. Circular red-filled and empty blue symbols indicate the measured values for CO2 and CH4
adsorption for the crystals, respectively. Lines are fitted to the data by linear regression and the stars indicate the estimated values for the membrane. (For inter
pretation of the references to colour in this figure legend, the reader is referred to the Web version of this article.)
diffusion in the pores (EDiffusion) were fitted to the experimental data. As
shown by Teixeira et al. [81], the activation energy for diffusion EDiffusion
can be correctly estimated from experimental data independent of
crystal size. Consequently, the activation energy for diffusion was esti
mated from the experimental data in the present work, which has also
been demonstrated in previous work [56]. The fitted parameters are
summarized in Table 3, and the agreement between the fitted model and
the experimental data is illustrated in Fig. 6a.
A surface permeability at zero concentration (α*) of 2.0 × 10− 5 m/s
was observed for CH4, which is 40 times lower than that of CO2, which
was 8.0 × 10− 4 m/s. This is presumed to be the main reason for the
highly selective mass transfer of CO2 across the membrane. For a deeper
analysis of this selective mass transfer, the ideal surface permeability
selectivity is plotted in Fig. 6b. This selectivity was 25 at 450 K and
increased to 1500 at 220 K. As shown in Fig. 6b, the ideal surface
permeability selectivity was always much higher than the ideal
adsorption selectivity, and the difference was particularly large at low
temperatures. The highly selective mass transfer through the membrane
was mostly an effect of the selective surface barrier, i.e., a high ideal
surface permeability selectivity. The high surface permeability selec
tivity at low temperatures was largely due to the high adsorbed con
centration of CO2 at low temperatures, which resulted in a small
denominator in Equation (4) and thereby a large surface permeability
f
for CO2. For instance, at 230 K and a feed pressure of 2 bar(a), CCO2 was
33.1 kmol/m3, which is close to the Csat. of CO2 (35 kmol/m3). This
produced a denominator value in Equation (4) of 0.03 and an αCO2 of 5.8
× 10− 3 m/s. Under the same conditions, CCH4 was 14.8 kmol/m3, which
is less than half of the Csat. of CH4 (30 kmol/m3). This resulted in a
f
8
M.S. Nobandegani et al.
Microporous and Mesoporous Materials 332 (2022) 111716
Fig. 6. a) Single-component CO2 and CH4 fluxes and b) Ideal CO2/CH4 permeance selectivity, ideal surface permeability selectivity, ideal adsorption selectivity, and
driving force. Filled symbols and lines show the experimental data and model, respectively, for a feed pressure of 2 bar(a), while empty symbols and dashed lines
show the experimental data and model, respectively, for a feed pressure of 1.5 bar(a). The permeate pressure is 1 bar(a) in all cases.
Fig. 6b also shows the driving force for the mass transfer across the
membrane expressed as the loading difference θf − θp , which is a func
tion of the temperature and corresponds to the concentration difference
Table 3
Fitted parameters in Equation (3).
Single Component
CH4
α* at 300 K (m/s)
E300K
(kJ/mol)
α
E300K
Diffusion (kJ/mol)
α* at 300 K (m/s)
2.0 × 10−
16.5
CO2
5
8.0 × 10−
13.0
15.5
CH4
3.0 × 10−
f
Ceq − Cpeq in Equation (3). In the case of CO2 and a feed pressure of 2 bar
(a), a maximum driving force was observed at about 285 K. This
maximum driving force was a result of increasing CO2 adsorption to
4
f
wards saturation at the feed side (Ceq ) when the temperature was
decreasing to 285 K. At temperatures lower than 285 K, the driving force
of CO2 was reduced due to increased adsorption towards saturation at
the permeate side (Cpeq ). The presence of the maximum driving force for
CO2 mass transfer was the main reason for the maximum CO2 flux at 280
K, as shown in Fig. 6a. However, the maximum CO2 flux was observed at
a slightly lower temperature than the temperature at which the
maximum driving force occurred, due to the increasing surface perme
ability of CO2 with decreasing temperature. As mentioned above, a
maximum ideal permeance selectivity of 160 was observed at 280 K,
which was because the maximum driving force for CH4 occurred at a
lower temperature (220 K) than the temperature at which the maximum
driving force for CO2 occurred (285 K).
Table 3 demonstrates that the activation energy for surface
7.0
Mixture
5
CO2
8.0 × 10−
4
denominator value in Equation (4) of approximately 0.44, a small αCH4
value of 6.1 × 10− 6 m/s, and an ideal surface permeability selectivity of
943. In addition, the activation energy for surface permeability Eα of
CH4 (16.5 kJ/mol) was larger than that of CO2 (13.0 kJ/mol) (see
Table 3). Thus, there was a higher temperature sensitivity and a greater
reduction of the surface permeability for CH4 at lower temperatures,
which supports the observation that surface permeability selectivity
increases with decreasing temperature.
9
M.S. Nobandegani et al.
Microporous and Mesoporous Materials 332 (2022) 111716
permeability was higher than the activation energy for diffusion in the
pores. This indicates that surface permeation was the limiting mass
transfer step across the membrane and, consequently, this higher acti
vation energy caused the surface barrier [56]. Furthermore, the ratio
Lα0 αL
D(α0 +αL ) can be used to determine if either the surface permeability or the
pores, with more significant interactions within the pores than at the
pore mouth. Consequently, it appeared that the surface barrier is a
geometrical effect. The excellent fit between the model and the more
extensive experimental data for a CHA membrane at two different
pressures and over a wide temperature range in the present work in
dicates that Equation (3) provides an adequate description of the mass
transfer and that Equation (4) provides an adequate description of the
temperature and concentration dependencies of the surface
permeability.
diffusivity was limiting the mass transfer [56]. For single-component
permeation of CO2 and CH4, this ratio was 0.18 and 0.13, respec
tively. These low ratios indicate that the surface barrier controls the
ărger et al. [50,51] observed
mass transport in the thin membranes. Ka
increasing surface permeability with increasing concentration of
adsorbed molecules. However, no mathematical description of this de
pendency was suggested.
In our previous work [56], we showed that when Equation (4)
accurately describes the surface permeability, it can be fitted well to our
experimental data as well as to the experimental data reported by Kă
arger
et al. [50,51]. Equation (4) is similar to the HIO model derived for
surface diffusion [82] under the assumption that molecules jump from
site to site, and if a site is occupied, the molecule is scattered to another
site. In the HIO model, it is further assumed that molecular interactions
are negligible, which results in n = 1.0. The successful fitting of Equation
(4) to the experimental data suggests that the surface permeation pro
cess is a surface diffusion process [56]. We observed that the fitted
activation energy for surface permeability Eα was higher than the acti
vation energy for surface diffusion EDiffusion within the pores and that the
molecular interactions increased n to 1.2, which reduced these activa
tion energies. We suggested that the surface barrier is a result of the
geometrical differences between the pore mouth and the interior of the
3.4. Mixture permeation experiments
The points in Fig. 7a represent, as a function of temperature, the
experimental permeation data for a feed of CO2/CH4 mixtures with
compositions of 50/50 and 80/20 (molar ratios) at a feed pressure of 5.5
bar(a), and a permeate pressure of 1 bar(a). The observed CO2 flux was
consistently about two orders of magnitude higher than the observed
CH4 flux. The membrane was highly CO2 selective across the entire
studied temperature range and a maximum separation factor of 156 was
observed at 273 K (Fig. S5), which corresponded to a mixture permeance
selectivity of 243 (Fig. 7b). Table 4 summarizes CO2/CH4 separation
data reported for zeolite and MOF membranes in the literature and in the
present work.
As shown in Fig. 7b, the selective mass transfer across the membrane
was a result of the high mixture surface permeability selectivity
(approximately 54 at 300 K) and high mixture adsorption selectivity
(6.7 at 300 K). The curves in Fig. 7a illustrate that the same model and
Fig. 7. a) Fluxes observed for CO2/CH4 mixtures with compositions of 50/50 and 80/20 (molar ratios), b) Mixture selectivities and driving forces for a 50/50 CO2/
CH4 mixture, and c) Mixture selectivities and driving forces for an 80/20 CO2/CH4 mixture. Points indicate experimental data and curves indicate the fitted model.
10
M.S. Nobandegani et al.
Microporous and Mesoporous Materials 332 (2022) 111716
The model demonstrated that the surface barrier was a surface diffusion
process with higher activation energy than the surface diffusion process
in the pores. Furthermore, the model showed that the highly selective
mass transfer for single components and mixtures through the ultra-thin
CHA membrane was mostly a result of a high surface permeability
selectivity, i.e., a selective surface barrier, and, to a lesser extent, the
CO2/CH4 adsorption selectivity.
Table 4
Reported CO2/CH4 separation data for zeolite and MOF membranes in the
literature and in the present work.
Membrane
Temperature
(K)
Pressure
(bar)
Selectivity
Permeance
10− 7 mol/
(m2 s Pa)
Ref.
SAPO-34
MFI
293
250
1.4
7.0
152
7.1
39.0
98
[34]
[83]
SSZ-13
DDR
DDR
NaX
ZIF-8
LTA
MOF-5/
Matrimid
Si-CHA
303
293
303
308
298
303
308
2.0
1.0
1.0
1.0
1.0
3.0
3.0
300
150
400
28
2.2–32
20.5
29
2.0
8.6
0.65
3.0
0.3–2.5
4
0.002
[22]
[84]
[85]
[86]
[87]
[88]
[89]
276
9.0
47
84
[35]
Si-CHA
295
5.0
103
60
[90]
Si-CHA
293
6.0
198
14
[91]
Si-CHA
273
5.5
243
70
This
work
a
a
CRediT authorship contribution statement
Mojtaba Sinaei Nobandegani: Writing – original draft, Writing –
review & editing, Visualization, Validation, Formal analysis, Concep
tualization, Investigation. Liang Yu: Investigation, Supervision, Writing
– review & editing, Conceptualization, Formal analysis. Jonas Hed
lund: Writing – review & editing, Visualization, Validation, Supervision,
Methodology, Investigation, Funding acquisition, Formal analysis,
Conceptualization.
a
a
Declaration of competing interest
a
The authors declare that they have no known competing financial
interests or personal relationships that could have appeared to influence
the work reported in this paper.
Our previous work.
Acknowledgments
similar parameters that were fitted to the single-component permeation
data could also describe the permeation data for the mixture. In the
mixture, the same surface permeability for CO2 and a slightly larger
surface permeability for CH4 were observed. This is consistent with
observations in our previous work [56] and indicates that the highly
mobile CO2 molecules interacted with the less mobile CH4 molecules,
thereby increasing the surface permeability for CH4. The concentration
of molecules in the zeolite pores was estimated using the ideal adsorp
tion solution theory (IAST). The difference in flux between the experi
mental data and the model at low temperatures (<300 K) may be an
effect of the non-ideal behavior of the gas at low temperatures [92].
As shown in Fig. 7, the model adequately described the experimental
results for both the 50/50 and the 80/20 mixtures (molar ratios). For the
80/20 mixture, the experimentally observed CO2 flux, CO2/CH4 sepa
ration factors (Fig. S5), and mixture permeance selectivities (Fig. 7c)
were higher than those for the 50/50 mixture. Fig. 7c illustrates that this
is largely due to the higher mixture adsorption selectivity of the 80/20
mixture. In addition, the high mixture permeance selectivity for this
mixture is mainly a result of the mixture surface permeability selectivity
and, to a lesser extent, the mixture adsorption selectivity.
The Swedish Research Council; Formas, a Swedish research council
for sustainable development; and Bio4energy are gratefully acknowl
edged for financially supporting this work.
Appendix A. Supplementary data
Supplementary data to this article can be found online at https://doi.
org/10.1016/j.micromeso.2022.111716.
References
[1] M.G.D.P. Abdeshahian, M.S. Kalil, W.M.W. Yusoff, Production of biofuel using
biomass as a sustainable biological resource, Biotechnology 9 (2010) 274–282,
/>[2] B. Shimekit, H. Mukhtar, Natural gas purification technologies - major advances for
CO2 separation and future directions, in: H. Al-Megren (Ed.), Advances in Natural
Gas Technology, IntechOpen, 2012, pp. 235–239.
[3] E. Porpatham, A. Ramesh, B. Nagalingam, Investigation on the effect of
concentration of methane in biogas when used as a fuel for a spark ignition engine,
Fuel 87 (2008) 1651–1659, />[4] T.E. Whyte Jr., C.M. Yon, E.H. Wagener, Industrial Gas Separations, ACS
Publications, Washington, 1983.
[5] D.M. Ruthven, S. Farooq, K.S. Knaebel, Pressure Swing Adsorption, Wiley, New
York, 1996.
[6] M. Tagliabue, D. Farrusseng, S. Valencia, S. Aguado, U. Ravon, C. Rizzo, A. Corma,
C. Mirodatos, Natural gas treating by selective adsorption: material science and
chemical engineering interplay, Chem. Eng. J. 155 (2009) 553–566, https://doi.
org/10.1016/j.cej.2009.09.010.
[7] P. Rotunno, A. Lanzini, P. Leone, Energy and economic analysis of a water
scrubbing based biogas upgrading process for biomethane injection into the gas
grid or use as transportation fuel, Renew. Energy 102 (2017) 417–432, https://doi.
org/10.1016/j.renene.2016.10.062.
[8] T. Patterson, S. Esteves, R. Dinsdale, A. Guwy, An evaluation of the policy and
techno-economic factors affecting the potential for biogas upgrading for transport
fuel use in the UK, Energy Pol. 39 (2011) 1806–1816, />enpol.2011.01.017.
[9] R.A. Khatri, S.S.C. Chuang, Y. Soong, M. Gray, Thermal and chemical stability of
regenerable solid amine sorbent for CO2 capture, Energy & Fuels 20 (2006)
1514–1520, />[10] M. Delavar, A.A. Ghoreyshi, M. Jahanshahi, S. Khalili, N. Nabian, The effect of
chemical treatment on adsorption of natural gas by multi-walled carbon
nanotubes: sorption equilibria and thermodynamic studies, Chem. Ind. Chem. Eng.
Q. 18 (2012) 193–207, />[11] I.A.A.C. Esteves, M.S.S. Lopes, P.M.C. Nunes, J.P.B. Mota, Adsorption of natural gas
and biogas components on activated carbon, Separ. Purif. Technol. 62 (2008)
281–296, />[12] M. Tagliabue, C. Rizzo, N.B. Onorati, E.F. Gambarotta, A. Carati, F. Bazzano,
Regenerability of zeolites as adsorbents for natural gas sweetening: a case-study,
Fuel 93 (2012) 238–244, />
4. Conclusions
Large and well-defined CHA crystals with systematically varied Si/Al
ratios were successfully synthesized. Toth adsorption isotherms were
fitted to the CO2 and CH4 adsorption data measured over a wide tem
perature range of the crystals. We observed that the heat of adsorption
and b-value increased nearly linearly with the Al/Si ratio, while the
parameter t decreased nearly linearly with the same ratio. Permeation
experiments with single components and mixtures of CO2 and CH4 were
conducted for an essentially defect-free ultra-thin CHA membrane over a
wide temperature range. The highest observed selectivity was 243 in
combination with a CO2 permeance of 70 × 10− 7 mol/(m2 s Pa) for a
feed of an equimolar CO2/CH4 mixture at 273 K. The adsorption pa
rameters were estimated for the Si/Al ratio of the membrane. A simple
mass transfer model accounting for adsorption and diffusion through the
surface barriers and pores of the membrane was successfully fitted to the
experimental permeation data. The good fit of the model to the singlecomponent data at different pressures and its applicability to the
mixture separation data for different compositions indicates that the
model provided an accurate physical description of the mass transfer.
11
M.S. Nobandegani et al.
Microporous and Mesoporous Materials 332 (2022) 111716
[13] W.H. Zhou, J.P. Guo, H.Y. Tan, Upgrading of methane from biogas by pressure
swing adsorption, Adv. Mater. Res. 236–238 (2011) 268–271. />4028/www.scientific.net/AMR.236-238.268.
[14] R.S.K. Valappil, N. Ghasem, M. Al-Marzouqi, Current and future trends in polymer
membrane-based gas separation technology: a comprehensive review, J. Ind. Eng.
Chem. 98 (2021) 103–129, />[15] D. Korelskiy, M. Grahn, P. Ye, M. Zhou, J. Hedlund, A study of CO2/CO separation
by sub-micron b-oriented MFI membranes, RSC Adv. 6 (2016) 65475–65482,
/>[16] H. Nguyen, M. Wang, M.-Y. Hsiao, K. Nagai, Y. Ding, H. Lin, Suppression of
crystallization in thin films of cellulose diacetate and its effect on CO2/CH4
separation properties, J. Membr. Sci. 586 (2019) 7–14, />memsci.2019.05.039.
[17] X.Y. Chen, H. Vinh-Thang, A.A. Ramirez, D. Rodrigue, S. Kaliaguine, Membrane
gas separation technologies for biogas upgrading, RSC Adv. 5 (2015)
24399–24448, />[18] J. P´
erez-Pellitero, G.D. Pirngruber, Industrial zeolite applications for gas
adsorption and separation processes, in: S. Valencia, F. Rey (Eds.), New
Developments in Adsorption/Separation of Small Molecules by Zeolites, Springer
International Publishing, Cham, 2020, pp. 195–225.
[19] M. Minceva, A.E. Rodrigues, Understanding and revamping of industrial scale SMB
units for p-xylene separation, AIChE J. 53 (2007) 138–149, />10.1002/aic.11062.
[20] M. Minceva, A.E. Rodrigues, Modeling and simulation of a simulated moving bed
for the separation of p-xylene, Ind. Eng. Chem. Res. 41 (2002) 3454–3461, https://
doi.org/10.1021/ie010095t.
[21] H. Wang, M. Wang, X. Liang, J. Yuan, H. Yang, S. Wang, Y. Ren, H. Wu, F. Pan,
Z. Jiang, Organic molecular sieve membranes for chemical separations, Chem. Soc.
Rev. 50 (2021) 5468–5516, />[22] Y. Zheng, N. Hu, H. Wang, N. Bu, F. Zhang, R. Zhou, Preparation of steam-stable
high-silica CHA (SSZ-13) membranes for CO2/CH4 and C2H4/C2H6 separation,
J. Membr. Sci. 475 (2015) 303–310, />memsci.2014.10.048.
[23] H. Kalipcilar, T.C. Bowen, R.D. Noble, J.L. Falconer, Synthesis and separation
performance of SSZ-13 zeolite membranes on tubular supports, Chem. Mater. 14
(2002) 3458–3464, />[24] N. Kosinov, C. Auffret, G.J. Borghuis, V.G.P. Sripathi, E.J.M. Hensen, Influence of
the Si/Al ratio on the separation properties of SSZ-13 zeolite membranes,
J. Membr. Sci. 484 (2015) 140–145, />memsci.2015.02.044.
[25] N. Kosinov, C. Auffret, C. Gücüyener, B.M. Szyja, J. Gascon, F. Kapteijn, E.J.
M. Hensen, High flux high-silica SSZ-13 membrane for CO2 separation, J. Mat.
Chem. A 2 (2014) 13083–13092, />[26] Y. Luo, H.H. Funke, J.L. Falconer, R.D. Noble, Adsorption of CO2, CH4, C3H8, and
H2O in SSZ-13, SAPO-34, and T-type zeolites, Ind. Eng. Chem. Res. 55 (2016)
9749–9757, />[27] T.D. Pham, R.F. Lobo, Adsorption equilibria of CO2 and small hydrocarbons in AEI, CHA-, STT-, and RRO-type siliceous zeolites, Microporous Mesoporous Mater. 236
(2016) 100–108, />[28] M. Miyamoto, H. Iwatsuka, Y. Oumi, S. Uemiya, S. Van den Perre, G.V. Baron, J.F.
M. Denayer, Effect of core-shell structuring of chabazite zeolite with a siliceous
zeolite thin layer on the separation of acetone-butanol-ethanol vapor in humid
vapor conditions, Chem. Eng. J. 363 (2019) 292–299, />cej.2019.01.106.
[29] H. Maghsoudi, M. Soltanieh, H. Bozorgzadeh, A. Mohamadalizadeh, Adsorption
isotherms and ideal selectivities of hydrogen sulfide and carbon dioxide over
methane for the Si-CHA zeolite: comparison of carbon dioxide and methane
adsorption with the all-silica DD3R zeolite, Adsorption 19 (2013) 1045–1053,
/>[30] K. Kida, Y. Maeta, K. Yogo, Preparation and gas permeation properties on pure
silica CHA-type zeolite membranes, J. Membr. Sci. 522 (2017) 363370, https://
doi.org/10.1016/j.memsci.2016.09.002.
[31] P. Karakiliỗ, X. Wang, F. Kapteijn, A. Nijmeijer, L. Winnubst, Defect-free high-silica
CHA zeolite membranes with high selectivity for light gas separation, J. Membr.
Sci. 586 (2019) 34–43, />[32] Y. Hasegawa, C. Abe, M. Natsui, A. Ikeda, Gas permeation properties of high-silica
CHA-type zeolite membrane, Membranes 11 (2021) 249, />membranes11040249.
[33] R. Zhou, E.W. Ping, H.H. Funke, J.L. Falconer, R.D. Noble, Improving SAPO-34
membrane synthesis, J. Membr. Sci. 444 (2013) 384–393, />10.1016/j.memsci.2013.05.048.
[34] Y. Zhang, M. Wang, H.e. Qiu, L. Kong, N. Xu, X. Tang, D. Meng, X. Kong, Y. Zhang,
Synthesis of thin SAPO-34 zeolite membranes in concentrated gel, J. Membr. Sci.
612 (2020) 118451, />[35] L. Yu, A. Holmgren, M. Zhou, J. Hedlund, Highly permeable CHA membranes
prepared by fluoride synthesis for efficient CO2/CH4 separation, J. Mat. Chem. A 6
(2018) 6847–6853, />[36] L. Yu, M. Sinaei Nobandegani, A. Holmgren, J. Hedlund, Highly permeable and
selective tubular zeolite CHA membranes, J. Me. Sci. 588 (2019) 117224, https://
doi.org/10.1016/j.memsci.2019.117224.
[37] J. Zhou, F. Gao, K. Sun, X. Jin, Y. Zhang, B. Liu, R. Zhou, Green synthesis of highly
CO2-selective CHA zeolite membranes in all-silica and fluoride-free solution for
CO2/CH4 separations, Energy & Fuels 34 (2020) 11307–11314, />10.1021/acs.energyfuels.0c01717.
[38] K. Kida, Y. Maeta, K. Yogo, Pure silica CHA-type zeolite membranes for dry and
humidified CO2/CH4 mixtures separation, Separ. Purif. Technol. 197 (2018)
116–121, />[39] R. Krishna, J.M. van Baten, Silico screening of zeolite membranes for CO2 capture,
J. Membr. Sci. 360 (2010) 323–333, />memsci.2010.05.032.
[40] R. Krishna, J.M. van Baten, Maxwell–Stefan modeling of slowing-down effects in
mixed gas permeation across porous membranes, J. Membr. Sci. 383 (2011)
289–300, />[41] W.J.W. Bakker, L.J.P. van den Broeke, F. Kapteijn, J.A. Moulijn, Temperature
dependence of one-component permeation through a silicalite-1 membrane, AIChE
J. 43 (1997) 2203–2214, />[42] L.J.P. van den Broeke, W.J.W. Bakker, F. Kapteijn, J.A. Moulijn, Transport and
separation properties of a silicalite-1 membrane—I. Operating conditions, Chem.
Eng. Sci. 54 (1999) 245–258, />[43] W. Zhu, P. Hrabanek, L. Gora, F. Kapteijn, J.A. Moulijn, Role of adsorption in the
permeation of CH4 and CO2 through a silicalite-1 membrane, Ind. Eng. Chem. Res.
45 (2006) 767–776, />[44] J. van den Bergh, S. Ban, T.J.H. Vlugt, F. Kapteijn, Modeling the loading
dependency of diffusion in zeolites: the relevant site model, J. Phys. Chem. C 113
(2009) 17840–17850, />[45] J. Kă
arger, J. Caro, M. Bỹlow, Der Einfluss von Oberflă
achen-barrieren auf den
Sorptionsvorgang an 5A-Zeolithen, Z. Chem. 16 (1976) 331332.
[46] D. Tzoulaki, L. Heinke, H. Lim, J. Li, D. Olson, J. Caro, R. Krishna, C. Chmelik,
J. Kă
arger, Assessing surface permeabilities from transient guest profiles in
nanoporous host materials, Angew. Chem. Int. Ed. 48 (2009) 3525–3528, https://
doi.org/10.1002/anie.200804785.
[47] S.M. Auerbach, K.A. Carrado, P.K. Dutta, Handbook of Zeolite Science and
Technology, CRC Press, 2003.
[48] M. Koˇciˇrík, P. Struve, K. Fiedler, M. Bülow, A model for the mass-transfer resistance
at the surface of zeolite crystals, J. Chem. Soc. Faraday Trans. I 84 (1988)
30013013, />[49] J. Kă
arger, In-depth study of surface resistances in nanoporous materials by
microscopic diffusion measurement, Micropor, Mesopor. Mat 189 (2014) 126–135,
/>[50] F. Hibbe, C. Chmelik, L. Heinke, S. Pramanik, J. Li, D.M. Ruthven, D. Tzoulaki,
J. Kă
arger, The nature of surface barriers on nanoporous solids explored by
microimaging of transient guest distributions, J. Am. Chem. Soc. 133 (2011)
2804–2807, />[51] J.C.S. Remi, A. Lauerer, C. Chmelik, I. Vandendael, H. Terryn, G.V. Baron, J.F.
M. Denayer, J. Kă
arger, The role of crystal diversity in understanding mass transfer
in nanoporous materials, Nat. Mat. 15 (2016) 401–406, />nmat4510.
[52] J. Caro, M. Bülow, H. Jobic, J. Kă
arger, B. Zibrowius, Molecular mobility
measurement of hydrocarbons in zeolites by NMR techniques, in: D.D. Eley,
H. Pines, P.B. Weisz (Eds.), Advances in Catalysis, Academic Press, 1993,
pp. 351–414.
[53] A. Micke, M. Bülow, M. Kocirik, A nonequilibrium surface barrier for sorption
kinetics of p-ethyltoluene on ZSM-5 molecular sieves, J. Phys. Chem. 98 (1994)
924–929, />[54] D. Shen, M. Bülow, N.O. Lemcoff, Mechanisms of molecular mobility of oxygen and
nitrogen in carbon molecular sieves, Adsorption 9 (2003) 295302, https://doi.
org/10.1023/A:1026239829164.
[55] G. Sastre, J. Kă
arger, D.M. Ruthven, Surface barriers and symmetry of adsorption
and desorption processes, Adsorption (2020) 777–785, />s10450-020-00260-1.
[56] J. Hedlund, M. Sinaei Nobandegani, L. Yu, The origin of the surface barrier in
nanoporous materials, J. Membr. Sci. 641 (2022), />memsci.2021.119893, 119893.
[57] J. Yang, Q. Zhao, H. Xu, L. Li, J. Dong, J. Li, Adsorption of CO2, CH4, and N2 on gas
diameter grade ion-exchange small pore zeolites, J. Chem. Eng. Data 57 (2012)
3701–3709, />[58] Z. Pourmahdi, H. Maghsoudi, Adsorption isotherms of carbon dioxide and methane
on CHA-type zeolite synthesized in fluoride medium, Adsorption 23 (2017)
799–807, />[59] Y. Guo, T. Sun, Y. Gu, X. Liu, Q. Ke, X. Wei, S. Wang, Rational synthesis of
chabazite (CHA) zeolites with controlled Si/Al ratio and their CO2/CH4/N2
adsorptive separation performances, Chem. Asian J. 13 (2018) 3222–3230,
/>[60] M.S. Nabavi, M. Zhou, J. Mouzon, M. Grahn, J. Hedlund, Stability of colloidal ZSM5 catalysts synthesized in fluoride and hydroxide media, Microporous Mesoporous
Mater. 278 (2019) 167–174, />[61] C. Jo, W. Park, R. Ryoo, Synthesis of mesoporous zeolites in fluoride media with
structure-directing multiammonium surfactants, Microporous Mesoporous Mater.
239 (2017) 19–27, />[62] P. Ye, M. Grahn, D. Korelskiy, J. Hedlund, Efficient separation of N2 and He at low
temperature using MFI membranes, AIChE J. 62 (2016) 2833–2842, https://doi.
org/10.1002/aic.15258.
[63] D.D. Do, Adsorption Analysis: Equilibria and Kinetics, Imperial College Press,
London, 1998.
[64] S. Arrhenius, Über die Dissociationswă
arme und den Einfluss der Temperatur auf
den Dissociationsgrad der Elektrolyte, in: Zeitschrift für Physikalische Chemie 4U,
1889, pp. 96–116, />[65] W. Sutherland, LII. The viscosity of gases and molecular force, London, Edinburgh,
Dublin Philos. Mag. J. Sci. 36 (1893) 507–531, />14786449308620508.
12
M.S. Nobandegani et al.
Microporous and Mesoporous Materials 332 (2022) 111716
[66] L. Sandstră
om, J. Lindmark, J. Hedlund, Separation of methanol and ethanol from
synthesis gas using MFI membranes, J. Membr. Sci. 360 (2010) 265–275, https://
doi.org/10.1016/j.memsci.2010.05.022.
[67] L. Yu, M. Grahn, J. Hedlund, Ultra-thin MFI membranes for removal of C3+
hydrocarbons from methane, J. Membr. Sci. 551 (2018) 254–260, />10.1016/j.memsci.2018.01.054.
[68] S. Brunauer, L.S. Deming, W.E. Deming, E. Teller, On a theory of the van der Waals
adsorption of gases, J. Am. Chem. Soc. 62 (1940) 1723–1732, />10.1021/ja01864a025.
[69] W.M. Haynes, D.R. Lide, CRC Handbook of Chemistry and Physics : a ReadyReference Book of Chemical and Physical Data, CRC Press, Boca Raton, Fla, 2011.
[70] M. Younas, M. Sohail, L.K. Leong, M.J. Bashir, S. Sumathi, Feasibility of CO2
adsorption by solid adsorbents: a review on low-temperature systems, Int. J.
Environ. Sci. Technol. 13 (2016) 1839–1860, />[71] D. Bonenfant, M. Kharoune, P. Niquette, M. Mimeault, R. Hausler, Advances in
principal factors influencing carbon dioxide adsorption on zeolites, Sci. Technol.
Adv. Mater. 9 (2008), />[72] A. Osatiashtiani, B. Pu´
ertolas, C.C.S. Oliveira, J.C. Manayil, B. Barbero, M. Isaacs,
C. Michailof, E. Heracleous, J. P´
erez-Ramírez, A.F. Lee, K. Wilson, On the influence
of Si:Al ratio and hierarchical porosity of FAU zeolites in solid acid catalysed
esterification pretreatment of bio-oil, Biomass Convers. Biorefin. 7 (2017)
331–342, />[73] Y. Wang, C. Yang, Y. Liu, X. Feng, H. Fu, H. Shan, Effect of Si/Al ratio on tetralin
adsorption on Y zeolite: a DFT study, Mol. Simulat. 43 (2017) 945–952, https://
doi.org/10.1080/08927022.2017.1308509.
[74] M. Maache, A. Janin, J.C. Lavalley, E. Benazzi, FT infrared study of bronsted
acidity of H-mordenites - heterogeneity and effect of dealumination, Zeolites 15
(1995) 507–516, />[75] P.A. Jacobs, E.M. Flanigen, J.C. Jansen, H. van Bekkum, Introduction to Zeolite
Science and Practice, Elsevier Science, 2001.
[76] S.S.A. Talesh, S. Fatemi, S.J. Hashemi, M. Ghasemi, Effect of Si/Al ratio on CO2CH4 adsorption and selectivity in synthesized SAPO-34, Separ. Sci. Technol. 45
(2010) 1295–1301, />[77] Y. Wang, H. Jia, X. Fang, Z. Qiu, T. Du, CO2 and water vapor adsorption properties
of framework hybrid W-ZSM-5/silicalite-1 prepared from RHA, RSC Adv. 10
(2020) 24642–24652, />[78] H. Fang, P. Kamakoti, J. Zang, S. Cundy, C. Paur, P.I. Ravikovitch, D.S. Sholl,
Prediction of CO2 adsorption properties in zeolites using force fields derived from
periodic dispersion-corrected DFT calculations, J. Phys. Chem. C 116 (2012)
10692–10701, />[79] N. Kanellopoulos, Nanoporous Materials: Advanced Techniques for
Characterization, Modeling, and Processing, CRC Press, 2016.
[80] D. Korelskiy, P. Ye, S. Fouladvand, S. Karimi, E. Sjă
oberg, J. Hedlund, Efficient
ceramic zeolite membranes for CO2/H2 separation, J. Mat. Chem. A 3 (2015)
12500–12506, />[81] A.R. Teixeira, C.-C. Chang, T. Coogan, R. Kendall, W. Fan, P.J. Dauenhauer,
Dominance of surface barriers in molecular transport through silicalite-1, J. Phys.
Chem. C 117 (2013) 25545–25555, />[82] K. Higashi, H. Ito, J. Oishi, Surface diffusion phenomena in gaseous diffusion, (II)
separation of binary gas-mixtures, J. Nucl. Sci. Technol. 1 (1964) 298–304, https://
doi.org/10.1080/18811248.1964.9732128.
[83] L. Yu, S. Fouladvand, M. Grahn, J. Hedlund, Ultra-thin MFI membranes with
different Si/Al ratios for CO2/CH4 separation, Microporous Mesoporous Mater. 284
(2019) 258–264, />[84] N. Xu, D. Meng, X. Tang, X. Kong, L. Kong, Y. Zhang, H.E. Qiu, M. Wang, Y. Zhang,
Fast synthesis of thin all-silica DDR zeolite membranes with inorganic base as
mineralizing agent for CO2-CH4 separation, Separ. Purif. Technol. 253 (2020)
117505, />[85] J. van den Bergh, W. Zhu, F. Kapteijn, J.A. Moulijn, K. Yajima, K. Nakayama,
T. Tomita, S. Yoshida, Separation of CO2 and CH4 by a DDR membrane, Res. Chem.
Intermed. 34 (2008) 467–474, />[86] Y. Hasegawa, T. Tanaka, K. Watanabe, B.-H. Jeong, K. Kusakabe, S. Morooka,
Separation of CO2-CH4 and CO2-N2 systems using ion-exchanged FAU-type zeolite
membranes with different si/al ratios, Kor. J. Chem. Eng. 19 (2002) 309–313,
/>[87] K. Eum, M. Hayashi, M.D. De Mello, F. Xue, H.T. Kwon, M. Tsapatsis, ZIF-8
membrane separation performance tuning by vapor phase ligand treatment,
Angew. Chem. Int. Ed. 58 (2019) 16390–16394, />anie.201909490.
[88] M. Sen, K. Dana, N. Das, Development of LTA zeolite membrane from clay by
sonication assisted method at room temperature for H2-CO2 and CO2-CH4
separation, Ultrason. Sonochem. 48 (2018) 299–310, />ultsonch.2018.06.007.
[89] E.V. Perez, K.J. Balkus, J.P. Ferraris, I.H. Musselman, Mixed-matrix membranes
containing MOF-5 for gas separations, J. Membr. Sci. 328 (2009) 165–173, https://
doi.org/10.1016/j.memsci.2008.12.006.
[90] L. Yu, A. Holmgren, J. Hedlund, A novel method for fabrication of high-flux zeolite
membranes on supports with arbitrary geometry, J. Mat. Chem. A 7 (2019)
10325–10330, />[91] L. Yu, M. Sinaei Nobandegani, J. Hedlund, Industrially relevant CHA membranes
for CO2/CH4 separation, J. Membr. Sci. 641 (2022), />memsci.2021.119888, 119888.
[92] C. Vallance, Ideal gases and real gases, in: An Introduction to the Gas Phase,
Morgan & Claypool Publishers, 2017, pp. 17–20.
13