High content and dispersion of Gd in bimodal porous silica: T2 contrast agents under ultra-high magnetic fields
Bạn đang xem bản rút gọn của tài liệu. Xem và tải ngay bản đầy đủ của tài liệu tại đây (14.38 MB, 15 trang )
Microporous and Mesoporous Materials 336 (2022) 111863
Contents lists available at ScienceDirect
Microporous and Mesoporous Materials
journal homepage: www.elsevier.com/locate/micromeso
High content and dispersion of Gd in bimodal porous silica: T2 contrast
agents under ultra-high magnetic fields☆
´nchez-Royo a,
M. Dolores Garrido a, Nuria Puchol a, Jamal El Haskouri a, ***, Juan Francisco Sa
a
b, c
b
Jos´e Vicente Folgado , Vannina Gonzalez Marrachelli , Itziar P´erez Terol , Jos´e Vicente Ros´n a, Jos´e Manuel Morales b, g, h,
Lis d, **, M. Dolores Marcos e, Rafael Ruíz f, Aurelio Beltra
a, *
´s
Pedro Amoro
a
Institut de Ci`encia dels Materials (ICMUV), Universitat de Val`encia, P. O. Box 22085, 46071, Valencia, Spain
Laboratory of Metabolomics, Institute of Health Research-INCLIVA, 46010, Valencia, Spain
c
Department of Physiology, School of Medicine, University of Valencia, 46010, Valencia, Spain
d
Departamento de Química Inorg´
anica, Universitat de Val`encia, Doctor Moliner 56, 46100, Valencia, Spain
e
Departamento de Química, Universidad Polit´ecnica de Valencia CIBER de Bioingeniería, Biomateriales y Nanomedicina (CIBER-BBN), Spain
f
Instituto de Ci`encia Molecular (ICMol), Universitat de Val`encia, Catedr´
atico Jos´e Beltr´
an 2, 46980, Paterna, Valencia, Spain
g
Unidad Central de Investigaci´
on en Medicina, University of Valencia, 46010, Valencia, Spain
h
Pathology Department, School of Medicine, University of Valencia, 46010, Valencia, Spain
b
A R T I C L E I N F O
A B S T R A C T
Keywords:
Mesoporous
Silica
Gadolinium
Magnetic resonance image
Magnetic resonance microscopy
Silica-based UVM-7-type bimodal mesoporous materials with high gadolinium content (∞ ≥ Si/Gd ≥ 13) have
been synthesized through a one-pot surfactant-assisted procedure from hydroalcoholic solution using a cationic
surfactant as template, and starting from atrane complexes of Gd and Si as inorganic precursors. The novel
synthetic pathway developed in the study preserves the UVM-7-type architecture while optimizing the dispersion
of the Gd-guest species at the nanoscale and even at atomic level. It has been determined that the number of Gd
atoms forming clusters is always less than 10. The behaviour under exposure to ultra-high magnetic fields reveals
a significant increase in the transversal relaxivity value when compared with related materials in the bibliog
raphy. Their activity as T2 instead of T1 contrast agents is discussed and explained considering the high Gddispersion and concentration, nature of the materials as well as due to the high magnetic fields used, typical
of MRM studies. The absence of toxicity has been confirmed in preliminary cell cultures “in vitro” and the
degradation of the solids studied under biological conditions. Results suggest that the atrane route could be a
suitable synthesis approach for the preparation of Gd containing contrast agents.
1. Introduction
Magnetic resonance imaging (MRI) is currently one of the most used
medical diagnostic modalities. This non-invasive technique provides
three-dimensional whole body anatomical imaging with high spatial
resolution and almost no limit in penetration depth [1–3]. It exploits the
magnetic properties of water protons to distinguish between different
organs and/or tissue types. Nevertheless, there are situations where the
contrast between adjacent tissues are not strong enough to allow clear
discriminations or to enable the observation of fine details. The contrast
can be further improved by using non-therapeutic diagnostic com
pounds known as chemical contrast agents (CA). A CA provides image
contrast by shortening both the local longitudinal (T1) and transverse
(T2) relaxation times of the protons compared to the surrounding tissue
[4]. The ability of a CA to effectively enhance the image contrast is
measured as the longitudinal (r1) and transverse (r2) relaxivity values.
An effective MRI contrast agent must have a relatively large relaxivity
value, r1 (positive T1 CA) or r2 (negative T2 CA) [5,6]. T1 CA, based on
Dedicated to the memory of Professor Saúl Cabrera Medina.
* Corresponding author.
** Corresponding author.
*** Corresponding author.
E-mail addresses: (J. El Haskouri), (J.V. Ros-Lis), (P. Amor´
os).
☆
/>Received 19 January 2022; Received in revised form 7 March 2022; Accepted 20 March 2022
Available online 27 March 2022
1387-1811/© 2022 The Authors. Published by Elsevier Inc. This is an open access article under the CC BY-NC-ND license ( />
M.D. Garrido et al.
Microporous and Mesoporous Materials 336 (2022) 111863
paramagnetic species such as Gd(III) and Mn(II) that affect neighboring
protons through spin–lattice relaxation, produce positive (bright) image
contrast [7,8]. The Gd(III) is the most commonly used paramagnetic ion
because of its large magnetic moment with a long electron spin relaxa
tion time [9]. However, free Gd(III) ions are highly toxic. Hence, Gd(III)
ions are conventionally sequestered by chelation (with ligands such as
DTPA, DOTA) [10] or encapsulation [11,12] in order to reduce their
toxicity. Chelation decreases the toxicity of Gd(III) but at the same time
reduces the relaxivity as it limits the number of coordination sites
accessible for water exchange. In practice, commercial T1 CAs are
usually highly stable gadolinium complexes that suffer from low relax
ivity (r1 ~ 3 mM− 1s− 1 at 4.7 T), rapid renal clearance, and lack of tissue
specificity, thus providing contrast enhancement which is well below
the theoretical maximum limit [13]. In addition to chelates, a huge
variety of platforms (viral nanoparticles, protein-based agents, micelles
and liposomes, dendrimers, gold nanoparticles, carbon-based nano
particles and nano-tubes, etc.) are currently undergoing development
and testing as MRI contrast agents [14–16]. On the other hand,
T2-weighted images, based on superparamagnetic iron oxide particles
that locally modify the spin–spin relaxation process of water protons,
produce negative or dark images [6].
In contrast to the T2 CA type, solid materials have played an almost
testimonial role dealing with T1 CAs. Here, we can refer to the studies
devoted to Gd2O3, GdPO4 modified/protected with other inorganic or
organic species [17–23]. In other cases, Gd species, Gd2O3 and related
nanoparticles have been conveniently dispersed on or within different
supports. Thus, dextran coated gadolinium-doped CeO2 NPs with high
T1 relaxivity values have recently been described [24]. In this context, a
promising support that has been intensively explored is nano
particulated silica. Thus, silica can be used either as a carrier for mo
lecular paramagnetic Gd-chelates, as support for Gd2O3 nanoparticles or
as a coating material for magnetic nanoparticle cores [25–28]. However,
direct incorporation of Gd3+ ions into the silica matrix to render the
material MR active remains as a less explored strategy. Mesoporous
silicas can be suitable platforms for MR imaging CA because of their high
specific surface areas and large pore volumes, stable 3D structures
(forming networks of channels), and excellent biocompatibility. The
presence of silanol groups on their surfaces makes them hydrophilic,
which is a precondition for any in vivo application. Additionally, the key
to designing highly efficient MR imaging CAs is a high accessibility of
water to the magnetic centres [28–31]. An approach based on the
incorporation of Gd into the silica skeleton would not take up any space
in the pores. This strategy would enable accessibility of water towards
the paramagnetic centres while allowing that the pore space could be
used for loading of drugs or other active molecular agents in theranostic
devices [32].
Although from a basic point of view, a reasonable variety of CA
appears to be available, clinically “in vivo” barely ten Gd-based T1 CA
have been authorized by the FDA and EMA (for intravenous use) [33]. A
more restrictive situation takes place for the T2 CA. In fact, the only
authorized T2 agent is based on modified iron oxide particles but, in
addition, its administration is carried out exclusively orally for gastro
intestinal bowel marking [34].
At this point, a fact to highlight is the influence of the magnetic field
strength on MR imaging. In practice, the technique is progressively
evolving towards more intense fields. Indeed, the MRI instruments
typically found in the clinic make use of magnetic fields ranging from
1.5 to 3.0 T. However, the application of MRI scanners working at
magnetic fields as high as 9.4 T, firstly employed in preclinical assays
(small animals), has been recently reported for human imaging [35].
The increase of the magnetic field intensity leads to greater signal to
noise ratios (SNR), higher spatial resolutions and shorter acquisition
times. Indeed, these high-field features allow to speak of MR microscopy
(MRM). The term MRM specifies the use of ultra-high resolution (<100
μm) MR imaging. This resolution is lower than that of light microscopy
(0.25 μm), but much higher than clinical MR (approximately 1 mm in
plane resolution) [36]. Therefore, MRM provides a more detailed
anatomical picture of tissue than clinical MR: it improves the interpre
tation of clinical MR images in terms of cell biology processes or tissue
patterns [37] and constitutes a promising technique for the non-invasive
detection of a great variety of pathologies [38]. However, the time
necessary to obtain high-resolution 3D images is noticeably long, typi
cally 10 h. Furthermore, in many ultra-high field equipment, the size of
the sample that can be studied is considerably reduced, with the
consequent reduction in the signal intensity. To address these problems,
most small animal imaging or cell labelling studies are performed by
adding MRI CAs. The classical classification in T1 and T2 CAs loses
meaning when we are working at ultra-high magnetic fields (≥7 T)
because CA MRI performance is clearly magnetic field-dependent.
It is well known that for Gd-based T1 contrast agents, r1 typically
decreases with increasing at high fields while r2 is static or increases
resulting in an increasing r2/r1 ratio. The T2 effect is the dominant one
at the high field (as occurs in MRM) [14,39,40]. It has been published
that systems with an excessive gadolinium content may lead to a
disproportionate weight of T2 effects, which would have a negative ef
fect on T1 signal [40]. Furthermore, Tseng et al. have pointed out that
when the concentration of Gd becomes too high, the effect of T2
relaxation will overcome the effect of T1, thus partially cancelling the T1
signal [41]. Thus, gadolinium-based T2 CAs can be designed for MRM.
There are few reports dealing with Gd incorporation into the
framework of nanosized mesoporous silica. Lin et al. [42] reported on
Gd-incorporated mesoporous silicas synthesized by using a long-chain
surfactant as template. These materials showed proton relaxivities at
9.4 T higher than Gd-DTPA, with longitudinal relaxivity values (r1)
ranging from 23.6 to 4.4 mM− 1s− 1 and transverse relaxivity values (r2)
from 94.8 to 80.4 mM− 1s− 1 as the Gd loading increases from 1.6% to 6.8
wt%. However, their XRD patterns show a concomitant loss of order
towards wormhole like arrays that can restrict the access of water
molecules to the metal centres. Shao et al. [43,44] have reported
interesting results on two sorts of Gd-doped silica materials. Thus, they
described the one-step synthesis of Gd2O3@SiO2 particles displaying an
SBA-15-like mesoporous structure [43]. Nevertheless, in these mate
rials, Gd incorporation resulted in an important decrease of the BET
surface area (ca. 236.9 m2g-1) and virtually total loss of textural
porosity. On the other hand, they also prepared new Gd2O3@MCM-41
materials using the classical procedure for obtaining doped
MCM-41solids [44,45]. However, once again, the nanoparticles suffered
from the typical drawbacks of low water accessibility and loss of
structural features. One alternative approach to synthesize Gd doped
silica was used by Liu et al. [46], which replaced the templating sur
factant (CTAB) by gadolinium oleate. The resulting Gd-doped samples
were amorphous, with low BET surface area (150–200 m2g-1) and pore
volume values. Except for the work by Liu et al., MRI studies were
carried out on low fields (in the range of 0.5–3 T), with the study
focusing on the influence on r1. In these cases, and working under
relatively low magnetic fields, the longitudinal relaxivity values were
lower than that corresponding to the commercial Magnevist (r1 = 4.91
mM− 1s− 1). In no case was attention paid to the possibility of enhancing
r2 values from compounds containing gadolinium.
Our hypothesis is that the atrane route is a suitable synthesis strategy
for maximizing the incorporation of subnanometric homogeneously
dispersed Gd clusters in a UVM-7 type bimodal mesoporous silica. The
preservation of the hierarchical porous structure could allow the com
bination of diagnostic and therapeutic activity. These new materials
could act as Gd-based T2 CA capable of working efficiently under high
magnetic fields, this favouring the progress of the MRM technique.
2. Materials and methods
2.1. Chemicals
All the synthesis reagents were analytically pure and were used as
2
M.D. Garrido et al.
Microporous and Mesoporous Materials 336 (2022) 111863
Table 1
- Preparative parameters and selected physical data for the solids isolated by using the following reagent molar ratio: (2-x) Si: x Gd: 7 TEAH3: 0.5 CTAB: y H2O: z
Ethanol.
Mesoporeg
Sample
Si/Gd
Si/Gd
Si/Gd %
Gd /%
y
z
T/days
d100e/nm
UVM-7
1
2
3
4
5
6
7
8
9
10
–
100
50
25
50
50
50
50
25
50
50
–
62
42
22
26
19
17
13
6
19
11
–
4.0
5.8
10.4
9.0
11.8
13.0
16.3
29.1
11.9
18.5
–
3.6
5.3
11.0
8.7
12.2
13.3
16.1
37.5
12.3
20.6
180
180
180
180
2000
2880
1000
1000
1000
500
50
0
0
0
0
0
0
200
200
200
300
450
1
1
1
1
1
1
1
10
10
1
1
4.01
4.33
4.51
4.85
5.06
4.62
4.00
3.98
–
4.00
–
a
b
c
d
e
f
g
a
b
c
d
f
2
Large poreg
3
BET /m /g
Size/nm
Vol./cm /g
Size/nm
Vol./cm3/g
1061
1031
937
370
991
811
901
884
718
725
458
3.16
3.15
3.00
2.95
3.16
3.12
2.54
2.64
2.58
2.45
2.82
0.95
0.95
0.81
0.33
0.95
1.01
0.69
0.65
0.90
0.35
0.04
34.4
57.8
51.6
35.2
41.4
38.8
32.3
36.1
69.1
29.9
15.5
1.20
0.83
0.51
0.09
0.52
1.10
0.91
1.20
0.31
0.76
0.69
Si/Gd nominal molar ratio.
Si/Gd real molar ratio determined by EDX.
Gd content % (wt) determined through EDX assuming a general formula SiO2.(x/2)Gd2O3 (1/x = Si/Gd).
Gd content % (wt) determined through ICP.
d100 spacing from XRD.
Surface area determined by applying the BET model.
Pore sizes and volumes determined by applying the BJH model on the adsorption isotherm branches.
received from Aldrich (tetraethyl orthosilicate [TEOS], 2, 2′ ,2′′ -nitrilo
triethanol or triethanolamine [N(CH2–CH2–OH)3, hereinafter TEAH3],
gadolinium and yttrium trichlorides [GdCl3.6H2O, YCl3.6H2O], gado
linium oxide [Gd2O3], cetyl-trimethylamonium bromide [CTAB],
ethanol (99%), and phosphate-buffered saline (PBS) tablets).
physical data referred to both series of samples. Moreover, in order to
favour the materials dispersion, the samples can be ultrasonically
treated by using a Branson Sonifier 450 instrument equipped with a
direct immersion titanium horn operating at 20 kHz, with an intensity of
100 W/cm2; the sonication treatment was carried out in water, its
duration is limited to a 5 min and the system is also kept refrigerated in
an ice bath.
Additionally, we have synthesized some silica materials containing
simultaneously Gd and Y (see Supplementary Material, Table S1). The
magnetic properties of these solids have been studied in order to gain
insight on the Gd organization at the subnanoscale. The nominal molar
ratio of the reagents was as follows: 1.96 Si: 0.04 (Gd + Y): 7 TEAH3: 0.5
CTAB: 200 EtOH: 1000H2O, with Y/Gd = 10 and 100. Y was incorpo
rated to the initial reaction mixture jointly with Gd, and the preparative
procedure was as described above.
2.2. Synthesis
All solids described here have been prepared through the “atrane
route” [47]. This procedure combines using a cationic surfactant as
supramolecular template (and, consequently, as porogen after template
removal), and atrane-like species (complexes containing ligands derived
from TEAH3) as hydrolytic precursors both of Si and Gd. Our objective
was to preserve the well-known UVM-7 architecture [48–50] while
attaining the maximum gadolinium content homogeneously distributed
in the silica network. With this aim, we have performed two series of
syntheses. Thus, we have carried out the typical syntheses of M-UVM-7
materials in essentially aqueous media (the molar ratio of the reagents
is: (2-x) Si: x Gd: 7 TEAH3: 0.5 CTAB: 180H2O) [51–53] and, alterna
tively, we have worked under significantly more diluted conditions in
hydro-alcoholic media ((2-x) Si: x Gd: 7 TEAH3: 0.5 CTAB: y H2O: z
EtOH (180 = y ≤ 2880; 0 = z ≤ 450)). In both cases, the nominal Gd
content in the mother liquor was varied in the 25 ≤ Si/Gd ≤ 100 range.
In a typical synthesis corresponding to the Si/Gd = 50 mesoporous
material (Sample 2 in Table 1), 10.94 mL of TEOS, 25 mL of TEAH3 and
0.36 g of GdCl3.6H2O were mixed while stirring. The mixture was heated
at 140 ◦ C for 5 min until complete dissolution and homogenization
(what involves the formation of both Si and Gd atrane-like complexes).
The resulting solution was cooled to 120 ◦ C, and 4.56 g of CTAB were
added while stirring. When the temperature dropped to 85 ◦ C, 80 mL of
water were added. After a few minutes, a white suspension resulted. This
mixture was aged at room temperature for 24 h. The resulting meso
structured powder was filtered off, washed with water and ethanol, airdried and heated at 70 ◦ C for 2 h. Finally, to open the pore system, the
surfactant was removed from the as-synthesized solid by calcination at
550 ◦ C during 5 h under static air atmosphere. All the samples in this
series were prepared identically (exception made of the relative
amounts of the Si and Gd reagents). In the case of the samples prepared
in hydroalcoholic media, we have followed the same recipe until achieve
the surfactant dissolution. Then, when the temperature decreased to
60 ◦ C, we added the corresponding amounts of ethanol and water. The
aging times, under stirring at room temperature, varied from 1 to 10
days. Summarized in Table 1 are the main synthesis variables and
2.3. Materials degradation
We have made a study of the degradation of the materials by using
two different concentrations of the solids, namely 0.1 g of solid in 100
mL of PBS (0.1% m/v) and 0.02 g in 200 mL of PBS (0.01% m/v). In both
cases, we have used some conditions mimicking biological systems: T =
37 ◦ C and pH = 7.4 (provided by the PBS medium). The PBS solution was
prepared by dissolution of one PBS tablet in 200 mL of MiliQ water. This
leads to the following concentration of salts: 137 mM NaCl, 2.7 mM KCl
and 10 mM phosphate buffer solution. First of all, the samples were
sonicated in the respective suspensions for 5 min, and later were incu
bated in PBS under permanent rotation (150 rpm) by using a magnetic
stirrer. In the case of the experiments carried out using relatively high
solid proportions, the progress of the degradation process was analysed
independently after given reaction times (from 1 h to 7 days), and the
solid particles were separated by filtration. The solids were analysed by
XRD, TEM, EDX and N2 adsorption-desorption isotherms. Dealing with
the degradation process involving low solid proportions (0.1 g/L), ali
quots of ca. 5 mL were taken from the dispersions at given times (from 1
to 24 h). Here, the amount of solid sample was minimum and, conse
quently, insufficient for any characterization. In all cases, the mother
solutions were filtered (0.20 μm syringe filters) in order to remove
possible particles in suspension. The solutions were analysed by ICP -MS
to detect the solubilized species of Si and Gd.
3
M.D. Garrido et al.
Microporous and Mesoporous Materials 336 (2022) 111863
sample were obtained, and the r1 and r2 values (mM− 1 s− 1) were
calculated by taking the slope of the line of the best fit. The relaxivity is
represented as mM− 1 s− 1 ± SD (n = 5). T1-and T2-weighted images
were acquired using a rapid acquisition relaxation enhanced sequence
(RARE) with a repetition time/echo time (TR/TE) of 1500/9 ms with a
number of averages of 8 and TR/TE of 4000/18 ms with 8 averages,
respectively. The same geometry was selected for all images with 5 slices
equally distributed along the axial direction; the slice thickness was 2
mm, 10 × 10 mm field-of-view and a 256 × 256 image matrix. For the
purpose of comparison, same measurements were carried out with
commercial CA gadoterate meglumine Dotarem® (Gd-DOTA, Guerbert,
France).
2.4. Materials characterization
The Si and Gd contents were determined by energy dispersive X-ray
spectroscopy (EDX analysis) using a Scanning Electron Microscope
(Philips-SEM-XL 30). The Si/Gd molar ratio values averaged from EDX
data corresponding to ca. 50 different particles of each sample are
summarized in Table 1. Furthermore, the content of Gd has been
confirmed by ICP measurements by using an ICP-MS instrument
equipped with an Agilent 7900 mass detector. The samples were pro
cessed by cold digestion as follows: dried samples were processed in a
mixture of HF, HCl, and HNO3 in a plastic container at room tempera
ture by swirling the contents overnight until complete dissolution.
Thereafter a concentrated solution of boric acid is added to the sample.
Finally, MiliQ water is added to the mixture to obtain the desired final
weight. For electron microscopy analyses, the samples were dispersed in
ethanol and placed onto a carbon coated copper microgrid and left to
dry before observation. TEM (transmission electron microscopy) and
STEM− HAADF (scanning transmission electron microscopy− high-angle
annular dark-field) images were acquired with a JEOL-2100 F micro
scope operated at 200 kV. X-ray powder diffraction (XRD) was carried
out using a Bruker D8 Advance diffractometer equipped with a mono
chromatic CuKα source operated at 40 kV and 40 mA. Patterns were
collected in steps of 0.02◦ (2θ) over the angular range 1–10.0◦ (2θ), with
an acquisition time of 25 s per step. Additionally, XRD patterns were
recorded over a wider angular range, 10–80◦ (2θ) in order to detect the
presence of segregated crystalline phases. Nitrogen adsorptiondesorption isotherms were recorded with an automated Micromeritics
ASAP2020 instrument. Prior to the adsorption measurements, the
samples were outgassed in situ in vacuum (10− 6 Torr) at 120 ◦ C for 15 h
to remove adsorbed gases. XPS spectra were obtained with an Omicron
device equipped with an EA-125 hemispheric multichannel electron
analyser, and an Mg KKα X-ray monochromatic source with radiation
energy of 1253.6 eV. Determination of the grain size has been carried
out by using a Malvern Nanosizer ZS instrument. The analysis of the
solutions remaining after the degradation steps was performed using an
ICP-MS instrument equipped with an Agilent 7900 mass detector.
Variable-temperature (2–300 K) direct current (dc) magnetic suscepti
bility measurements under an applied magnetic field of 0.25 (T ≤ 20 K)
and 5 kOe (T > 20 K) were carried out on powdered samples with a
Quantum Design SQUID magnetometer. The magnetic data were cor
rected for the diamagnetism of the silica content of the samples and for
the sample holder.
2.6. In vitro cell viability assay
The cytotoxicity of the nanoparticles was evaluated using breast
cancer MCF-7 cells maintained in Dulbecco’s modified Eagle’s medium
(DMEM, Gibco) containing 10% fetal bovine serum (FBS), L-glutamine
(1% v/v), 100 units mL− 1 penicillin and 100 μg mL− 1 streptomycin (all
GE Healthcare-HyCloneTM) in a humidified atmosphere (37 ◦ C, 5%
CO2). MCF-7 cells were pre-grown in 96 well plates at a density of 5 ×
104 cells into each well and allowed to attach for 24 h. Gd-UVM-7 and
UVM-7 nanoparticle solutions at different concentrations (0.2, 0.4, 0.6
and 0.8 mg/mL) were prepared in DMEM previously sterilized under UV
for 60 min. Before be used, solutions were ultrasound treated in an ul
trasonic cleaning unit at a frequency of 37 kHz (60 W power effective)
and controlled temperature to 35 ◦ C for 1 h. After 24 h, the medium was
replaced by 200 μL of the nanoparticle solution at each concentration
and the cells were incubated in 5% CO2 at 37 ◦ C for 24 h. MCF-7 cells
treated only with culture media fixed as a positive control and media
only as blank. At the end of the incubation period, the volume in each
well was substituted with 200 μL of fresh media and 20 μL of 5 mg/mL
sterile filtered 3-(4,5-dimethylthiazol-2-yl)-2,5-diphenyltetrazolium
bromide (MTT) solution in PBS. The plate was incubated for additional
4 h at 37 ◦ C, allowing viable cells to metabolically reduce MTT into
purple formazan. After addition of 150 μL of dimethyl sulfoxide (DMSO)
to each well, the plate was incubated at RT for 10 min on a shaking
platform, and the absorbance of each well was measured at λ = 540 nm
using a microplate reader (Spectra Max Plus 96, Molecular Devices LLC,
CA, USA). The cell viability was calculated after correction for absor
bance with the control wells. The date is represented as % Cell viability
± SE as a function of the Gd concentration and % Cell viability =
[ODtreated – ODblank/ODcontrol – ODblank] x 100 [54]. All experi
ments were repeated 3 times for statistical analysis.
2.5. Water proton relaxivity measurement and MR imaging
The studies of the relaxation times have been performed using a
Bruker AVANCE III system equipped with a 5 mm microimaging 1H coil
operating at 600 MHz and working under very high magnetic field (14.1
T). The acquisition software used was ParaVision 6.0.1 (Bruker Biospin
GmbH, Ettlingen, Germany). Nanoparticles were dispersed in an
aqueous solution with different Gd3+ ion concentrations; 400 μL of each
sample were placed in a 5 mm high-resolution NMR tube, and homog
enous dispersion was obtained after sonication for 10 min. All samples
were subsequently used for obtaining both relaxation times measure
ments and MR imaging. The longitudinal T1 and the transverse T2
relaxation times were measured using a multi-slice multi-echo-variable
TR (MSMEVTR) sequence. A total of 64 images were acquired at 8
different echo time (TE) values equally spaced from 4.5 to 36 ms and 8
different repetition time (TR) values in the range from 250 to 2500 ms.
The parameters used for the measurements were as follows: temperature
(T) = 298 K; averages = 2; slices = 5; field of view (FOV) = 10 mm;
matrix size = 128 × 128; slice thickness = 2 mm and pixel spacing =
0.078 mm. Relaxation times (T1/T2) for each sample were measured by
fitting signal decay curves to a standard model in ParaVision 6.0.1, the
operating software for the MRI platform. Subsequently, the inverse of T1
and T2 value versus the gadolinium concentration (mM) plots for each
3. Results
3.1. Synthesis strategy
The hydrolytic reactivity of Si-alkoxides (like TEOS) and Gd salts is
markedly different, and their sol-gel processing normally leads to un
desired phase-segregation phenomena [55–57]. In order to avoid this
problem, we have used the atrane route, which has already been shown
to be useful in the synthesis of bimetallic mesoporous materials [47,
51–53]. This method is based on the idea that, both because of the
formation of atrane-like species and due to certain inertness towards
hydrolysis in TEAH3-rich media, the rates of the respective reactions of
hydrolysis and condensation of different metal or metalloid derivatives
result balanced [47]. Then, segregation is not favoured and truly mixed
oxides can be obtained without any or minimum phase segregation at
the nanoscale. As recently reported, Gd(III) and triethanolamine species
can interact showing a stepwise structural variation provided by the
progressive deprotonation of the ligand. This leads to initial dimeric
entities that can be regarded as the building blocks from which tetramer
and hexamer units can be constructed [58–60]. In fact, we have
observed that Gd2O3, highly insoluble in water, dissolves easily in the
4
M.D. Garrido et al.
Microporous and Mesoporous Materials 336 (2022) 111863
presence of TEAH3. Also, the processing of mixtures of rare-earth ele
ments in rich-TEAH3 media to form mixed oxides was described long
time ago [61]. In any case, to slow down the hydrolysis of the Gd species,
we have performed the syntheses using hydroalcoholic media (involving
ethanol as co-solvent) too.
Regardless of the solvent used (either water or ethanol:water mix
tures) and the nominal Si/Gd ratio, in all cases the final materials
(Table 1) show a relatively high Gd content. That is, Si/Gd molar ratios
determined by EDX (hereinafter real values) are smaller than the stoi
chiometric values added in the synthesis (hereinafter nominal values).
This trend is also confirmed by ICP analysis (Table 1). If we consider that
the materials can be described as mixtures of SiO2 and Gd2O3 oxides, it is
well known that the solubility of SiO2 is much greater than that of Gd2O3
(Kps = 1.8 × 10− 23) [62,63]. Then, the Gd enrichment can be assigned to
a partial silica dissolution [62].
In the samples synthesized in aqueous media (Samples 1 to 5), we
have observed that the Gd-rich Sample 3 (Si/Gd = 25 nominal molar
ratio) results in loss of the UVM-7 structure due to the significant growth
of the particle size despite the maintenance of the mesostructured nature
(Fig. S1). Conversely, the UVM-7 morphology is preserved (see below)
for Samples 1 (Si/Gd = 100 nominal molar ratio) and 2, 4 and 5 (Si/Gd
= 50 nominal molar ratio) regardless their real (final) Gd content. The
progressive enrichment in Gd with the water amount in the media
(Samples 2, 4 and 5) must be associated to the silica solubility [62].
Dealing with the materials synthesized in ethanol: water media
(Samples 6 to 10), we have observed (see below) that as the ethanol
proportion increases, the order in the porous structure diminishes. The
typical (100) signal of the XRD patterns tends to disappear and the BET
surface area diminish in a marked way (Table 1). In fact, Sample 10
losses the UVM-7 organization (Fig. S2). The progressive difficulty in
stabilizing the mesostructure in the presence of relatively large pro
portions of ethanol must be related to a mismatch in the self-assembling
processes of the inorganic oligomers and the CTAB surfactant micelles. It
is well known that surfactants of this type are highly soluble in ethanol
[64]. Indeed, the cmc value of the CTAB surfactant grows as the relative
amount of ethanol increases [65]. For molar ratios Si/EtOH ≤100, the
proportion of stabilized micelles decreases, making it difficult to
establish a suitable fit with the inorganic counterparts through S+I−
interactions. Thus, the optimum proportion of the molar ratio of the
reagents (in order to get our objectives) is as follows: 2 (Si + Gd): 7
TEAH3: 0.5 CTAB: 200 EtOH: 1000H2O.
Finally, the last variable we have explored in this series is the aging
time. With respect to the chemical composition of the final materials, the
resulting real Si/Gd molar ratios are very similar after aging times of 1 or
10 days at room temperature. There are also no significant differences
regarding the organization at mesoscopic scale. However, we have
observed that the final materials are more easily dispersible in aqueous
media as the aging time increases (see below). This aspect is important
when considering biomedical applications. Then, in accordance with
our objectives (preserve the UVM-7 architecture while attaining the
maximum gadolinium content in the silica network), the data in Table 1
suggest that the optimum molar ratio of the reagents is around 1.96 Si:
0.04 Gd: 7 TEAH3: 0.5 CTAB: 1000H2O: 200 EtOH, what corresponds to
Samples 6 and 7.
Fig. 1. Low-angle XRD patterns of samples synthesized (a) without ethanol
(Samples 1 to 5) and (b) with ethanol (Samples 6 to 9) [in the reac
tion medium].
enrichment in Gd independently of the reaction medium. The values of
Gd% (wt) determined by ICP are in reasonable agreement with those
estimated by EDX with the exception of the two materials richest in Gd
(Samples 8 and 10) that are far from the UVM-7 type architecture. These
samples, with less order and porosity and a more massive nature (see
below), show a higher Gd content determined by ICP than those deter
mined by EDX. In any case, and regardless the final morphology, this fact
indicates a preferential incorporation of Gd into the final silica network
due to the gadolinium oxide insolubility. Excluding incipient impreg
nation, our “one pot” procedure has allowed us to insert Gd amounts in
the silica net higher than those previously reported in the literature,
reaching 11.8% (by weight, with respect to silica determined from EDX)
in aqueous medium (Sample 5; Si/Gd = 19) and 16.3% in hydro
alcoholic medium (Sample 7; Si/Gd = 13), while maintaining the UVM7 architecture. Similar values have been determined by ICP: 12.2 and
16.1% for Samples 5 and 7, respectively. Specifically, regarding “one
pot” strategies, we have managed to significantly increase the maximum
value reported by Lin et al. (6.8%), who also used GdCl3.6H2O as Gd
source in aqueous medium [42]. This achievement is a consequence of
the harmonization among the reaction rates of the hydrolytic processes
involving the Si and Gd species that provides the atrane route.
On the other hand, the complete absence of XRD peaks in the highangle domain (Fig. S3) allows us to discard the existence of ordered
large domains of Gd2O3, Gd-silicates or any other crystalline phase
(although the existence of related nanodomains smaller than 5 nm
cannot be rejected) [66]. Hence, the final solids can be considered as
monophasic products, and segregation of crystalline Gd2O3 can be
practically discarded even for the samples having the highest Gd
3.2. Chemical and mesostructural characterization
We have used EDX and ICP to assess both the stoichiometry and the
chemical homogeneity of the samples, given that an important objective
of our work is to favour also a good dispersion of Gd into the inorganic
silica-based walls of the resulting materials. The real Si/Gd molar ratio
are summarized in Table 1. EDX data show that all the reported mate
rials are chemically homogeneous at the spot area scale (ca. 1 μm). As
commented above, in the entire compositional (nominal) range studied
(∞ ≥ Si/Gd ≥ 25), the value of the Si/Gd molar ratio in the final solid
decreases with respect to that in the mother solution, what indicates an
5
M.D. Garrido et al.
Microporous and Mesoporous Materials 336 (2022) 111863
Fig. 2. Representative TEM images of Gd-UVM-7 materials. (a) Sample 2, (b) Sample 4, (c) Sample 6 and (d) Sample 7.
contents (even though, probably, the formation of Gd2O3-like clusters
should progress with the Gd content).
Exception made of the solid synthesized with the higher ethanol
proportion (Sample 10), all the remaining materials display XRD pat
terns with diffraction peaks in the low-angle regime (Fig. 1). This in
dicates the stabilization of self-assembled mesostructures. In the case of
the mesoporous solids synthesized in the absence of ethanol (Samples
1–5), the low-angle region of the XRD patterns displays, apart from the
intense peak at low 2θ values (associated with the (100) reflection if a
basic hexagonal cell is assumed), a broad signal or shoulder of relatively
low intensity that can be indexed to the overlapped (110) and (200)
reflections of the typical hexagonal cell. The observation of this last
unresolved broad signal is characteristic of a MCM-41-like disordered
hexagonal (intra-particle) mesopore topology. In the case of the samples
isolated in hydroalcoholic media (Samples 6–9), although the (100)
intense peaks at low angle values also appear in the corresponding XRD
patterns, their fwhm (full width at half maximum) values increase when
compared to those of the peaks corresponding to Samples 1–5. More
over, the shoulder assigned to the (110) and (200) overlapped re
flections practically disappears, which suggests a relative loss of order of
the intra-particle mesopore array [48–50]. Also, as the ethanol propor
tion increases, the intensity of the (100) signal decreases, which is
obvious in the case of Sample 9 (and culminates with its disappearance
in the pattern of Sample 10 (Fig. S2)).
On the other hand, when we start from a relatively high nominal Gd
content (Si/Gd = 25, Sample 8), the use of a hydro-alcoholic medium
does not allow the recovery of the UVM-7 morphology. Then, as occurs
for the samples isolated in aqueous medium, the UVM-7 architecture is
lost for Sample 8 (Fig. S4). Then, as occurs with the samples isolated in
aqueous medium, the UVM-7 architecture is lost for Sample 8 according
to TEM images (Fig. S4) and XRD data (the intensity of the (100) signal
practically disappears) (Fig. 1b). The pronounced loss of UVM-7
morphology leads to solids with greater aggregation and a more
massive nature. In these cases, and also due to the greater insolubility of
the Gd species, it could be reside the origin of the discrepancies between
the ICP and EDX measurements: the former inform us of the average
composition of the material while the EDX values inform us of the Gd
content closest to the surface. In the case of Gd-UVM-7 materials made
up of nanoparticles, the differences can be expected to be minimal or
null, according to our experimental results (Table 1).
The d100 spacing peak and the lattice parameter value slowly
decrease with the Gd content (Samples 1 to 3, synthesized in the absence
of ethanol). This cell expansion probably is due to the replacement of Si
atoms with Gd ones. On the other hand, for an identical Si/Gd = 50
nominal molar ratio (and similar real Gd contents in the 13 to 19 Si/Gd
range), there is not an appraisable effect of the ethanol proportion and
the reaction time on the d100 spacing value. Indeed, a very similar value
around 4 nm is measured for Samples 6, 7 and 9. What is appreciated is a
decrease in the spacing value with the incorporation of ethanol into the
reaction medium, from ca. 4.3–4.8 (Samples 1, 2 and 3) to 4 nm
(Samples 6, 7 and 9). This evolution suggests either a decrease in the
thickness of the inorganic wall or the size of the mesopore.
The TEM images in Fig. 2 clearly show that the UVM-7-like archi
tecture is preserved for real Si/Gd molar ratios higher that ca. 13, this
value implying a high hetero-element content. In this real compositional
range (∞ ≥ Si/Gd ≥ 13), all the solids present a continuous nanometric
array constructed from aggregates of mesoporous nanoparticles.
Although certain pseudosphericity and nanoparticle size homoge
neity is lost when compared to the pure silica material due to Gd
incorporation, we can consider that the UVM-7 architecture is
6
M.D. Garrido et al.
Microporous and Mesoporous Materials 336 (2022) 111863
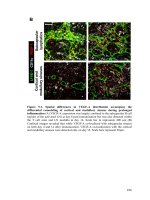
the dispersion of Si and Gd has been studied by spherical aberration (Cs)
corrected scanning transmission electron microscopy high-angle
annular dark field (STEM-HAADF). The mappings of selected samples
are included in Figs. 4 and 5. Rich-Gd zones are not detected. There is a
regular and homogeneous distribution of both elements. The effect of
the Gd content is clearly appreciated in Fig. 4 (b, c, e, f, h, i), which
includes the Si and Gd distribution in Samples 1, 2 and 4. The homo
geneous and regular dispersion of both elements does not seem to be
affected by changes in their relative concentrations. As shown in Fig. 5
(b, c, e, f), such a good dispersion of the elements is also attained for
samples isolated in water: ethanol media (Samples 7 and 9) having a
similar Gd content. At this point, all data unambiguously confirm the
absence of phase segregation even at the nanoscale. Then, all suggests a
truly regular nanodispersion of Gd in the net, either replacing Si atoms
in isolated sites or in the form of small Gd-containing oligomers.
The materials porosity was further characterized by N2 adsorptiondesorption isotherms (Fig. 6, Table 1). The bimodal pore system
typical of nanoparticulated UVM-7 silicas is maintained in the Gd-UVM7 materials whose real Si/Gd molar ratios are comprised in the ranges ∞
≥ Si/Gd ≥ 26 (solids synthesized in the absence of ethanol) or ∞ ≥ Si/
Gd ≥ 13 (solids synthesized in presence of ethanol). The first adsorption
step, at intermediate partial pressures (0.3 < P/P0 < 0.5), is due to the
capillary condensation of N2 inside the intra-nanoparticle mesopores.
The second step, at a high relative pressure (P/P0 > 0.8), corresponds to
the filling of the large inter-particle cage-like pores. In the series of solids
prepared in the absence of ethanol, all the textural parameters (BET
surface area, pore sizes and pore volumes) decreases as the Gd content
increases. However, while this variation is not very great between
Samples 1 and 2, in the case of Sample 3 all the parameters decrease
abruptly, and, what is more relevant, the textural porosity disappears.
Perhaps the main difference between the two families of materials is
the BJH mesopore sizes. These range from 2.45 to 2.64 nm and from
2.95 to 3.16 nm for the samples isolated with and without ethanol as cosolvent, respectively. This intra-particle mesopore size variation is
probably the origin of the d100 decrease detected from the XRD patterns,
and can be due to changes in the nature of the micelles caused by the
solvent. This effect was previously described for pure UVM-7 silicas
[48].
Due to the interest of these materials as MR CA, the degree of ag
gregation and the mean grain size of the particle-clusters have been
studied using DLS. As it is well known, the UVM-7 architecture implies a
significant inter-particle condensation degree [48–53]. The effect of
ultrasound protocols on the dispersion level has been analysed (Fig. S5).
When subjected to a simply treatment in an ultrasounds bath during
some minutes, the original UVM-7 silica shows wide particle size dis
tributions in the micrometric range. By applying more vigorous treat
ments (by using a Branson Sonifier 450 instrument), a significant grain
size decrease until ca. 350 nm can be achieved. Similar results are ob
tained in the case of Samples processed in water rich media (without
ethanol). However, we have observed that, by using strictly the same
ultrasounds treatment, the disaggregation of samples aged in rich
ethanol media can be significantly improved up to average grain sizes
around 100 nm. The solid after sonication post-treatment continues to
retain its bimodal pore system. On the other hand, ICP-MS measure
ments of Si concentration in supernatant solution justly after sonication
are very low (ca. 1–2 ppm), indicating that a negligible dissolution of the
solid occurs during the post-treatment. Then, we can conclude that the
effect of the ethanol in the reaction medium is not limited to favouring
the incorporation of Gd to the network, but also contributes to
improving the dispersibility of the final material.
Fig. 3. HRTEM images of (a) Sample 2 and (b) Sample 7.
preserved. This array includes two different pore systems: (1) the first
one is due to the porogen effect of the surfactant micelles, which gen
erates the small intra-particle regular mesopores organized in a disor
dered hexagonal arrangement, and (2) the second one consists of large
cage-like inter-particle voids appearing as consequence of the primary
nanoparticle aggregation.
Qualitatively, there is no difference among the TEM images of the
solids prepared with or without ethanol. However, two details should be
mentioned: 1) the average size of the primary particles is smaller for the
samples prepared in hydroalcoholic media (ca. 40–60 nm for samples 1,
2, 4, 5 and ca. 20–30 nm for samples 6, 7, 9), and 2) the presence of
ethanol in the reaction medium leads to a relatively minor inter-particle
aggregation. Both trends are in accordance with the synthesis condi
tions. Indeed, it can be expected that the hydrolysis and condensation
processes will be favoured as the water content increases. Dark spots
that could be attributed to Gd2O3 nanodomains are not observed in any
case (even in HRTEM images (Fig. 3)).
In the same way, the STEM-HAADF images (Figs. 4 and 5) show the
absence of bright spots associated to Gd-rich domains. A homogeneous
and continuous bright is observed throughout the entire mass of the
samples both in the case of samples isolated in water (Fig. 4a, d and 4g)
and those prepared in water: ethanol media (Fig. 5a and d). In addition,
3.3. Characterization of the Gd organization in the materials
The direct current (dc) magnetic properties of the synthesized ma
terials are compared with those of Gd2O3 bulk material in Fig. 7. Our
objective at this point is to understand how the Gd atoms are dispersed
7
M.D. Garrido et al.
Microporous and Mesoporous Materials 336 (2022) 111863
Fig. 4. STEM-HAADF images and mapping showing the Si and Gd distribution of (a, b, c) Sample 1, (d, e, f) Sample 2 and (h, i, j) Sample 4.
throughout the silica-based walls. In order to compare with the Gd2O3
reference sample, we have selected the two Gd-richest materials: Sam
ples 7 and 8 (which preserve the intra-particle mesopore system ac
cording to XRD and porosimetry data), although, as commented above,
the large particle size in the case of Sample 8 does not allow considering
it as UVM-7 type. The χmT vs. T plots (χm being the dc magnetic sus
ceptibility per g of sample and T the absolute temperature) for Samples 7
and 8 are qualitatively similar. χmT remains constant from room tem
perature until around 20 K, with χmT values of 0.62 × 10− 2 and 2.31 ×
10− 2 cm3 g− 1 K (for Samples 7 and 8, respectively), and then it decreases
slowly down to 0.31 × 10− 2 and 1.17 × 10− 2 cm3 g− 1 K at 2 K (Fig. 7a).
In contrast, χmT continuously decreases upon cooling for the Gd2O3 bulk
material, with χmT values varying from 4.31 × 10− 2 cm3 g− 1 K at room
temperature down to 0.47 × 10− 2 cm3 g− 1 K at 2 K, although there is no
long-range antiferromagnetic order, as revealed by the absence of a
maximum in the χm vs. T plot (data not shown). These smaller deviations
from the Curie law for the Samples 7 and 8 relative to the bulk material
support the absence of Gd2O3 particles of nanometric size grown during
the aggregation process. Hence, the 1/χm vs. T plots for the for Samples 7
and 8 show a typical linear Curie-Weiss law behaviour with a similar
negative value of the Weiss temperature around − 2 K, estimated from
the interception with the T axis, which is diverse and rather smaller (in
absolute value) than that of ca. − 18 K for the bulk Gd2O3 material
(Fig. 7b) [67].
The molar magnetic susceptibility of the bulk material was first
analysed through the Curie-Weiss law (eq. (1)), where g is the isotropic
Land´
e factor of the GdIII ion (S = 7/2) and θ is the Weiss temperature,
while N is the Avogadro number, β is the Bohr magneton, and kB is the
Boltzman constant. The least-squares fit of the experimental data lead to
g = 2.056(2) and θ = − 17.9(1) K with F = 1.8 × 10− 6 (F is the agreement
∑
∑
factor defined as F =
[(χMT)exp – (χMT)calcd]2/ [(χMT)exp]2). The
mass magnetic susceptibility of the Samples 7 and 8 was then analysed
through a modified Curie-Weiss law (eq. (2)), which includes the α
variable that takes into account the Gd mass loading for each sample
(expressed as g of Gd per g of sample), where MW(Gd) is the gadolinium
atomic weight [MW(Gd) = 157.25]. The least-squares fits of the
experimental data, with a fixed g value taken from the fit of the exper
imental data of the bulk material (g = 2.056), lead to θ = 2.02(1)/–2.04
(1) K (Sample 7/Sample 8) and α = 0.1185(1)/0.4384(1) (Sample 7/
Sample 8) with F = 0.1/0.3 × 10− 6 (Sample 7/Sample 8). The
8
M.D. Garrido et al.
Microporous and Mesoporous Materials 336 (2022) 111863
Fig. 5. STEM-HAADF images and mapping showing the Si and Gd distribution of (a, b, c) Sample 7 and (d, e, f) Sample 9.
theoretical curves reproduce rather well the experimental data in all the
temperature range (solid lines in Fig. 7a and b). Within a simple mo
lecular field model, the Weiss temperature can be expressed by eq. (3)
[68,69], where j is the effective magnetic coupling parameter and z is
the number of next neighbours around each GdIII ion, so that –zj = 2.37
(1) cm− 1 for the bulk material while –zj = 0.267(1)/0.270(1) cm− 1
(Sample 7/Sample 8).
χM = (N β2 g2/3kB)S(S + 1)/(T – Ɵ)
(1)
χm = [α/MW(Gd)](N β g /3kB)S(S + 1)/(T – Ɵ)
(2)
Ɵ = (zj/3kB)S(S + 1)
(3)
2
2
corresponding mixed Gd-Y-UVM-7 nano-composites. In fact, the
diamagnetic rare earth yttrium(III) ion is commonly used in solid dilu
tion experiments of paramagnetic gadolinium(III)-based materials
because Y3+ and Gd3+ ions have similar ionic radii due to the wellknown lanthanide contraction phenomenon. Hence, the χmT vs. T
plots for the diluted Gd10/Y90 and Gd1/Y99 samples are qualitatively
similar. χMT remains constant from room temperature until around 5 K,
with χMT values of 3.04/0.41 × 10− 4 cm3 g− 1 K (Gd10Y90/Gd1Y99),
and then it slightly decreases down to 2.52/0.34 × 10− 4 cm3 g− 1 K
(Gd10Y90/Gd1Y99) at 2 K (inset of Fig. 7a). These very small deviations
from the Curie law for the diluted Gd10/Y90 and Gd1/Y99 samples
relative to the parent Gd-UVM-7 samples are as expected because of the
weaker next nearest-neighbour antiferromagnetic interactions (when
compared to the stronger nearest-neighbour antiferromagnetic in
teractions across the oxo bridges within the Gdn clusters) between the
magnetically isotropic GdIII ions (S = 7/2) through the diamagnetic YIII
ions (S = 0) within the oxo-bridged (GdyY1-y)n clusters,. In fact, the 1/χm
vs. T plots for the diluted Gd10Y90 and Gd1Y99 samples show a linear
Curie-Weiss law behaviour with a very small (if not negligible) negative
value of the Weiss temperature around − 0.5 K, which is characteristic of
almost magnetically isolated GdIII ions (inset of Fig. 7b).
The least-squares fits of the experimental mass magnetic suscepti
bility data for the diluted Gd10Y90 and Gd1Y99 samples through the
modified Curie-Weiss law (eq. (2), with g = 2.056), lead to θ = − 0.42
(1)/0.47(1) K (Gd10Y90/Gd1Y99) and α = 0.00587(1)/0.000790(1)
(Gd10Y90/Gd1Y99) with F = 0.4/0.2 × 10− 10 (Gd10Y90/Gd1Y99), so
that –zj = 0.056(1)/0.062(1) cm− 1 (Gd10Y90/Gd1Y99). The theoretical
curves reproduce perfectly well the experimental data in the lowtemperature region (solid lines in the insets of Fig. 7a and b). Indeed,
the calculated values of the Gd mass loading amount of 0.587 and
0.079% for Gd10Y90 and Gd1Y99, respectively, agree rather well with
those expected upon 1:10 and 1:100 Gd/Y dilution. Otherwise, the
similarity between the calculated –zj values for the two mixed Gd-YUVM-7 nanocomposites, regardless of the paramagnetic metal dilution
This almost ten-fold decrease of the magnetic coupling between the
GdIII ions across the oxo bridges from the bulk material to the corre
sponding Samples 7 and 8 is likely associated to the formation of small
oligonuclear oxo-bridged Gdn clusters of finite size, not reaching the
Gd2O3 nanoparticle size domain, as reported earlier for the aggregation
of magnetic gadolinium(III) oxide nanoparticles under different condi
tions. The calculated values of the Gd mass loading amount of 12% and
43% for Samples 7 and 8, respectively, roughly agree with those
calculated from ICP (16.1 and 37.5% for Samples 7 and 8, respectively).
In the case of the EDX measurements, the agreement is maintained for
Sample 7 but a greater discrepancy occurs for Sample 8. Thus, as pre
viously discussed, for a SiO2.(n/2)Gd2O3 general formula with 1/x = Si/
Gd = 13 and 6 for Samples 7 and 8 [α = xMW(Gd)/MW(SiO2.(x/2)
Gd2O3) = 157.25x/(60 + 181.25x)] α values of 16.3 and 29.1% are
determined, respectively. In this respect, the similarity between the
calculated –zj values for the two gadolinium-silica nanocomposites,
regardless of the Gd mass loading amount (and even for samples with
different morphology), is consistent with a similar average nuclearity of
the small oligonuclear oxo-bridged Gdn clusters and they only differ in
their concentration.
On the other hand, the effect of the paramagnetic metal dilution on
the dc magnetic properties has also been investigated in the
9
M.D. Garrido et al.
Microporous and Mesoporous Materials 336 (2022) 111863
Fig. 6. N2 adsorption-desorption isotherms of samples synthesized (a) without
ethanol (Samples 1 to 5) and (b) with ethanol (Samples 6 to 9) [in the reac
tion medium].
amount, is consistent with almost magnetically isolated GdIII ions.
Hence, the observed very small Curie law deviations can be explained by
the ligand-field zero-field splitting (zfs) effects associated with the very
weak, but non-negligible, local magnetic anisotropy of the GdIII ions.
Then a maximum rough limit of the Gdn oxo clusters nuclearity can be
established that corresponds to n = 10. This maximum value is in
accordance with the previously commented nuclearity for the Gd-atrane
complexes.
On the other hand, when compared the XPS spectra of selected GdUVM-7 samples with the pure silica parent and Gd2O3 as references
(Fig. S6), it is evident the absence of large Gd2O3 nanodomains [70]. The
Gd 3d5/2 peak is shifted towards low binding energy values as the Gd
content decreases while the Si 2p XPS peak remains practically
un-changed and centred at 103.4 eV. The presence of shoulder in the
XPS O 1s band could be likely attributed to Gd-O-Si bridges.
Fig. 7. Temperature dependences of χ mT (a) and 1/χ m (b) for Samples 7 and 8
compared with those for the bulk material Gd2O3. The inset shows the tem
perature dependences of χ mT (a) and 1/χ m (b) for the gadolinium(III)-yttrium
(III)/UVM-7 nanocomposites, Samples 11 and 12. The solid lines are the
best-fit curves (see text).
with a r1 value of 2.89 mM− 1s− 1 also measured at 14.1 T. In contrast,
our Gd–Si nanoparticles presented 29 times higher transversal relaxivity
value than that corresponding to the commercial CA (r2 = 4.12
mM− 1s− 1). Most interestingly, the r2 relaxivity values of Sample 7 are
also higher than those described for other Gd-doped mesoporous silicas
[42,46]. When comparing the relaxivity of the synthesized Gd-UVM-7
mesoporous material (Sample 7) with an ordered porous silicate mate
rial as reported by Lin et al. [42] (6.8 wt% Gd and measured at 9 T), the
selected nanoparticulate Gd-UVM-7 presented 1.5 times higher r2 value,
probably due to our higher Gd content (which is achieved thanks to the
use of the atrane method).
The apparently low longitudinal relaxivity, despite the high gado
linium content, may be understood as the consequence of two major
factors: a large payload of Gd3+ centres incorporated into the meso
porous silica matrix, and the use of a very high magnetic field (14.1 T)
for the material characterization [39,40]. The T1 relaxivity of molecular
Gd3+ compounds typically decrease as the magnetic field increases [71].
The effect of the magnetic field on relaxation is more marked for slowly
3.4. Magnetic resonance imaging under high magnetic fields
Having into mind the objective of developing novel Gd doped silica
nanoparticles as MR CA, the proton longitudinal and transverse relax
ivities, r1 and r2, were determined at 14.1 T for Sample 7. MRI relaxivity
as a function of Gd(III) concentration is shown in Fig. 11. Gadoliniumsilica nanoparticles presented a r1 value of 1.24 mM− 1s− 1 and r2
value of 120.4 mM− 1s− 1 at room temperature. Longitudinal relaxivity is
lower than a commercial standard Gd-DOTA contrast agent Dotarem®
10
M.D. Garrido et al.
Microporous and Mesoporous Materials 336 (2022) 111863
Fig. 8. TEM images of Sample 7 after degradation in
PBS during (a) 8 h and (b) 120 h. The inset in Fig. 8a
and the yellow arrows show the presence of GdPO4
elongated crystals. Graphics (c) and (d) show the
evolution with degradation time of the low-angle and
high-angle XRD patterns, respectively. The vertical
dotted lines in figure (d) correspond to the position of
the principal XRD peaks for the GdPO4 (according to
the JCPDS card number 320386). (For interpretation
of the references to colour in this figure legend, the
reader is referred to the Web version of this article.)
rotating molecules than for rapidly rotating molecules [72]. Thus, small
molecules such as Gd-DOTA show a restricted decrease in r1 with higher
magnetic fields. On the contrary, a greater decrease in r1 can be ex
pected for the less mobile gadolinium centres inserted in siliceous par
ticles. On the other hand, the transverse relaxivity was also found to
depend on the concentration of gadolinium content. In a detailed work
by Liu et al. observed that the transverse relaxivity reached an optimum
value at 1.8 atomic percent gadolinium doping for their disordered
gadolinosilicate [46]. Further increase of gadolinium doping resulted in
a decrease in transverse relaxivity [46]. It has also been described a
field-dependent behaviour in the r2 values. The r2 values are static or
increase in the presence of higher field strength [72,73]. Yeh et al. [74]
established that a field-dependent transversal relaxivity intensify may be
explained by the chemical exchange model as proposed by Brook et al.
[75]. The chemical exchange model is restricted to weakly magnetized
particles in strong fields, for which magnetic susceptibility result asso
ciated with a magnetized centre is prevailing.
In short, the high content of Gd, its homogeneous distribution in the
form of small oligomers, the easy accessibility of the water molecules
through the bimodal porous system and especially the use of very high
magnetic fields, are parameters consistent with the low r1 and relatively
high r2 relaxivity values achieved.
bioavailability and are excreted through the urine. The biocompatibility
of silica and its degradation by-products accounts for their generally
recognized safety. We have performed two series of degradation ex
periments in PBS medium (see Experimental section). In the first one, we
have used a relatively high concentration of the material (1 g of mate
rial/L of solution) in order to brake the dissolution rate (simply by
working upon the saturation limit). This long-term experiment allows us
to analyse in detail how the silica degradation starts. On the other hand,
the second short-term series has been carried out under dilution con
ditions similar to those occurring in biological systems (0.1 g of mate
rial/L of solution). We have selected the Sample 7 for the degradation
study due to their magnetic properties and excellent dispersibility.
Although the typical aggregation of primary particles is preserved
(TEM) even after 5 days, the hexagonal intra-particle mesostructure,
detected through XRD, rapidly disappears (after 3 h) (Fig. 8). As time
progresses, TEM images show a certain reduction in the particle size
together with a lower definition of the mesopore white spots. Both
factors contribute to the loss of the low-angle XRD signals. The evolution
of the N2 adsorption-desorption isotherms allows to monitor the
degradation process in a more quantitative way. Thus, it can be appre
ciated a gradual decrease in both the BET surface area and the intra
particle BJH pore volume (Table S2).
Apparently, a certain degradation/dissolution also occurs in the
inner walls. This lead to an increases of the BJH intraparticle mesopore
size and a less homogeneous pore size distribution. In fact, the maximum
in the pore distribution analysis disappears for degradation times higher
than 8 h. Parallel to the degradation of the mesostructure, broad signals
of low intensity begin to appear in the high-angle XRD patterns after
only 3 h (Fig. 8d). These new peaks can be unambiguously attributed to
a GdPO4 crystalline phase (PBS acts as source of phosphate). This fact is
in accordance with the EDX data, which show a quick increase in the
gadolinium content (from Si/Gd = 13 to Si/Gd in the 8–9 range), and the
detection of P as new element in our solid samples (Table S2). This can
3.5. Nanomaterial behaviour in biological fluids and citotoxicity
Degradation and clearance are the final steps of nanomedicines after
actuation. Usually we think in mesoporous silicas as stable and robust
supports. However, reality is far from it. Without an external particle
protection, which is normally provided by an adequate functionalization
using organic species, the silica degradation and dissolution occurs,
especially under circumneutral and basic pH conditions. Silica is un
stable in water and dissolves to give silicic acid species (Si(OH)4 is the
dominant species at low con-centration), which have an excellent
11
M.D. Garrido et al.
Microporous and Mesoporous Materials 336 (2022) 111863
Fig. 9. Evolution of the concentrations in the supernatant solutions of (a) sil
icon and (b) gadolinium over time during the degradation experiment carried
out under conditions of higher concentration.
Fig. 10. Evolution of the concentrations in the supernatant solutions of (a)
silicon and (b) gadolinium over time during the degradation experiment carried
out under diluted conditions.
be related to the easy partial dissolution of the silica and the favoured
precipitation of GdPO4. The evolution with time of the Si and Gd con
centrations in the supernatant solutions is in good agreement with these
observations (Fig. 9).
Indeed, occurs a rapid increase of the Si concentration in the solution
during the first hours (up to 107 mg/L), and then it stabilizes at a lower
value (ca. 75 mg/L). The peak is very close to the maximum silica sol
ubility in water at neutral pH and ambient temperature: 120 mg/L [62]
(with small deviations from this value in the T range between 20 and
50 ◦ C [76] and circumneutral pH values [77]). Yet, this saturation level
may be altered by the presence of solubilizing agents in the solution as
for example the PBS. In fact, similar values to the here described, slightly
higher than 100 mg/L, has been reported working in PBS at pH = 7.4
and 37 ◦ C [78]. The evolution of solubility vs time in our case suggests a
partial reprecipitation of silica oligomers in the period of time between 3
and 8 h. On the contrary, the variation of the Gd concentration over time
present a sigmoidal tendency, with a low dissolution rate during the first
hours, and practically negligible after 3 h of incubation.
Very likely, it is necessary certain initial silica elimination before an
appreciable amount of Gd can be detected. Then, the aging of the sample
should favour some silica coating (from the Si-olygomers) of the whole
material with the subsequent trapping of the more insoluble Gd-rich
domains. Moreover, according to the XRD results, a proportion of the
Gd precipitates with phosphate anions. In fact, TEM images show,
together with the partially degraded Gd-UVM-7 aggregates, the forma
tion of elongated nanocrystals (with dimensions of ca. 5 × 15 nm) that
probably correspond to the GdPO4 (Fig. 8a and b). These reduced di
mensions are in agreement with the low intensity and the large fwhm
values observed in the XRD patterns.
The short-time experiment, with conditions similar to the application
of the material in biological media, shows that the silica degradation is
practically completed after incubations of ca. 5 h (Fig. 10). This quick
silica dissolution favours a massive leaching of the Gd-based oligomers.
Then, the [Gd] in solution quickly increases before its precipitation as
GdPO4, which qualitatively explain the curve tendency. While the final
concentration of Si in solution is very different for both series (ca. 75 and
45 ppm for experiments performed under high and low concentration
conditions, respectively), this is similar in the case of Gd (in the 0.7–0.9
μg/L range), which seems be controlled by the formation of highly
insoluble phosphate. Then, when working under concentrations
mimicking those that take place in biological systems, the final degra
dation products are solubilized silica oligomers and GdPO4
nanoparticles.
Finally, in order to validate the cytocompatibility of the nano
materials in a biological environment, cell viability was assessed 24 h
after incubation of MCF-7 cells with UVM-7 and Gd-UVM-7 (Sample 7)
nanoparticles at a range of different particle concentrations (200, 400,
600, 800 μg mL− 1). MTT assay showed (Fig. 12) cell viability was always
more than 95% of the untreated cells control even at maximum particle
concentration. The results did not indicate significant changes in the cell
viability for both of the tested materials at the studied concentrations,
indicating no evidence of that both UVM-7 and Gd-UVM7 nanoparticles
12
M.D. Garrido et al.
Microporous and Mesoporous Materials 336 (2022) 111863
suspensions of GdPO4 [79]. Thus, M. Yon et al. [80] suggest that the use
of inorganic nanoparticles instead of Gd complexes strengthens the
stability of Gd within the formed nanoparticles and thus limits the
release of Gd3+ ions.
4. Conclusions
Our preparative strategy, based on the atrane route, has allowed to
isolate potential theranostic materials based on bimodal porous silicas
with the highest gadolinium content, as far as we known, reported up to
date in the bibliography. This method prevents the phase segregation
even at the nanoscale. Then, according to HRTEM, STEM-HAADF and
EDX, the Gd sites result extremely well dispersed along the inorganic
silica-based walls. Additionally, the dispersion at molecular level has
been proved through magnetic measurements. In fact, a maximum
nuclearity of ca. 10 Gd/cluster is calculated. We studied the material
degradation in PBS solution at 37 ◦ C. After a few hours, the solid evolves
until dissolution of the silica in the form of small olygomers and the Gdcounterpart generate small GdPO4 nanoparticles. No toxicity has been
detected in vitro. The high Gd concentration together the coating of the
Gd-clusters by silica and the use of ultrahigh magnetic fields confers
these Gd-UVM-7 solids good characteristics to act as CA in MRM for
diagnostic with a remarkable increase of the T2 relaxivity when
compared to others CA, including the molecules in use in medical
practice. That enhanced T2 contrast effect and the water-permeable
nature of its 3D nanosized matrix, makes Gd-UVM-7 material an excel
lent candidate for clinical imaging in a multitude of medical applications
and as a member of a new-generation MRI CAs where very few dedicated
agents have been reported.
CRediT authorship contribution statement
M. Dolores Garrido: Conceptualization, Formal analysis, Method
ology, Investigation. Nuria Puchol: Formal analysis, Investigation,
Methodology. Jamal El Haskouri: Writing – original draft, Methodol
ogy, Investigation, Formal analysis, Writing – review & editing. Juan
´nchez-Royo: Formal analysis, Investigation, Methodol
Francisco Sa
´ Vicente Folgado: Methodology, Investigation, Formal anal
ogy. Jose
ysis. Vannina Gonzalez Marrachelli: Formal analysis, Investigation,
´rez Terol: Writing – original draft. Jose
´ Vicente
Methodology. Itziar Pe
Ros-Lis: Conceptualization, Funding acquisition, Project administra
tion, Supervision, Validation, Writing – original draft, Writing – review
& editing. M. Dolores Marcos: Investigation, Formal analysis, Meth
odology. Rafael Ruíz: Formal analysis, Investigation, Methodology.
´n: Writing – review & editing, Writing – original draft,
Aurelio Beltra
´ Manuel Morales: Formal analysis, Investigation,
Validation. Jose
´ s: Conceptualization, Project
Methodology, Validation. Pedro Amoro
administration, Funding acquisition, Validation, Writing – original
draft, Writing – review & editing, Supervision.
Fig. 11. The proton relaxivities, (a) r1 and (b) r2, determined at 600 MHz at
room temperature for Sample 7 aqueous suspensions measured at 14.1 T.
Declaration of competing interest
The authors declare that they have no known competing financial
interests or personal relationships that could have appeared to influence
the work reported in this paper.
Fig. 12. Cell viability values estimated by the MTT assay, which was performed
by treating MCF-7 cells with different concentrations of the Sample 7 (black)
and UVM-7 (white) nanoparticulated silicas. The error bars were calculated
based on three parallel measurements.
Acknowledgments
This research was carried out thanks to the grant RTI2018-100910-BC44 funded by MCIN/AEI/10.13039/501100011033 (Spain) and by
“ERDF A way of making Europe” (European Union). We also thank the
Conselleria d’Educaci´
o, Investigaci´
o, Cultura i Esport of Generalitat
Valenciana (Spain), grant number GV/2018/111. We appreciate the
technical support of the SCSIE of the Universitat de Val`encia and the
Electron Microscopy Service of the Universidad Polit´ecnica de Valencia.
were cytotoxics. The good biocompatibility must be attributed to
chemical inertness, low toxicity and reduced leakage of free toxic Gd3+
ions from the silica matrix to the cell medium together with the for
mation of GdPO4. Recent works remark the low toxicity of colloidal
13
Microporous and Mesoporous Materials 336 (2022) 111863
M.D. Garrido et al.
Appendix A. Supplementary data
[25]
Supplementary data to this article can be found online at https://doi.
org/10.1016/j.micromeso.2022.111863.
[26]
References
[27]
[1] P. Mansfield, Snapshot magnetic resonance imaging, Angew. Chem. Int. Ed. 43
(2004) 5456–5464, />[2] P. Caravan, J.J. Ellison, T.J. McMurry, R.B. Lauffer, Gadolinium(III) chelates as
MRI contrast agents: structure, dynamics, and applications, Chem. Rev. 99 (1999)
2293–2352, />[3] A market summary report for MRI is available at: />[4] R.B. Lauffer, Paramagnetic metal complexes as water proton relaxation agents for
NMR imaging: theory and design, Chem. Rev. 87 (1987) 901–927, />10.1021/cr00081a003.
[5] A.S. Merbach, L. Helm, E. Toth, The Chemistry of Contrast Agents in Medical
Magnetic Resonance Imaging, Wiley, New York, 2013, />9781118503652.
[6] H.B. Na, I.C. Song, T. Hyeon, Inorganic nanoparticles for MRI contrast agents, Adv.
Mater. 21 (2009) 2133–2148, />[7] H.B. Na, T. Hyeon, Nanostructured T1 MRI contrast agents, J. Mater. Chem. 19
(2009) 6267–6273, />[8] S. Dumas, V. Jacques, W.C. Sun, J.S. Troughton, J.T. Welch, J.M. Chasse,
H. Schmitt-Willich, P. Caravan, High relaxivity magnetic resonance imaging
contrast agents Part 1. Impact of single donor atom substitution on relaxivity of
serum albumin-bound gadolinium complexes, Invest. Radiol. 45 (2010) 600–612,
/>[9] T.J. Meade, A.K. Taylor, S.R. Bull, New magnetic resonance contrast agents as
biochemical reporters, Curr. Opin. Neurobiol. 13 (2003) 597–602, />10.1016/j.conb.2003.09.009.
[10] J. Wahsner, E.M. Gale, A. Rodríguez-Rodríguez, P. Caravan, Chemistry of MRI
contrast agents: current challenges and new frontiers, Chem. Rev. 119 2 (2019)
957–1057, />[11] H. Kato, Y. Kanazawa, M. Okumura, A. Taninaka, T. Yokawa, H. Shinohara,
Lanthanoid endohedral metallofullerenols for MRI contrast agents, J. Am. Chem.
Soc. 125 (2003) 4391–4397, />[12] B. Sitharaman, L.J. Wilson, Gadofullerenes and gadonanotubes: a new paradigm
for high-performance magnetic resonance imaging contrast agent probes,
J. Biomed. Nanotechnol. 3 (2007) 342–352, />jbn.2007.043.
[13] P. Caravan, Strategies for increasing the sensitivity of gadolinium based MRI
contrast agents, Chem. Soc. Rev. 35 (2006) 512–523, />B510982P.
[14] M.A. Bruckman, X. Yu, N.F. Steinmetz, Engineering Gd-loaded nanoparticles to
enhance MRI sensitivity via T1 shortening, Nanotechnology 24 (2013) 462001,
/>[15] J. Pellico, C.M. Ellis, J.J. Davis, Nanoparticle-based paramagnetic contrast agents
for magnetic resonance imaging, Contrast Media Mol. Imaging (2019) 13, https://
doi.org/10.1155/2019/1845637. Article ID 1845637.
[16] W. Zhang, L. Liu, H. Chen, K. Hu, I. Delahunty, S. Gao, J. Xie, Surface impact on
nanoparticle-based magnetic resonance imaging contrast agents, Theranostics 8
(2018) 2521–2548, />[17] J.L. Bridot, A.C. Faure, S. Laurent, C. Rivi`
ere, C. Billotey, B. Hiba, M. Janier,
V. Josserand, J.L. Coll, L.V. Elst, R. Muller, S. Roux, P. Perriat, O. Tillement, Hybrid
gadolinium oxide nanoparticles: multimodal contrast agents for in vivo imaging,
J. Am. Chem. Soc. 129 (2007) 5076–5084, />[18] J.Y. Park, M.J. Baek, E.S. Choi, S. Woo, J.H. Kim, T.J. Kim, J.C. Jung, K.S. Chae,
Y. Chang, G.H. Lee, Paramagnetic ultrasmall gadolinium oxide nanoparticles as
advanced T1 MRI contrast agent: account for large longitudinal relaxivity, optimal
particle diameter, and in VivoT1 MR images, ACS Nano 3 (2009) 3663–3669,
/>[19] Y.S. Yoon, B.I. lee, K.S. Lee, H. Heo, J.H. Lee, S.H. Byeon, I.S. Lee, Fabrication of a
silica sphere with fluorescent and MR contrasting GdPO4 nanoparticles from
layered gadolinium hydroxide, Chem. Commun. (J. Chem. Soc. Sect. D) 46 (2010)
3654–3656, />[20] M.F. Dumont, C. Baligand, Y. Li, E.S. Knowles, M.W. Meisel, G.A. Walter, D.
R. Talham, DNA surface modified gadolinium phosphate nanoparticles as MRI
contrast agents, Bioconjugate Chem. 23 (2012) 951–957, />bc200553h.
[21] J. Fang, P. Chandrasekharan, X.L. Liu, Y. Yang, Y.B. Lv, C.T. Yang, J. Ding,
Manipulating the surface coating of ultra-small Gd2O3 nanoparticles for improved
T1-weighted MR imaging, Biomaterials 35 (2014) 16361642, />10.1016/j.biomaterials.2013.11.032.
[22] S.M. Siribbal, J. Schlă
afer, S. Ilyas, Z. Hu, K. Uvdal, M. Valldor, S. Mathur, Air-stable
gadolinium precursors for the facile microwave-assisted synthesis of Gd2O3
nanocontrast agents for magnetic resonance imaging, Cryst. Growth Des. 18 (2018)
633–641, />[23] J. Yin, D. Chen, Y. Zhang, C. Li, L. Liu, Y. Shao, MRI relaxivity enhancement of
gadolinium oxide nanoshells with a controllable shell thickness, Phys. Chem.
Chem. Phys. 20 (2018) 10038–10047, />[24] A.L. Popov, M.A. Abakumov, I.V. Savintseva, A.M. Ermakov, N.R. Popova, O.
S. Ivanova, D.D. Kolmanovich, A.E. Baranchikov, V.K. Ivanov, Biocompatible
dextran-coated gadolinium-doped cerium oxide nanoparticles as MRI contrast
[28]
[29]
[30]
[31]
[32]
[33]
[34]
[35]
[36]
[37]
[38]
[39]
[40]
[41]
[42]
[43]
[44]
[45]
[46]
14
agents with high T1 relaxivity and selective cytotoxicity to cancer cells, J. Mater.
Chem. B 9 (2021) 6586–8559, />K.M.M. Taylor, J.S. Kim, W.J. Rieter, H. An, W. Lin, W. Lin, Mesoporous silica
nanospheres as highly efficient MRI contrast agents, J. Am. Chem. Soc. 130 (2008)
2154–2155, />K.M.L. Taylor-Pashow, J.D. Rocca, W. Lin, Mesoporous silica nanoparticles with
Co-condensed gadolinium chelates for multimodal imaging, Nanomaterials 2
(2012) 114, />M.A. Ballem, F. Să
oderlind, P. Nordblad, P. Kă
all, M. Od
en, Growth of Gd2O3
nanoparticles inside mesoporous silica frameworks, Microporous Mesoporous
Mater. 168 (2013) 221–224, />R. Guillet-Nicolas, J.-L. Bridot, Y. Seo, M.-A. Fortin, F. Kleitz, Enhanced
relaxometric properties of MRI “positive” contrast agents confined in threedimensional cubic mesoporous silica nanoparticles, Adv. Funct. Mater. 21 (2011)
4653–4662, />´ Bernabeu, J. Pacheco-Torres, E. ChecaA. Cabrera-García, A. Vidal-Moya, A.
Chavarria, E. Fern´
andez, P. Botella, Gd-Si oxide nanoparticles as contrast agents in
magnetic resonance imaging, Nanomaterials 6 (2016) 109, />10.3390/nano6060109.
W.J. Rieter, J.S. Kim, K.M.L. Taylor, H. An, W. Lin, T. Tarrant, W. Lin, Hybrid silica
nanoparticles for multimodal imaging, Angew. Chem. Int. Ed. 46 (2007)
3680–3682, />J.S. Kim, W.J. Rieter, K.M.L. Taylor, H. An, W. Lin, W. Lin, Mesoporous silica
nanospheres as highly efficient MRI contrast agents, J. Am. Chem. Soc. 129 (2007)
8962–8963, />M.S. Usman, M.Z. Hussein, S. Fakurazi, F.F.A. Saad, Gadolinium-based layered
double hydroxide and graphene oxide nano-carriers for magnetic resonance
imaging and drug delivery, Chem. Cent. J. 11 (2017) 47, />s13065-017-0275-3.
Molecular Imaging and Contrast Agent Database (MICAD), National Center for
Biotechnology Information (US), Bethesda (MD), 2004–2013. Available from: htt
p://www.ncbi.nlm.nih.gov/books/NBK5330/.
J. Estelrich, J.M.J. S´
anchez-Martín, M.A. Busquets, Nanoparticles in magnetic
resonance imaging: from simple to dual contrast agents, Int. J. Nanomed. 10
(2015) 1727–1741, />T. Vaughan, L. DelaBarre, C. Snyder, J. Tian, C. Akgun, D. Shrivastava, W. Liu,
C. Olson, G. Adriany, J. Strupp, P. Andersen, A. Gopinath, A.F. Van de Moortele,
M. Garwood, K. Ugurbil, Improved gradient-echo 3D magnetic resonance imaging
using pseudo-echoes created by frequency-swept pulses, Magn. Reson. Med. 56
(2006) 1274–1282, />A. Badea, G.A. Johnson, Modern trends in imaging VII: magnetic resonance
microscopy, Anal. Cell Pathol. 35 (2012) 205–227, />A. Gonzalez-Segura, J.M. Morales, J.M. Gonzalez-Darder, R. Cardona-Marsal,
C. Lopez-Gines, M. Cerda-Nicolas, D. Monleon, Magnetic resonance microscopy at
14 tesla and correlative histopathology of human brain tumor tissue, PLoS One 6
11 (2011), e27442, />I. Perez-Terol, C. Rios-Navarro, E. deDios, J.M. Morales, J. Gavara, N. Perez-Sole,
A. Diaz, G. Minana, R. Segura-Sabater, C. Bonanad, A. Bay´
es-Genis, O. Husser, J.
V. Monmeneu, M.P. Lopez-Lereu, J. Nunez, F.J. Chorro, A. Ruiz-Sauri, V. Bodi,
D. Monleon, Magnetic resonance microscopy and correlative histopathology of the
infarcted heart, Sci. Rep. 9 (2019), 20017, />P. Caravan, C.T. Farrar, L. Frullano, R. Uppal, Influence of molecular parameters
and increasing magnetic field strength on relaxivity of gadolinium- and
manganese-based T1 contrast agents, Contrast Media Mol. Imaging 4 (2009)
89–100, />V.S. Marangoni, O. Neumann, L. Henderson, C.C. Kaffes, H. Zhang, R. Zhang,
S. Bishnoi, C. Ayala-Orozco, V. Zucolotto, J.A. Bankson, P. Nordlander, N.J. Halas,
Enhancing T1 magnetic resonance imaging contrast with internalized gadolinium
(III) in a multilayer nanoparticle, Proc. Natl. Acad. Sci. Unit. States Am. 114 (2017)
6960–6965, />C.L. Tseng, I.L. Shih, L. Stobinski, F.H. Lin, Gadolinium hexanedione nanoparticles
for stem cell labeling and tracking via magnetic resonance imaging, Biomaterials
31 (2010) 5427–5435, />Y.S. Lin, Y. Hung, J.K. Su, R. Lee, C. Chang, M.L. Lin, C.Y. Mou, Gadolinium(III)Incorporated nanosized mesoporous silica as potential magnetic resonance imaging
contrast agents, Phys. Chem. B 108 (2004) 15608–15611, />10.1021/jp047829a.
Y.Z. Shao, L.Z. Liu, S.Q. Song, R.H. Cao, H. Liu, C.Y. Cui, X. Li, M.J. Bie, L. Li,
A novel one-step synthesis of Gd3+-incorporated mesoporous SiO2 nanoparticles
for use as an efficient MRI contrast agent, Contrast Media Mol. Imaging 6 (2011)
110–118, />S. Li, H. Liu, L. Li, N.Q. Luo, R.H. Cao, D.H. Chen, Y.Z. Shao, Mesoporous silica
nanoparticles encapsulating Gd2O3 as a highly efficient magnetic resonance
imaging contrast agent, Appl. Phys. Lett. 98 (2011), 093704, />10.1063/1.3560451.
Y. Shao, X. Tian, W. Hu, Y. Zhang, H. Liu, H. He, Y. Shen, F. Xie, L. Li, The
properties of Gd2O3-assembled silica nanocomposite targeted nanoprobes and their
application in MRI, Biomaterials 33 (2012) 6438–6446, />biomaterials.2012.05.065.
G. Liu, N.M.K. Tse, M.R. Hill, D.F. Kennedy, C.J. Drummond, Disordered
mesoporous gadolinosilicate nanoparticles prepared using gadolinium based ionic
liquid emulsions: potential as magnetic resonance imaging contrast agents, Aust. J.
Chem. 64 (2011) 617–624, />
M.D. Garrido et al.
Microporous and Mesoporous Materials 336 (2022) 111863
[64] J.F. Wall, C.F. Zukoski, Alcohol-induced structural transformations of surfactant
aggregates, Langmuir 15 (1999) 7432–7437, />[65] D. Attwood, V. Mosquera, J. Rodriguez, M. Garcia, M.J. Suarez, Effect of alcohols
on the micellar properties in aqueous solution of alkyltrimethylammonium
bromides, Colloid Polym. Sci. 272 (1994) 584–591, />BF00653225.
[66] X. Miao, W. Xu, H. Cha, Y. Chang, I.T. Oh, K.S. Chae, T. Tegafaw, S.L. Ho, S.J. Kim,
G.H. Lee, Ultrasmall Gd2O3 nanoparticles surface-coated by polyacrylic acid (PAA)
and their PAA-size dependent relaxometric properties, Appl. Surf. Sci. 477 (2019)
111–115, />[67] O. Kahn, Molecular Magnetism, VCH Publishers, New York, 1993 (chapter 2).
[68] C.-C. Huang, T.-Y. Liu, C.-H. Su, T.-W. lo, J.-H. Chen, C.-S. Yeh, Superparamagnetic
hollow and paramagnetic porous Gd2O3 particles, Chem. Mater. 20 (2008)
3840–3848, />[69] R. Paul, T. Paramanik, K. Das, P. Sen, B. Satpati, I. Das, Magnetocaloric effect at
cryogenic temperature in gadolinium oxide nanotubes, J. Magn. Magn Mater. 417
(2016) 182–188, />[70] A.T.M. Rahman, K. Vasilev, P. Majewski, Ultra small Gd2O3 nanoparticles:
absorption and emission properties, J. Colloid Interface Sci. 354 (2011) 592–596,
/>[71] M. Rohrer, H. Bauer, J. Mintorovitch, M. Requardt, H. Weismann, Comparison of
magnetic properties of MRI contrast media solutions at different magnetic field
strengths, J. Invest. Radiol. 40 (2005) 715–724, />rli.0000184756.66360.d3.
[72] P. Caravan, C.T. Farrar, L. Frullano, R. Uppal, Influence of molecular parameters
and increasing magnetic field strength on relaxivity of gadolinium- and
manganese-based T1 contrast agents, Contrast Media Mol. Imaging 4 (2009)
89–100, />[73] Z. Zhou, R. Bai, J. Munasinghe, Z. Shen, L. Nie, X. Chen, T1–T2 dual-modal
magnetic resonance imaging: from molecular basis to contrast agents, ACS Nano 11
(2017) 5227–5232, />[74] C.-S. Yeh, C.-H. Su, W.-Y. Ho, C.-C. Huang, J.-C. Chang, Y.-H. Chien, S.-T. Hung,
M.-C. Liau, H.-Y. Ho, Tumor targeting and MR imaging with lipophilic cyaninemediated near-infrared responsive porous Gd silicate nanoparticles, Biomaterials
34 (2013) 5677–5688, />[75] R.A. Brooks, F. Moiny, P. Gillis, On T2-shortening by weakly magnetized particles:
the chemical exchange model, Magn. Reson. Med. 45 (2001), 1014e20, https://doi.
org/10.1002/mrm.10064.
[76] I. Gunnarsson, S. Arnorsson, Amorphous silica solubility and the thermodynamic
properties of H4SiO40 in the range of 0◦ to 350◦ C at Psat, Geochem. Cosmochim.
Acta 64 (2000) 2295–2307, />[77] W. Vogelsberger, A. Seidel, G. Rudakoff, Solubility of silica gel in water, J. Chem.
Soc., Faraday Trans. 88 (1992) 473–476, />[78] K. Braun, A. Pochert, M. Beck, R. Fiedler, J. Gruber, M. Lind´en, Dissolution kinetics
of mesoporous silica nanoparticles in different simulated body fluids, J. Sol. Gel
Sci. Technol. 79 (2016) 319–327, />[79] K. Maciejewska, B. Pozniak, M. Tikhomirov, A. Kobylinska, L. Marciniak,
Synthesis, cytotoxicity assessment and optical properties characterization of
colloidal GdPO4:Mn2+, Eu3+ for high sensitivity luminescent nanothermometers
operating in the physiological temperature range, Nanomaterials 10 (2020) 421.
https://doi:10.3390/nano10030421.
[80] M. Yon, C. Billotey, J.-D. Marty, Gadolinium-based contrast agents: from
gadolinium complexes to colloidal systems, Int. J. Pharm. 569 (2019), 118577,
/>
[47] S. Cabrera, J. El Haskouri, C. Guillem, J. Latorre, A. Beltr´
an, D. Beltr´
an, M.
D. Marcos, P. Amor´
os, Generalised syntheses of ordered mesoporous oxides: the
atrane route, Solid State Sci. 2 (2000) 405–420, />[48] J. El Haskouri, D. Ortiz de Z´
arate, C. Guillem, J. Latorre, M. Cald´es, A. Beltr´
an,
˜ ez, M.D. Marcos,
D. Beltr´
an, A.B. Descalzo, G. Rodríguez-L´
opez, R. Martínez-M´
an
P. Amor´
os, Silica-based powders and monoliths with bimodal pore systems, Chem.
Commun. (2002) 330–331, />[49] J. El Haskouri, J.M. Morales, D. Ortiz de Z´
arate, L. Fern´
andez, J. Latorre,
C. Guillem, A. Beltr´
an, D. Beltr´
an, P. Amor´
os, Nanoparticulated silicas with
bimodal porosity: chemical control of the pore sizes, Inorg. Chem. 47 (18) (2008)
8267–8277, />[50] M. P´
erez-Cabero, A.B. Hungría, J.M. Morales, M. Tortajada, D. Ram´
on,
A. Moragues, J. El Haskouri, A. Beltr´
an, D. Beltr´
an, P. Amor´
os, Interconnected
mesopores and high accessibility in UVM-7-like silicas, J. Nanoparticle Res. 14
(2012) 1045, />[51] D. Ortiz de Z´
arate, A. G´
omez-Moratalla, C. Guillem, A. Beltr´
an, J. Latorre,
D. Beltr´
an, P. Amor´
os, High-zirconium-content nano-sized bimodal mesoporous
silicas, Eur. J. Inorg. Chem. 13 (2006) 2572–2581, />ejic.200501140.
[52] L.J. Huerta, P. Amoros, D. Beltran, V. Cortes, Selective oxidative activation of
isobutane on a novel vanadium-substituted bimodal mesoporous oxide V-UVM-7,
Catal. Today 117 (2006) 180–186, />[53] J. El Haskouri, D. Ortiz de Z´
arate, F. P´
erez-Pla, A. Cervilla, C. Guillem, J. Latorre,
M.D. Marcos, A. Beltr´
an, D. Beltr´
an, P. Amor´
os, Improving epoxide production
using Ti-UVM-7 porous nanosized catalysts, New J. Chem. 26 (2002) 1093–1095,
/>[54] T. Mosmann, Rapid colorimetric assay for cellular growth and survival: application
to proliferation and cytotoxicity assays, J. Immunol. Methods 65 (1983) 55–63,
/>[55] L. Garcia-Rodenas, S.J. Liberman, Hydrolysis of gadolinium(III) in light and heavy
water, Talanta 38 (1991) 313–318, />80053-3.
[56] C.F. Baes, R.E. Messmer, The Hydrolysis of Cations, Wiley, New York, 1976.
[57] C.J. Brinker, G.W. Scherer, Sol-Gel Science, the Physics and Chemistry of Sol-Gel
Processing, Academic Press, Inc., London, 1990.
[58] I. Mylonas-Margaritis, J. Mayans, S.M. Sakellakou, C.P. Raptopoulou, V. Psycharis,
A. Escuer, S.P. Perlepes, Using the singly deprotonated triethanolamine to prepare
dinuclear lanthanide(III) complexes: synthesis, structural characterization and
magnetic studies, Magnetochemistry 3 (2017) 5, />magnetochemistry3010005.
[59] P.S. Koroteev, A.B. Ilyukhin, N.N. Efimov, E.V. Belova, A.V. Gavrikov, V.
M. Novotortsev, Mononuclear and binuclear lanthanide acetates with chelating
and bridging triethanolamine ligands, Polyhedron 154 (2018) 54–64, https://doi.
org/10.1016/j.poly.2018.07.027.
[60] T.N. Hooper, S.K. Langley, S. G´
omez-Coca, G. Lorusso, E. Ruiz, K.S. Murray,
M. Evangelisti, E.K. Brechin, Coming full circle: constructing a [Gd6] wheel dimer
by dimer and the importance of spin topology, Dalton Trans. 46 (2017)
10255–10263, />[61] Y. Liu, L. Gao, Low-temperature synthesis of nanocrystalline yttrium aluminum
garnet powder using triethanolamine, J. Am. Ceram. Soc. 86 (2003) 1651–1653,
/>[62] R.K. Iller, The Chemistry of Silica. Solubility, Polymerization, Colloid and Surface
Properties, and Biochemistry, John Wiley & Sons, NewYork, 1979.
[63] P. Patnaik, Handbook of Inorganic Chemicals, McGraw-Hill, 2002, ISBN 0-07049439-8.
15