Superacidity and spectral signatures of hydroxyl groups in zeolites
Bạn đang xem bản rút gọn của tài liệu. Xem và tải ngay bản đầy đủ của tài liệu tại đây (3.54 MB, 8 trang )
Microporous and Mesoporous Materials 343 (2022) 112144
Contents lists available at ScienceDirect
Microporous and Mesoporous Materials
journal homepage: www.elsevier.com/locate/micromeso
Superacidity and spectral signatures of hydroxyl groups in zeolites
Georgi N. Vayssilov a, *, Hristiyan A. Aleksandrov a, 1, Eddy Dib b, 1, Izabel Medeiros Costa c,
Nikolai Nesterenko c, Svetlana Mintova b, **
a
Faculty of Chemistry and Pharmacy, University of Sofia, 1126, Sofia, Bulgaria
Laboratoire Catalyse & Spectrochimie (LCS) Normandie Univ, ENSICAEN, UNICAEN, CNRS, 14000, Caen, France
c
Total Energies Research and Technology, Feluy, B-7181, Seneffe, Belgium
b
A R T I C L E I N F O
A B S T R A C T
Keywords:
Zeolites
Acidity
Hydroxyl groups
Silanols
Brønsted acid sites
The hydroxyls, Brønsted acid sites (BAS) and silanols, provide key contributions in the global acidity of zeolites
and have significant impact on their properties and applications. In this work, we present the acidity of BAS and
silanols in zeolites depending on their configurations in zeolite nanoparticles. The acidity was evaluated based on
the deprotonation energy (DPE) calculated by the density functional method and compared to experimental
spectra. The calculated DPE and available experimental data for acidity of small molecules in a gas phase allowed
us to position the hydroxyl groups in zeolites into the general scale of gas phase acidity for the first time. The
simulated deprotonation enthalpies for the bridging hydroxyls are in the range 1113–1187 kJ/mol while for
silanols they vary in larger range 1186–1376 kJ/mol. Compared to gas phase acids, these values imply that the
Brønsted acid sites fall in the range of superacids while silanols cover wide range from strong acids to superacids.
The high gas phase acidy of the zeolite hydroxyls may be explained with the flexibility of the zeolite framework
that efficiently accommodates the negative charge of deprotonated center via structural relaxation, electron
density redistribution or formation of hydrogen bonds. Nanosized zeolite in proton form (HZSM-5) was used as a
model system, and the proximities between bridging hydroxyls and 27Al centers was estimated by 1H{27Al}
REAPDOR MAS NMR technique. A linear correlation between the 1H NMR chemical shifts and stretching O–H
vibrational frequencies of the BAS was found similar to the silanol groups. However, no correlation between the
deprotonation energy and the spectral characteristics of the corresponding hydroxyl (BAS and silanols) was
observed. Thus, the acidity of the hydroxyls cannot be estimated based on the spectral characteristics, which
accounts mainly for the formation and strength of hydrogen bonds.
1. Introduction
Zeolites are crystalline microporous aluminosilicate materials used
as acid catalysts and sorbents in inter alia petrochemical industrial
processes [1]. Their intrinsic acidity is due to the presence of aluminum
in tetrahedral configuration within the siliceous framework giving rise
to a negative charge, compensated by protons [2]. These acid sites –
bridging hydroxyl groups, Al–OH–Si, acting as Brønsted acid sites (BAS),
confer a high activity to zeolites [3]. Furthermore, another type of hy
droxyl groups – silanols, Si–OH, exist in zeolites and their amount is
sometimes far from negligible. The latter considered as structural defects
are often neglected when considering the global acidity of zeolites
despite the variety of configurations they present and their impact on
final properties and applications [4].
Among the best characterization techniques used to probe hydroxyl
groups in solids are 1H solid-state nuclear magnetic resonance (NMR)
and infrared (IR) spectroscopy [5]. The vibration frequency of OH
groups in IR as well as their proton chemical shift in NMR vary with the
strength of hydrogen bonds in which they are involved when present.
Isolated silanols and bridging hydroxyl groups (not involved in a
hydrogen bond), present stretching vibrational frequencies around
3745 cm− 1 and 3615 cm− 1 respectively, that decreases when hydrogen
bonding occurs. The corresponding 1H NMR chemical shifts are ~1.8
and ~4 ppm, however, these values increase when hydrogen bonds
occur. Then, the quantification and identification of these sites was
never a trivial task because of signal overlapping [6,7]. Several
* Corresponding author.
** Corresponding author.
E-mail addresses: (G.N. Vayssilov), (S. Mintova).
1
Equally contributed.
/>Received 5 July 2022; Received in revised form 24 July 2022; Accepted 26 July 2022
Available online 8 August 2022
1387-1811/© 2022 The Authors. Published by Elsevier Inc. This is an open access article under the CC BY-NC-ND license ( />
G.N. Vayssilov et al.
Microporous and Mesoporous Materials 343 (2022) 112144
combinations of experimental and theoretical methods including IR,
NMR and density functional theory (DFT) calculations were considered
to resolve those issues. Advanced NMR techniques have been used to
distinguish isolated and hydrogen bonded BAS in selected zeolites due to
the paramount importance of those sites for catalysis [7–10]. Other
NMR approaches were explored to localize aluminum or silanols with
respect to structure directing agents in as synthesized zeolites [11,12].
Since zeolites are applied in most industrial processes as solid acid
catalysts, their acidity is extensively studied using spectroscopic, sorp
tion, thermal and catalytic approaches [6,13]. All those methods applied
to zeolites, however, in addition to the intrinsic acidity of the measured
hydroxyl groups, various additional effects e.g. confinement, adsorption
and diffusion were considered [14–17]. A direct measure of the acidity
of a hydroxyl group in a chemical compound is its deprotonation energy
(DPE), namely the enthalpy of the reaction
XO-H → XO– + H+
which can be measured experimentally for molecules in the gas phase
[18]. Since for hydroxyl groups in solid, as zeolites, such direct mea
surement of the DPE cannot be performed, the corresponding values
have been approached by computational methods. Following the pio
neering calculations of Sauer [19] and van Santen [20], several groups
reported computed DPE values for zeolites with different framework
structures and aluminum content. The simulations evolved from isolated
fragments of the zeolite framework to embedded models and periodic
3-dimensional models [10,21–25]. Typically, the calculated DPEs of
BAS are around 1100–1250 kJ/mol but they vary depending on the
computational method and models used.
In this study, the acidity of various silanol groups and BAS in
nanosized HZSM-5 zeolite was evaluated based on the deprotonation
energy calculated using DFT with hybrid functional PBE0 in order to
understand their contribution to the global acidity of zeolites. While BAS
act as strong acids, the silanols may behave as milder acid sites, which
are beneficial for some catalytic or sorption processes requiring mod
erate acidity [26]. Using available experimental values for deprotona
tion energy of small molecules in the gas phase and the calculated DPE
values, we estimated the real deprotonation enthalpy of the hydroxyl
groups in nanosized HZSM-5 zeolite. The nanosized zeolite was syn
thesized and characterized using a combination of spectroscopic ap
proaches (see Supplementary Information). Based on the experimental
and theoretical results, a proper positioning of BAS and silanols in ze
olites into the general scale of gas phase acidity is proposed.
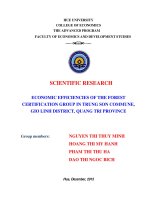
Fig. 1. Optimized structures of zeolite nanoparticles with MFI type framework
containing 1 or 2 Al centers: (A) AlZNP-99, (B) AlZNP-111a, (C) AlZNP-111b,
(D) AlZNP-111ab with different locations of the Brønsted centers (Al centers
in green, linear hydrogen bonds in blue). (For interpretation of the references to
color in this figure legend, the reader is referred to the Web version of
this article.)
The frequency calculations for all models were preformed numeri
cally and the calculated values for stretching vibrational frequencies of
O–H groups were scaled in standard fashion with a scaling factor 0.948
to correct them for the anharmonicity and the shifts due to the
computational method, as reported earlier [32].
The 1H NMR chemical shifts were calculated with GaugeIndependent Atomic Orbitals (GIAOs) method [33], using auxiliary
basis def2/JK, Grid4 FinalGrid5, and tighter SCF convergence criteria.
The chemical shift values were obtained by subtraction from the
calculated isotropic chemical shielding value for tetramethylsilane
(TMS).
2. Methods
2.1. Computational details
Quantum chemical calculations were based on Density functional
theory approach with the hybrid gradient-corrected PBE0 exchangecorrelation functional [27] using ORCA, ab initio, DFT and semi
empirical electronic structure package (vers. 4.1.2) [28,29]. The atomic
basis sets for geometry optimization were def2-SVP basis set with uti
lization of def2/J auxiliary basis [30,31]. No restrictions on the atomic
positions, interatomic distances or angles were applied during geometry
optimization. For the calculations reported here, we used all-silica
ZNP-99, ZNP-111 and ZNP-165 models described in our previous work
[32]. The initial structures of the Al-containing zeolite nanoparticles
models used here, AlZNP-99, AlZNP-111a, AlZNP-111b, AlZNP-111ab,
were constructed from the corresponding all-silica models as one or two
Si centers were replaced by Al to create bridging hydroxyl groups acting
as Brønsted acid sites (Fig. 1). The aluminum center in AlZNP-99 and Ala
in AlZNP-111a and in AlZNP-111ab models are bound via oxygen
bridges to Si centers of the nanoparticle, while Alb at AlZNP-111b and
AlZNP-111ab models is located at the surface of the nanoparticle and is
bound to one terminal hydroxyl and to three Si centers via oxygens.
2.2. Synthesis and characterizations
The nanosized ZSM-5 zeolite was synthesized using a clear precursor
suspension with the following chemical composition: 1 SiO2: 0.25
TPAOH: 25H2O: 0.0125 Al2O3: 0.05 Na2O. For the preparation of the
suspensions, the total amounts of double distilled water and organic
structure directing agent (tetra n-propylammonium hydroxide
(TPAOH), 20 wt % in water solution, Alfa Aesar) were mixed for about
15 min using magnetic stirring. Then, the silicon source (tetraethyl
orthosilicate (TEOS) 98%, Aldrich) was added dropwise to the suspen
sion and subjected to magnetic stirring for 1 h. Finally the aluminum
source (aluminum nitrate (Al(NO3)3.9H2O, 97%, Prolabo) was added to
2
G.N. Vayssilov et al.
Microporous and Mesoporous Materials 343 (2022) 112144
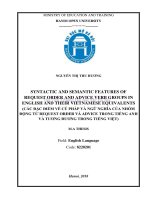
1.5–2.4 ppm) and BAS (3630 cm− 1, 3.7 ppm). This is confirmed by NMR
using a Transfer of Populations in Double Resonance (TRAPDOR) indi
cating a loss in the intensity of the signal at 3.7 ppm after irradiation of
Al during the echo evolution time while the peaks corresponding to
silanols keep the same intensity except for the band at 2.4 ppm sug
gesting the presence of Al in their vicinity (Fig. 2B). The dipolar mod
ulation, giving rise to the intensity loss (difference between S0 and S) is
introduced during the evolution time thanks to a dephasing pulse
applied on 27Al in the pulse sequence. The same methodology was used
for the REAPDOR experiment, known to be more robust and less sensi
tive to diverse Al environments that may be present within the frame
work. The distance between proton and aluminum was determined
based on this experiment (3.7 ppm) and the corresponding ΔS/S0 curve
simulated using SIMPSON code [35] is shown in Fig. 2D; the remaining
three peaks kept the same intensity during the evolution time. The
strong slope before 1000 μs corresponds to the highest dipolar modu
lation, mainly due to a coupling of ~2 kHz corresponding to a distance
1
H—27Al of ~2.5 Å. The weak slope observed between 2000 and 5000 μs
indicates the presence of other Al neighbors located at longer distances
estimated at ~5 Å in line with the previous study reported by Koller and
coworkers [10]. This explains the slight difference between experi
mental and simulated curves for high evolution times. The spins
considered for the simulation were a pair of 1H and 27Al with a dipolar
coupling of 2 kHz that corresponds to the first neighbors. However,
other hydrogen bonded BAS and SiOH appear in different zeolites as
stated above and the correlation between their spectral features and
acidity is of paramount importance.
Quantum chemical calculations, reported here, were based on Den
sity functional theory approach with the hybrid gradient-corrected PBE0
exchange-correlation functional. We used all-silica ZNP-99, ZNP-111
and ZNP-165 models as described in our previous work [32]. The
structures of the Al-containing zeolite nanoparticles (AlZNP-99,
AlZNP-111a, AlZNP-111b, AlZNP-111ab) were constructed from the
corresponding all-silica models as one or two Si centers were replaced by
Al to create bridging hydroxyl groups acting as Brønsted acid sites. The
aluminum center in AlZNP-99 and Ala in AlZNP-111a and in
AlZNP-111ab models are bound via oxygen bridges to Si centers of the
nanoparticle, while Alb at AlZNP-111b and AlZNP-111ab models is
located at the surface of the nanoparticle and is bound to one terminal
hydroxyl, forming Al–OH moiety, and to three Si centers via oxygens
(Fig. 1).
the suspension followed by aging on an orbital shaker for 18 h at room
temperature. Then, the hydrothermal treatment was carried out in
Teflon-lined stainless-steel autoclaves at 180 ◦ C for 72 h under autoge
nous pressure. The solids were purified with double-distilled water and
high-speed centrifugation, until the pH of the supernatant was below 8.
The samples were dried at 90 ◦ C and calcined at 550 ◦ C/5h in air.
29
Si and 27Al magic-angle spinning (MAS) NMR experiments are
performed at 99.3 and 130.3 MHz, respectively on a 500 MHz (11.4 T)
Bruker Avance III-HD spectrometer using a 4 mm probe head, the
sample is rotated at 14 kHz spinning rate. (Figs. S1A and B in Supple
mentary data). The chemical shifts for silicon and aluminum are refer
enced to tetramethyl silane (TMS) and AlCl3, respectively. Radio
frequency (rf) field strength of 36 and 50 kHz and recycle delays of 20
and 1 s, respectively were used.
1
H simple pulse, 1H{27Al} TRAPDOR and 1H{27Al} REAPDOR (MAS)
NMR experiments were performed using the 4 mm probe head. 1H
chemical shifts are referenced to TMS. A radio frequency (rf) field
strength of 50 kHz is used for 1H (π/2 pulse of 5 μs). For REAPDOR
measurements, the adiabatic pulse length used for the 27Al channel is
equal to 1/9 of the rotor period (8.88 μs), and the spinning rate is set to
12.5 kHz. The recycle delay is set to 10 s. For 1H NMR measurements all
the samples were pre-treated under vacuum at 350 ◦ C overnight prior to
filling into the rotor in an Argon saturated glove box. Spectral decon
volution and numerical simulations were performed using Dmfit [34]
and SIMPSON [35].
The crystallinity of the sample was investigated by powder X-ray
diffraction (Fig. S1C in Supplementary data) by a PANalytical XPert Pro
diffractometer using Cu Kα radiation (λ = 1.5418 Å, 45 kV, 40 mA). The
FTIR spectra are acquired using a Nicolet Magna 550-FT-IR spectrom
eter (4 cm− 1 optical resolution). The IR spectrum corresponds to in situ
activated sample at 350 ◦ C under vacuum.
3. Results and discussions
3.1. Spectral features of the bridging hydroxyls
The nanosized ZSM-5 (Si/Al = 40) present an average size of 100 nm
and show high crystallinity with mainly tetrahedral aluminum in the
framework (Fig. S1 in Supplementary data). The corresponding 1H NMR
and IR spectra are depicted in Fig. 2A and C, respectively. The spectra
contain the characteristic bands for silanols (~3740–3700 cm− 1,
Fig. 2. A. Single pulse 1H NMR spectrum of nano
sized HZSM-5 zeolite: the spectrum is deconvoluted
and the peaks are assigned to SiOH (blue) and BAS
(green). B. TRAPDOR effect on the 1H NMR spectrum:
the solid line corresponds to two rotor periods echo
without irradiation of Al and the red dashed line
corresponds to the same echo with Al irradiation. C.
FTIR spectrum of activated nanosized HZSM-5
zeolite. D. REAPDOR curve (dots) and the corre
sponding numerical simulation (solid line) for the
peak at 3.7 ppm in the 1H NMR spectra. The simu
lation corresponds to a pair of 27Al and 1H spins with
a dipolar coupling of 2 kHz. (For interpretation of the
references to color in this figure legend, the reader is
referred to the Web version of this article.)
3
G.N. Vayssilov et al.
Microporous and Mesoporous Materials 343 (2022) 112144
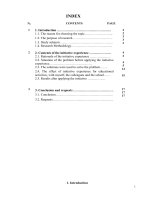
Vibrational frequencies and 1H NMR chemical shifts of all bridging
hydroxyls (Si–OH–Al) and various silanols (Si–OH) were calculated. For
the BAS, three types of hydroxyls were identified considering their
spectral features and involvement in hydrogen bonds (see Fig. 3A and
B). The first type corresponds to isolated BAS with O–H vibrational
frequency between 3620 and 3646 cm− 1 and 1H NMR shift between 3.36
and 3.70 ppm. Those hydroxyls do not participate in regular hydrogen
bonds and neighboring framework oxygens are more than 250 pm far
away from the acidic proton. They correspond to the classical BAS with
experimentally measured IR frequency around 3630 cm− 1 and δ(1H)
around 3.7 ppm, as reported above (Fig. 2A, C). The distance between
the Al center and the proton from the corresponding bridging hydroxyl
group is in the range 233–253 pm that is in an agreement with the
REAPDOR-NMR results shown in Fig. 2D. The second type of BAS cor
responds to hydroxyls with vibrational frequency of 3400–3600 cm− 1
and δ(1H) varying between 3.80 and 5.70 ppm. These bridging hy
droxyls do not participate in a regular hydrogen bond, for which the
arrangement O–H⋯O is close to linear. However, their protons are
affected by the oxygens located aside at H⋯O distances between 200
and 240 pm, which may be considered as irregular (side) hydrogen
bonds with O–H⋯O angles up to 120◦ . The third type of BAS corre
sponds to hydroxyls with regular linear hydrogen bonds to oxygen
centers in the opposite side of the zeolite ring, which in our models has
an O–H frequency between 2950 and 3230 cm− 1 and δ(1H) varying from
7.30 to 10.04 ppm.
Interestingly, the plots of the O–H stretching frequency (Fig. 3A) and
1
H NMR chemical shift (Fig. 3B) of the modeled bridging hydroxyls
versus the distance between the BAS proton and the closest oxygen
center corresponding to two types of hydroxyls are well aligned in a
parabola. This suggests that the regular hydrogen bonds and the irreg
ular hydrogen bonds to side oxygens affect the spectral signatures of the
corresponding hydroxyl in the same way.
The trends for the calculated 1H NMR chemical shift of BAS versus
the hydrogen bonding distance has the same shape as that for silanols,
reported earlier [32] (see Fig. 3C). The only difference is that for the
same hydrogen bonding distance, the 1H NMR chemical shifts of the
bridging hydroxyls are about 1.5 ppm higher than the silanols protons,
while for protons participating in very strong hydrogen bonds (H-bond
below 170 pm) this difference almost vanishes. This implies that the
linear correlation between hydrogen bond length and δ(1H) suggested
by Yesinowski et al. for hydroxyl groups in solids [36], has to be
reconsidered. Instead, one may derive separate linear equations for the
BAS acid sites with strong (linear) hydrogen bonds and those partici
pating in side (medium) hydrogen bonds at δ(1H) = 28.855–0.118
(H-bond, in pm) and δ(1H) = 11.824–0.0326 (H-bond), respectively. The
coefficients in the two equations are similar to those recently reported
for silanol groups participating as proton donors in strong and medium
hydrogen bonds, i.e. δ(1H) = 25.39–0.108 (H-bond, in pm) and δ(1H) =
12.464–0.0419 (H-bond), respectively (see Supplementary information
of Ref. 32). Analogous trend is observed for the calculated vibrational
frequencies of the hydroxyl as a function of the hydrogen bonding dis
tance (not shown here) – the ν(O–H) for the BAS participating in
hydrogen bond is about 100 cm− 1 lower than the frequency of the
silanol, participating in hydrogen bond with the same H-bonding
distance.
In Fig. 3D one can see that the linear correlation between vibrational
frequency and the chemical shift of the proton of specific hydroxyl,
observed earlier for silanols [32], ν(O–H) = 3868.3 – (84.989) δ(1H)
NMR, was also found for the bridging hydroxyl, with somewhat different
coefficients: ν(O–H) = 4016 – (106.84) δ(1H) NMR (with RMSD = 0.99).
As shown, the data points for bridging hydroxyls fall essentially in the
same region as that for the silanols: δ(1H) higher than 3.0 ppm and
ν(O–H) lower than 3650 cm− 1. Thus, based on the vibrational frequency
or δ(1H) NMR in those regions one cannot unambiguously identify if the
specific hydroxyl is a silanol or a BAS. Experimentally both types of
hydroxyls with sharp peaks at 3745 and 3615 cm− 1 can be distinguished
in the IR spectra if they do not participate in hydrogen bonds. However,
when the hydroxyls participate in hydrogen bonds, the bands for both
types of hydroxyls are wider and cannot be discriminated easily. In
Fig. 3D one can also see the points corresponding to the spectral char
acteristics of the terminal Al–OH group in the AlZNP-111b model with
different locations of the charge compensating protons at the bridging
oxygen centers. Since Al–OH group does not participate in hydrogen
bonds, both the IR frequencies and 1H chemical shifts vary in narrow
ranges, from 3774 to 3799 cm− 1 and from 0.00 to 0.43 ppm, clearly
different from silanols and bridging hydroxyls.
3.2. Acidity of bridging hydroxyls and silanols
As described above, the acidity of BAS and silanols is evaluated by
Fig. 3. Plots of the correlations between calculated
spectral features of the modeled hydroxyls and their
participation in hydrogen bonds: (A) O–H stretching
frequency vs. hydrogen bonding distance for BAS; (B)
1
H NMR chemical shift vs. hydrogen bonding distance
for BAS; (C) hydrogen-bonded distance in BAS or
silanols vs. 1H NMR chemical shift; (D) O–H stretch
ing frequency and 1H NMR chemical shift of BAS or
silanol. Symbols corresponding to different types of
hydroxyl groups are shown as insets.
4
G.N. Vayssilov et al.
Microporous and Mesoporous Materials 343 (2022) 112144
calculating the DPE of these groups in the modeled zeolite nanoparticles.
The obtained deprotonation energy of the bridging hydroxyl sites in the
AlZNP models are varying between 1164 and 1242 kJ/mol depending
on both the positions of Al and the acidic proton considered in the
model. Recently, Koller et al. reported deprotonation energies of a series
of bridging OH groups in SSZ-42 zeolite between the 1157–1187 kJ/mol
using PBE-D3/def2-TZVP method [10]. They suggested that the DPE
correlates with 1H NMR chemical shift of their protons with some de
viation; the higher 1H chemical shift corresponds to higher deprotona
tion energy. However, our results show that scattering dominates over
any correlation of the calculated deprotonation energy with the simu
lated 1H NMR chemical shifts of hydroxyl groups (see green triangles in
Fig. 4A). This is valid for both silanols and bridging hydroxyls. No cor
relation was observed also between the deprotonation energy and O–H
stretching frequency of the hydroxyl group (Fig. 4B), as also reported
elswere [25].
The lowest deprotonation energy of 1164 kJ/mol, corresponding to
the most acidic BAS, is obtained for the AlZNP-111a structure, in which
the deprotonated hydroxyl initially participates in a strong hydrogen
bond to a zeolite oxygen center within a five-membered ring. However,
the other bridging hydroxyls participating in strong hydrogen bonds
feature diverse values of the deprotonation energies between 1172 and
1242 kJ/mol (triangles with δ(1H) between 7 and 10 ppm in Fig. 4A and
O–H frequencies between 3250 and 2940 cm− 1 in Fig. 4B). The bridging
hydroxyls, which are not involved in hydrogen bonds have deprotona
tion energy values in the same range, 1171–1225 kJ/mol (triangles with
δ(1H) around 4 ppm in Fig. 4A and around 3600 cm− 1 in Fig. 4B). The
BAS with the strongest hydrogen bonds have deprotonation energies of
1191 and 1242 kJ/mol (triangle at δ(1H) of 8.89 and 10.04 ppm). These
results show clearly that the participation of a bridging hydroxyl in
hydrogen bonds cannot be directly related to the acidity of that
group as estimated by the deprotonation energy value.
One may also compare the average values of the DPE of the bridging
hydroxyls around each of the modeled Al positions, which may be
related to the acidity potential of that Al site, i.e. if the bridging hy
droxyls at this center may produce more or less acidic BAS. In our AlZNP
models we have four Al sites (AlZNP-99, AlZNP-111a, AlZNP-111b, and
Alb at AlZNP-111ab), which have average DPE values of 1225, 1176,
1210, and 1189 kJ/mol, respectively. The values for Alb at AlZNP-111ab
were calculated with one position of the BAS at Ala in the model and
different positions of the bridging hydroxyl around Alb center. Thus,
both the lowest and the highest average DPE values correspond to the
inside Al centers with four Si centers as next nearest neighbors.
The deprotonation energy values calculated for different types of
silanols are spread in a larger interval 1241–1439 kJ/mol (about 200
kJ/mol), than for the values of the bridging hydroxyls 1164–1242 kJ/
mol (about 80 kJ/mol). Some of the silanols exhibit low deprotonation
energies values that overlap with the less acidic bridging hydroxyls
(BAS) as shown in Fig. 4. Note that during the optimization of the ge
ometry of the deprotonated nanoparticle there was reorientation of the
silanols around the negatively charged oxygen, and in some cases a
proton shift from a neighboring silanol to that oxygen center occurs.
Thus, the deprotonated silanol in the final structure may differ from the
initially deprotonated one. Interestingly, the participation of silanols in
hydrogen bonds as proton donors, proton acceptors or both, is not
related to the DPE calculated (see the circles with different colors in
Fig. 4). Similarly, to the BAS, no correlation was observed between the
deprotonation energy and the spectral characteristics of silanols (1H
NMR chemical shift and O–H stretching frequency of hydroxyl groups)
either.
4. Discussion
The lack of correlations between deprotonation energies and spectral
features of silanols can be explained by the dominant influence of the
final state, namely more or less efficient stabilization of the negatively
charged oxygen center remains after deprotonation. The stabilization
may be achieved by local structural rearrangement around the nega
tively charged oxygen or by the formation of hydrogen bonds to it from
neighboring hydroxyls, if available. When the deprotonated silanols
form new hydrogen bonds with neighboring silanols, the negative
charge of the oxygen is partially compensated by the positive charge of
the proton, which leads to stabilization of deprotonated structure.
Similar stabilization effect has been shown to increase the acidity of
Brønsted acid sites in mixed sodium and protonic forms of zeolites due to
stabilization of the deprotonated state by compensating the negative
charge of the oxygen by neighboring sodium ion [37]. In order to
highlight the contribution of the final state on the deprotonation energy
of silanols via formation of hydrogen bonds, we counted the number of
hydrogen bonds that compensate the negatively charged oxygen center
of the deprotonated silanol (Fig. 5A). The highest DPE is calculated for
deprotonated silanols that are not compensated by hydrogen bonds from
neighboring silanols (around 1430 kJ/mol). By increasing the number of
compensating hydrogen bonds to one, two and three, the calculated
deprotonation energy decreases to 1326–1383 kJ/mol, 1260–1350
kJ/mol, and 1241–1280 kJ/mol, respectively. Since the strength of the
compensating hydrogen bonds is different, the values for the deproto
nated silanols, compensated by the same number of hydrogen bonds
vary substantially.
The analysis of the factors affecting the deprotonation energies of the
bridging hydroxyl should take into account that the final deprotonated
state of the hydroxyl around a certain Al center is the same (see the
triangles with different colors in Fig. 5B). Thus, for these hydroxyls, the
initial state of the structure should have dominant contribution to the
deprotonation energy, which can be decomposed into vertical DPE (the
energy of the structure just after removal of the proton) and relaxation
energy of the deprotonated structure. As shown in Fig. 5B, the points for
the total DPE are spread even for hydroxyls, located around the same Al
Fig. 4. Calculated deprotonation energy of a silanol and bridging hydroxyl
groups versus 1H NMR chemical shift (A) and OH vibrational frequency (B) of
that hydroxyl group. Symbols, corresponding to different types of hydroxyl
groups are shown in the legend inside the panel.
5
G.N. Vayssilov et al.
Microporous and Mesoporous Materials 343 (2022) 112144
formation of a hydrogen bond within a five-membered zeolite ring sta
bilizes the structure, e.g. makes the proton more difficult to be removed,
however, to form a hydrogen bond, the [AlO4]- tetrahedron and its
surrounding are distorted, which contributes to destabilization of the
structure. The experimentally measured spectral features, ν(O–H) and
δ(1H), account only for the first effect since it is connected with the
strength of the hydrogen bond, but not for the second one. Thus, one
may not expect strict correlations between the spectral features of hy
droxyl groups with their deprotonation energies, and with their acidity
respectively.
Fig. 6 schematically shows the ranges of calculated DPE values for
the specific chemical shifts in the 1H NMR spectrum measured for the
nanosized HZSM-5 zeolite, as discussed above. From the experimental
spectra one can derive the relative amount of the species with the cor
responding chemical shift and their calculated deprotonation energy
range.
As discussed in the introduction section, the DPE values for both BAS
and silanol hydroxyl groups in zeolites cannot be measured directly and
instead are evaluated by computational modeling. However, different
computational approaches (method, model, system size) result in
different values for analogous types of BAS. Similar problem appears in
the calculation of vibrational frequencies, for which the calculated
values for the studied system are corrected using experimental and
calculated values for well-known simpler models as reference. Thus,
employing the same computational approach for zeolite nanoparticles
and a reference system, may allow after correction to estimate the real
(experimental) values. The calculated values for deprotonation energies
(DPE) and deprotonation enthalpy (DPΔH) of series of gas phase species
containing hydroxyl group and their experimental DPΔH values are
reported in Table S1; a part of the species includes Al–OH or Si–OH
groups. For example, the calculated deprotonation energy and enthalpy
for trimethylsilanol, (CH3)3SiOH are 1589 kJ/mol and 1553 kJ/mol,
respectively. The experimental deprotonation enthalpy values are
somewhat lower, i.e. 1518 ± 19 kJ/mol and 1502 ± 17 kJ/mol as re
ported by Angelini et al. [38] and Damrauer et al. [39], respectively. For
all gas phase species, the calculated DPΔH values overestimate the
experimental ones (without taking into account the reported experi
mental accuracy margins) by 6–56 kJ/mol with an average over
estimation of 34 kJ/mol. In the Table, the ratio between the
Fig. 5. Calculated DPE of a silanol versus the number of hydrogen bonds that
compensate the negatively charged oxygen center of the deprotonated silanol
(A) and calculated DPE (B) and vertical DPE (C) of bridging hydroxyl groups
versus 1H NMR chemical shift of that hydroxyl group in different AlZNP-99
(yellow triangles), AlZNP-111a (blue triangles), AlZNP-111ab (grey triangles)
and AlZNP-111b (orange triangles) models. (For interpretation of the references
to color in this figure legend, the reader is referred to the Web version of
this article.)
center. In order to focus on the initial state influence on the DPE, we
calculated vertical deprotonation energy values and found a rough
trend, i.e. the lower 1H NMR chemical shift of the proton corresponds to
lower vertical DPE value (Fig. 5C). This trend is similar to that reported
by Koller et al. for the total DPE values of SSZ-42 zeolite [10]. Note,
however, that even for the vertical DPE the observed trend is still far
from a good linear correlation (RMSD = 0.63). The reason for this is that
both the 1H chemical shift and the O–H vibrational frequency account
only for the participation of the hydroxyl proton in hydrogen bond but
are not related to other features of the initial state. For example, the
Fig. 6. Calculated DPE ranges corresponding to the main chemical shifts in the
1
H NMR spectrum experimentally observed (Fig. 2A) and the percentage of the
corresponding species.
6
G.N. Vayssilov et al.
Microporous and Mesoporous Materials 343 (2022) 112144
experimental DPΔH and calculated DPE values for each species (an
average of 0.956) is provided. If we take into account only the species
containing silicon or aluminum, the average scaling coefficient is
essentially the same. Thus, we used the value 0.956 to scale the calcu
lated DPE in order to estimate the real deprotonation enthalpy values of
the hydroxyl groups in zeolites. As shown in Table S1 in Supplementary
data, the simulated DPΔH values from the calculated DPE values of the
reference molecules multiplied by the scaling factor fall into the accu
racy range for all but one gas phase species. This observation allowed us
to use the same way to simulate the real DPΔH values for the hydroxyl
groups in zeolites. For BAS, the estimated real deprotonation enthalpy
based on the minimal and maximal calculated DPE of 1164 and 1242
kJ/mol is between 1113 and 1187 kJ/mol. For silanols the range of the
estimated real deprotonation enthalpy is much larger, from 1186 to
1376 kJ/mol.
The estimated DPΔH values allow us to align the BAS and silanol
hydroxyl groups in zeolite nanoparticles in the general scale of gas phase
acidity. For this, we used both experimental DPΔH and calculated DPE
values for several sulfur, phosphorous and carbon containing molecules
(Fig. 7). This result suggests that the Brønsted acid sites in the zeolite fall
in the range of superacids with gas phase acidity higher than fluo
rosulfuric and perchloric acids, and is similar to hexafluorophosphoric
acid. The silanols in zeolite cover a wide range from strong acids to
superacids overlapping with the acidity of nitric, phosphoric and sul
furic acids. The higher gas phase acidy of the zeolite hydroxyls, both
bridging and silanol, compared to the gas phase species, may be
explained with the flexibility (mechanical or electronic) of the zeolite
framework that allow efficient redistribution of the negative charge of
deprotonated center via structural relaxation, electron density redistri
bution or stabilization by hydrogen bonds from neighboring hydroxyls.
deprotonation energy, is in the range 1164–1242 kJ/mol, while the DPE
values for silanols vary in larger range, 1241–1439 kJ/mol. The calcu
lated acidity values suggest that some of the silanol groups have suffi
cient acidity, which is essential for the application of zeolites as acidic
catalysts milder than BAS. These acid sites are highly required for a
series of catalytic processes in which strong acid sites, as BAS, are
undesirable.
No correlation was found between the deprotonation energy and the
spectral characteristics of the corresponding hydroxyl neither for
bridging hydroxyls nor for silanols. The reasons for this discrepancy,
were different for the two types of hydroxyl groups. For silanols, the DPE
value is substantially influenced by the stabilization of the deprotonated
state, which can be accomplished by the formation of hydrogen bonds
from near hydroxyl groups. This can explain why the spectral features,
which are characteristic for the initial intact hydroxyl group, do not
correlate with the DPE values. On the other hand, the deprotonation
energy of BAS depends on the stability of the initial intact state since the
final deprotonated state at a specific Al position is the same for all po
sitions of the bridging hydroxyl groups around it. The lack of correlation
with the spectral features of the hydroxyl in this case is due to the fact
that these features reflect basically the strength of the hydrogen bonds
only without considering the structural distortions occurring due to the
formation of such bonds.
Using as references experimental and calculated values for wellknown gas phase species we derived a scaling coefficient (for the spe
cific method) allowing from the calculated DPE for hydroxyl groups in
zeolites to estimate their experimental deprotonation enthalpies. The
gas phase deprotonation enthalpy, obtained with this approach, for BAS
is 1113–1187 kJ/mol, while for silanols it is 1186–1376 kJ/mol. Those
values suggest that Brønsted acid sites in zeolites can be categorized as
superacids in the gas phase while the silanol groups are placed between
strong acids and superacids.
5. Conclusions
The results, reported here, have shown that 1H NMR chemical shifts
and stretching O–H vibrational frequencies of bridging hydroxyls in
ZSM-5 zeolite follow the same linear correlation observed earlier for the
silanol groups. Moreover, the calculated values of those spectral pa
rameters of the bridging hydroxyls and silanols fall essentially in the
same plot for ν(O–H) below 3640 cm− 1 and δ(1H) above 3.4 ppm. As
expected, the decrease of the O–H frequency and increase of the 1H
chemical shift depends on the formation of hydrogen bond and corre
lates with the corresponding hydrogen bonding distance. Interestingly,
this correlation involves not only the regular close to linear hydrogen
bonds, but also irregular side hydrogen bonds with O–H⋯O angles up to
120◦ . Thus, the traditional assumption that hydrogen bonds should be
close to linear, is not valid, at least for the studied systems.
The acidity of the bridging hydroxyls, estimated by their
CRediT authorship contribution statement
Georgi N. Vayssilov: Validation, Methodology, Conceptualization,
Writing - original draft. Hristiyan A. Aleksandrov: Methodology,
Formal analysis, Conceptualization, Writing - review & editing. Eddy
Dib: Methodology, Formal analysis, Conceptualization, Writing - orig
inal draft. Izabel Medeiros Costa: Supervision, Writing - review &
editing. Nikolai Nesterenko: Funding acquisition, Writing - review &
editing. Svetlana Mintova: Supervision, Funding acquisition, Concep
tualization, Writing - review & editing.
Declaration of competing interest
The authors declare that they have no known competing financial
Fig. 7. Gas phase acidity scale of strong acids and superacids, including Brønsted acid sites and silanol groups in zeolite based on their simulated gas phase
deprotonation enthalpies.
7
G.N. Vayssilov et al.
Microporous and Mesoporous Materials 343 (2022) 112144
interests or personal relationships that could have appeared to influence
the work reported in this paper.
Georgi N. Vayssilov reports financial support and travel were pro
vided by Bulgarian Ministry of Education and Science. Hristiyan Alek
sandrov reports financial support was provided by Bulgarian National
Science Fund. Svetlana Mintova reports financial support was provided
by Normandy Region. Svetlana Mintova reports financial support was
provided by TotalEnergies SE.
[12]
[13]
[14]
[15]
[16]
Data availability
[17]
Data will be made available on request.
Acknowledgments
[18]
GNV acknowledges the support of the project EXTREME, funded by
the Bulgarian Ministry of Education and Science (D01-76/March 30,
2021). HAA acknowledges the support by Bulgarian National Science
Fund (project КП-06-Н59/5). We acknowledge the support of the Label
of Excellence for the Center for zeolites and nanoporous materials by the
Region of Normandy (CLEAR) and Industrial Chair ANR-TOTAL
“Nanoclean energy”.
[19]
[20]
[21]
[22]
Appendix A. Supplementary data
[23]
Supplementary data to this article can be found online at https://doi.
org/10.1016/j.micromeso.2022.112144.
[24]
[25]
References
[26]
[1] M. Guisnet, J.-P. Gilson, Zeolites for Cleaner Technologies. Catalytic Science Series,
vol. 3, Imperial College Press, London, 2002, ISBN 1-86094-329-2.
[2] C.S. Csundy, P.A. Cox, The hydrothermal synthesis of zeolites: history and
development from the earliest days to the present time, Chem. Rev. 103 (3) (2003)
663–702.
[3] E.G. Derouane, J.C. V´
edrine, R. Ramos Pinto, P.M. Borges, L. Costa, M. Lemos,
F. Lemos, F. Ramoa Ribeiro, The acidity of zeolites: concepts, measurements and
relation to catalysis: a review on experimental and theoretical methods for the
study of zeolite acidity, Catal. Rev. Sci. Eng. 55 (4) (2013) 454–515.
[4] I.C. Medeiros-Costa, E. Dib, N. Nesterenko, J.-P. Dath, J.-P. Gilson, S. Mintova,
Silanol defect engineering and healing in zeolites: opportunities to fine-tune their
properties and performances, Chem. Soc. Rev. 50 (2021) 11156–11179.
[5] T. Steiner, The hydrogen bond in the solid state, Angew. Chem. Int. Ed. 41 (2002)
48–76.
[6] K. Hadjiivanov, Identification and characterization of surface hydroxyl groups by
infrared spectroscopy, in: Fr C. Jentoft (Ed.), Advances in Catalysis, vol. 57,
Academic Press, 2014, 99-318.
[7] A. Palcic, S. Moldovan, H. El Siblani, A. Vicente, V. Valtchev, Defect sites in
zeolites: origin and healing, Adv. Sci. (2021), 2104414.
[8] C. Schroeder, V. Siozios, C. Mück-Lichtenfeld, M. Hunger, M. Ryan Hansen,
H. Koller, Hydrogen bond formation of brønsted acid sites in zeolites, Chem. Mater.
32 (4) (2020) 1564–1574.
[9] L. Treps, C. Demaret, D. Wisser, B. Harbuzaru, A. M´ethivier, E. Guillon, D.
V. Benedis, A. Gomez, T. de Bruin, M. Rivallan, L. Catita, A. Lesage, C. Chizallet,
Spectroscopic expression of the external surface sites of H-ZSM-5, J. Phys. Chem. C
125 (3) (2021) 2163–2181.
[10] C. Schroeder, S.I. Zones, M. Ryan Hansen, H. Koller, Hydrogen bonds dominate
brønsted acid sites in zeolite SSZ-42: a classification of their diversity, Angew.
Chem. Int. Ed. 61 (2022), e202109313.
[11] E. Dib, T. Mineva, E. Veron, V. Sarou-Kanian, F. Fayon, B. Alonso, ZSM-5 zeolite:
complete Al bond connectivity and implications on structure formation from solid-
[27]
[28]
[29]
[30]
[31]
[32]
[33]
[34]
[35]
[36]
[37]
[38]
[39]
8
state NMR and Quantum chemistry calculations, J. Phys. Chem. Lett. 9 (1) (2018)
19–24.
E. Dib, J. Grand, S. Mintova, C. Fernandez, Structure-directing agent governs the
location of silanol defects in zeolites, Chem. Mater. 27 (22) (2015) 7577–7579.
W.E. Farneth, R.J. Gorte, Methods for characterizing zeolite acidity, Chem. Rev. 95
(3) (1995) 615–635.
M. Boronat, A. Corma, What is measured when measuring acidity in zeolites with
probe molecules? ACS Catal. 9 (2019) 1539–1548.
R.A. van Santen, G.J. Kramer, Reactivity theory of zeolitic broensted acidic sites,
Chem. Rev. 95 (3) (1995) 637–660.
P. Cnudde, E.A. Redekop, W. Dai, N.G. Porcaro, M. Waroquier, S. Bordiga,
M. Hunger, L. Li, U. Olsbye, V. Van Speybroeck, Experimental and theoretical
evidence for the promotional effect of acid sites on the diffusion of alkenes through
small-pore zeolites, Angew. Chem. Int. Ed. 60 (2021) 10016–10022.
L.-E. Sandoval-Díaz, J.-A. Gonz´
alez-Amaya, C.-A. Trujillo, General aspects of
zeolite acidity characterization, Microporous Mesoporous Mater. 215 (2015)
229–243.
A.A. Viggiano, R.A. Morris, F. Dale, J.F. Paulson, M.J. Henchman, T.M. Miller, A.
E. Stevens Miller, Gas-phase acidities of metaphosphoric acid and metaphosphorus
acid: enthalpies of deprotonation, Phys. Chem. 95 (1991) 1275–1277.
J. Sauer, J.-R. Hill, The acidity of surface silanol groups. A theoretical estimate
based on ab initio calculations on a model surface, Chem. Phys. Lett. 218 (1994)
333–337.
R.A. van Santen, Theory of Brønsted acidity in zeolites, Stud. Surf. Sci. Catal. 85
(1994) 273294.
M. Bră
andle, J. Sauer, Acidity differences between inorganic solids induced by their
framework structure. A combined Quantum mechanics/molecular mechanics ab
initio study on zeolites, J. Am. Chem. Soc. 120 (1998) 1556–1570.
E.A. Ivanova Shor, A.M. Shor, V.A. Nasluzov, G.N. Vayssilov, N. Ră
osch, Effects of
the aluminum content of a zeolite framework: a DFT/MM hybrid approach based
on cluster models embedded in an elastic polarizable environment, J. Chem. Theor.
Comput. 1 (2005) 459–471.
M. Rybicki, J. Sauer, Acidity of two-dimensional zeolites, Phys. Chem. Chem. Phys.
17 (2015) 27873–27882.
A.J. Jones, R.T. Carr, S.I. Zones, E. Iglesia, The strength of brønsted acid sites in
microporous aluminosilicates, J. Catal. 312 (2014) 58–68.
A.J. Jones, E. Iglesia, The strength of brønsted acid sites in microporous
aluminosilicates, ACS Catal. 5 (2015) 5741–5755.
G. Noh, S.I. Zones, E. Iglesia, Consequences of acid strength and diffusional
constraints for alkane isomerization and β-scission turnover rates and selectivities
on bifunctional metal-acid catalysts, J. Phys. Chem. C 122 (44) (2018)
25475–25497.
J.P. Perdew, K. Burke, M. Ernzerhof, Generalized gradient approximation made
simple, Phys. Rev. Lett. 77 (1996) 3865.
F. Neese, The ORCA program system, Wiley Interdiscip. Rev. Comput. Mol. Sci. 2
(2012) 73–78.
F. Neese, Software update: the ORCA program system, version 4.0, Wiley
Interdiscip. Rev. Comput. Mol. Sci. 8 (2017), e1327.
F. Weigend, R. Ahlrichs, Phys. Chem. Chem. Phys. 7 (2005) 3297.
F. Weigend, Phys. Chem. Chem. Phys. 8 (2006) 1057.
E. Dib, I. Medeiros Costa, G.N. Vayssilov, H.A. Aleksandrov, S. Mintova, Complex
H-bonded silanol network in zeolites revealed by IR and NMR spectroscopy
combined with DFT calculations, J. Mater. Chem. 9 (2021) 27347–27352.
R. Ditchfield, Mol. Phys. 27 (1974) 789.
D. Massiot, F. Fayon, M. Capron, I. King, S. Le Calv´
e, B. Alonso, J.-O. Durand,
B. Bujoli, Z. Gan, G. Hoatson, Magn. Reson. Chem. 40 (2002) 70–76.
M. Bak, J.T. Rasmussen, N.C. Nielsen, SIMPSON: a general simulation program for
solid-state NMR spectroscopy, J. Magn. Reson. 147 (2) (2000) 296–330.
J. Yesinowski, H. Eckert, G.R. Rossman, Characterization of hydrous species in
minerals by high-speed proton MAS-NMR, J. Am. Chem. Soc. 110 (1988)
13671375.
G.N. Vayssilov, N. Ră
osch, Influence of alkali and alkaline earth cations on the
brønsted acidity of zeolites, J. Phys. Chem. B 105 (2001) 4277–4284.
G. Angelini, C.E. Johnson, J.I. Brauman, Addition and deprotonation in reactions of
hydroxide ion with a β-hydroxysilane, Int. J. Mass Spectrom. Ion Process. 109
(1991) 1–14.
R. Damrauer, R. Simon, M. Krempp, Effect of substituents on the gas-phase acidity
of silanols, J. Am. Chem. Soc. 113 (1991) 4431–4435.