129Xe NMR analysis of pore structures and adsorption phenomena in rare-earth element phosphates
Bạn đang xem bản rút gọn của tài liệu. Xem và tải ngay bản đầy đủ của tài liệu tại đây (2.36 MB, 8 trang )
Microporous and Mesoporous Materials 344 (2022) 112209
Contents lists available at ScienceDirect
Microporous and Mesoporous Materials
journal homepage: www.elsevier.com/locate/micromeso
129
Xe NMR analysis of pore structures and adsorption phenomena in
rare-earth element phosphates
Roya Khalili a, Anu M. Kantola a, Sanna Komulainen a, Anne Selent a, Marcin Selent a, b,
Juha Vaara a, Anna-Carin Larsson c, Perttu Lantto a, **, Ville-Veikko Telkki a, *
a
b
c
NMR Research Unit, University of Oulu, P.O.Box 3000, FIN-90014, Finland
Centre for Material Analysis, University of Oulu, P.O.Box 3000, FIN-90014, Finland
Chemistry of Interfaces, Luleå University of Technology, SE-97187 Luleå, Sweden
A R T I C L E I N F O
A B S T R A C T
Keywords:
Rare-earth element phosphate
129
Xe NMR spectroscopy
DFT calculations
Rare-earth elements (REEs) are indispensable in various applications ranging from catalysis to batteries and they
are commonly found from phosphate minerals. Xenon is an excellent exogenous NMR probe for materials
because it is inert and its 129Xe chemical shift is very sensitive to its local physical or chemical environment.
Here, we exploit, for the first time, 129Xe NMR for the characterization of porous structures and adsorption
properties of REE phosphates (REEPO4). We study four different REEPO4 samples (REE = La, Lu, Sm and Yb),
including both light (La and Sm) and heavy (Lu and Yb) as well as diamagnetic (La and Lu) and paramagnetic
(Sm and Yb) REEs. 129Xe resonances are very sensitive to the porous structures and moisture content of the
REEPO4 samples. In the samples treated at a lower temperature (80 ◦ C), free water hinders the access of hy
drophobic xenon into small mesopores, but the treatment at a higher temperature (200 ◦ C) removes the free
water and allows xenon to explore the mesopores. Based on a standard two-site exchange model analysis of the
variable-temperature 129Xe chemical shifts, as well as its proposed, novel modification for paramagnetic mate
rials, the average mesopore sizes were determined. The size was the largest (79 nm) for the La sample with mixed
monazite (70%) and rhabdophane (30%) phases and the smallest (6 nm) for the Yb sample with pure xenotime
phase. The mesopore sizes of the Lu and Yb samples (12 and 6 nm) differed by a factor of two regardless of their
similar xenotime phase. The 129Xe NMR analysis revealed that the heats of adsorption of the samples are similar,
varying between 8.7 and 10.1 kJ/mol. For diamagnetic samples, computational modelling confirmed the order of
magnitude of the chemical shifts of Xe adsorbed on surfaces and therefore the validity of the two-site exchange
model analysis. Overall, 129Xe NMR provides exceptionally versatile information about the pore structures and
adsorption properties of REEPO4 materials, which may be very useful for developing the extraction processes and
applications of REEs.
1. Introduction
Rare-Earth Elements (REEs), comprising lanthanoids, yttrium and
scandium, are broadly used in many important applications ranging
from catalysis and magnets to electric motors, and their global need is
rapidly increasing [1]. Lanthanoids have 4f sublevel in their valence
shell with unoccupied orbitals and unpaired electrons. This special
electron configuration is the reason for their useful electric, magnetic,
and optical properties. Typically, REEs exist as trivalent cations (REE3+),
they show similar physicochemical properties, and they are found in the
same ores [2,3].
Phosphate compounds (REEPO4 materials) are one of the prevalent
hosts of REE3+ ions in minerals [2,4]. Depending on the REE3+ ion size,
mechanochemistry, method and conditions (such as temperature and
pH) of synthesis [2,4–11], they form phosphates in monoclinic mona
zite, monoclinic rhabdophane, monoclinic churchite and tetragonal
xenotime phases [5,11–13]. Rhabdophane and churchite are hydrated
structures containing varied amounts of structural water, whereas
monazite and xenotime are anhydrous phases, where residual water can
only be found on the surfaces of the grains. The different synthetic
* Corresponding author.
** Corresponding author.
E-mail addresses: (P. Lantto), (V.-V. Telkki).
/>Received 29 June 2022; Received in revised form 25 August 2022; Accepted 2 September 2022
Available online 14 September 2022
1387-1811/© 2022 The Authors. Published by Elsevier Inc. This is an open access article under the CC BY license ( />
R. Khalili et al.
Microporous and Mesoporous Materials 344 (2022) 112209
procedures also determine the size and shape of the formed grains [14,
15].
For the extraction and utilization of REEs, it is important to know the
physicochemical properties of REEPO4:s. In our previous study [16], we
showed that experimental solid-state 31P NMR spectroscopy, combined
with 31P NMR calculations by density-functional theory (DFT) provided
detailed information about the local structures of rare-earth phosphate
minerals. We prepared selected rare-earth phosphate (REE = La, Sm, Lu
and Yb) samples through the homogenous acidic solution method,
which is one of the most common methods for synthesizing REEPO4:s [4,
5]. The experimental and computational 31P NMR analysis of the ob
tained homogenous, nanocrystalline products allowed the determina
tion of the local structures and water molecule coordination on the
surfaces of monazite, xenotime and rhabdophane phases.
An alternative way to study the properties of materials by NMR
spectroscopy is to introduce NMR-active probe molecules to them.
Xenon gas is an excellent probe for materials, as it is an inert noble gas,
its 129Xe spin-1/2 isotope has a relatively high natural abundance and
sensitivity, as well as chemical shift that is very sensitive to its local
physical or chemical environment. Furthermore, its NMR sensitivity can
be improved by several orders of magnitude by the spin-exchange op
tical pumping (SEOP) method [17–19]. 129Xe NMR is especially useful
for probing micro- and mesoporous structures of porous materials such
as zeolites, clathrates, metal-organic frameworks, porous organic cages
and their porous liquids, mesoporous (biogenic) silicas, coals, ionic
liquids, geopolymers, electrodes, diesel particulate filters, rubber,
starch, soils, clays, cements, and shales [20–47]. Furthermore, it is
broadly exploited also in biosensor, lung imaging and microfluidics
applications [48–55].
Here, we for the first time exploit 129Xe NMR in the investigation of
REEPO4 samples and demonstrate that it provides extraordinarily ver
satile information about the porous structures and gas adsorption
properties of the materials. Experimental analysis is supplemented by
computational modelling [29–33,56,57] assisting in microscopic inter
pretation of 129Xe NMR data. Complementary information of the particle
sizes, porous structures and phases is obtained by laser diffraction and
Field Emission Scanning Electron Microscopy (FESEM) analysis.
400 spectrometer and a 5-mm BBFO probe. The spectra were collected
with the spin-echo sequence to reduce baseline distortions. The lengths
of the 90◦ and 180◦ pulses were 8.75 and 17.50 μs, respectively. The
number of scans was 16 for the diamagnetic La and Lu samples, 64 for
the paramagnetic Sm, and 2048 for the paramagnetic Yb. Due to the
different magnetic nature of the rare-earth elements in REEPO4, the echo
time and the relaxation delay varied for each sample and each experi
ment lasted 16–48 min. Relaxation delay and delay τ between the 90◦
and 180◦ pulses were 85 s and 1 μs, respectively, for the La (80) sample,
85 s and 10 μs for the La (200) sample, 180 s and 2 μs for the Lu (80)
sample, 210 s and 10 μs for the Lu (200) sample, 15 s and 1 μs for the Sm
(80) sample, 30 s and 10 μs for the Sm (200) sample, 1 s and 1 μs for the
Yb (80) sample, and 2 s and 2 μs for the Yb (200) sample. The experi
ments were performed at variable temperatures ranging from 180 to
301 K with the step of about 6 K and with 30 min of temperature sta
bilization delay between the experiments. The samples were cooled with
a liquid nitrogen evaporator. 129Xe chemical shifts were referenced with
respect to a shift of a 2.15 atm 129Xe gas resonance set to 0 ppm.
2.3. FESEM and particle size distribution analysis
The crystal and particle shapes of the REE phosphate samples were
analyzed by a Zeiss Sigma FESEM instrument, which is equipped with
scanning electron microscope, energy dispersive x-ray spectroscopy
(EDS) analyzer and electron backscatter diffraction (EBSD) camera.
High-resolution FESEM images were recorded by detecting the emitted
secondary electrons (SE) from the electron beam with 5 kV acceleration
voltage.
The particle size distributions of the REEPO4 samples were measured
by a multi-wavelength laser diffraction particle size analyzer (Beckmann
Coulter LS 13320) with a universal liquid sample handling module.
Before the analysis, the samples were dissolved in isopropanol. Ultra
sonic treatment was used over the samples to break the larger aggregates
before the measurements. In particle-size calculations, the Fraunhofer
optical model [58] was used. Particle sizes were analyzed in the range of
0.04–2000 μm.
2.4. Computational modelling
2. Materials and methods
Quantum-mechanical calculations of 129Xe NMR shielding tensors
were carried out at DFT level for the Xe atom on several hydrated sur
faces of the dense xenotime and monazite phases of diamagnetic LuPO4
and LaPO4, respectively. Starting from the bulk structures optimized at
DFT level in the earlier study of 31P NMR of these systems [16], we cut
surface models for the most common Miller planes, {100} for xenotime
[59] and {010} for monazite [60]. To see how the Xe chemical shifts
depend on different surfaces, also {110} and {101-Y} surface models for
xenotime [59] were built.
Slab models shown in Figs. S8–S11 were constructed with the
AMS2020 package, in which pre-optimization was done with DFTB
module [61] at the GFN1-xTB semi-empirical level [62,63]. First, a unit
cell slab model of each Miller plane was constructed. A two unit-cell
thick slab of four phosphate (and REE) layers in the surface normal (c
lattice) direction was separated by ca. 20 Å vacuum layer. To resemble
experimental hydrated conditions, one side of the slab was terminated
by two water molecules, for which positions were pre-optimized keeping
the slab frozen. The actual model for 129Xe NMR calculations consisted
of 2 × 2 unit cells in the surface directions to prevent interactions be
tween periodic images of the Xe atom placed on the hydrated face of the
slab. The Xe position was then pre-optimized together with the hydrated
top layer of the two phosphate (and REE) layers while keeping the
bottom layer fixed to the original DFT geometry.
The pre-optimized structures were used as inputs for periodic DFT
calculations of 129Xe NMR shielding tensors with CASTEP code [64].
First, the final slab model structures (see Figs. S8–S11 and cif files in
Supplementary Information) were optimized at DFT level using “fine”
2.1. Samples
Four REEPO4 samples (REE = La, Sm, Lu and Yb) were synthesized
through the homogenous acidic solution method [5,8] as described in
detail in our previous publication [16]. To reach out the diverse features
of the large REE group, four REEs were selected to represent the size and
magnetic properties of this group. Diamagnetic La and paramagnetic Sm
were selected from light and large REEs, while diamagnetic Lu and
paramagnetic Yb represent heavy and small ones. Before adding the
samples to 5 mm NMR tubes, they were treated in ambient atmosphere
either at 80 ◦ C for 1 h or at 200 ◦ C for 1–2 d to study the effect of water
evaporation on the accessibility of pores. We note that those moderate
treatment temperatures are not expected to change the structure of
materials, as seen in our previous publication [16]. After the tempera
ture treatment, about 0.3 g of REEPO4 was inserted in a 5 mm NMR tube,
the tube was connected to a vacuum line and 129Xe isotope-enriched
(91%) Xe gas was condensed into the sample by using liquid nitrogen.
Finally, the tube was flame sealed. The amount of 129Xe gas added to the
samples corresponds to a pressure of 4 atm in an empty tube. Hereafter,
the REEPO4 samples are referred to based on their metal element and the
treating temperature. For example, the La phosphate sample treated at
low temperature (80 ◦ C) is referred to as La (80).
2.2.
129
Xe NMR experiments
129
Xe NMR experiments were carried out with a Bruker Avance III
2
R. Khalili et al.
Microporous and Mesoporous Materials 344 (2022) 112209
quality, PBE functional [65] and Grimme’s D2 dispersion correction
[66] by keeping the bottom layer fixed similarly as in the
pre-optimization. Then, 129Xe NMR shielding tensors were computed
with the gauge including projector augmented waves (GIPAW) method
at scalar relativistic zeroth-order regular approximation (SR-ZORA)
level utilizing on-the-fly-generated (OTFG) ultrasoft pseudopotentials
[67,68] with 572 eV cut-off energy. Dense Monkhorst-Pack k-point
sampling of the Brillouin zone was assured by choosing Δk < 0.03 Å− 1 in
each lattice direction. The low-density xenon gas used as the experi
mental chemical shift reference was approximated with a single 129Xe
atom placed at the center of a cubic periodic cell with sides of 20 Å, for
which NMR shielding was computed at the same level of the theory as in
the REEPO4 slab models.
Table 1
Mean particle size (μm) of the rare earth phosphate samples.
La
Lu
Sm
Yb
8.7
7.3
3.6
4.9
shown in Fig. S3. The particle size varies between 3.6 and 8.7 μm, being
largest for the La sample and smallest for the Sm sample. The particle
sizes measured by laser diffraction reflect the sizes of overall crystal
aggregates (c.f., FESEM images in Figs. S1 and S2), not individual
crystals, and therefore they are significantly larger than the crystal sizes
reported above.
3.2.
3. Results and discussion
129
Xe NMR spectral features and signal assignment
129
Xe spectra of xenon in the REEPO4 samples measured at 180, 240
and 295 K are shown in Fig. 2. Full temperature series can be found from
Figs. S4–S7. The 129Xe spectra reflect the diamagnetic (La and Lu) and
paramagnetic (Sm and Yb) nature of the samples, as discussed below. In
the discussion, it is important to understand that diffusion-driven ex
change of Xe between different sites significantly affects the chemical
shifts and line shapes. If the exchange is slow in the NMR time scale,
different sites produce separate peaks. If the exchange is fast, only a
single exchange-averaged peak is observed, and the chemical shift is a
population-weighted average of the shifts of the exchanging sites. In the
intermediate exchange region, broadened signals are observed. In the
case of two-site exchange, the NMR time scale is τ = 1/(2πΔν), where
Δν is the difference of the resonance frequencies of 129Xe in the two sites
[69].
At 295 K, the La (80) sample shows two 129Xe resonances at around
0 and 40 ppm. The 0 ppm signal is expected to arise from free-like Xe in
large, micrometer-size pores in between the particles (particle size 8.7
3.1. FESEM and particle size distribution analysis
Fig. 1 shows FESEM images and previous results [16] of the powder
x-ray diffraction (PXRD) phase analysis of the REEPO4 samples. FESEM
images with different magnification are shown in Figs. S1 and S2. Ac
cording to the PXRD analysis [16], La (both 80 and 200) is a mixture of
monazite (70%) and rhabdophane (30%) phases. The phase of Sm (80
and 200) is rhabdophane, while the phase of both Lu (80 and 200) and
Yb (80 and 200) is xenotime. The FESEM images show a cylindrical
shape for the La and Sm nanocrystals while the Lu and Yb nanocrystals
are spherical. The crystal dimensions vary from tens to hundreds of
nanometers, and the crystals are aggregated together, forming larger
particles. The La sample with a mixed monazite and rhabdophane phase
shows smaller crystals with average length and width of 120 and 25 nm
in comparison to the pure rhabdophane Sm sample crystals with average
length and width of 250 and 30 nm. The average diameters of the
spherical nanocrystals in the Lu and Yb samples are 90 and 80 nm,
respectively.
The mean particle sizes of the REEPO4 samples measured by laser
diffraction are reported in Table 1 and the particle size distributions are
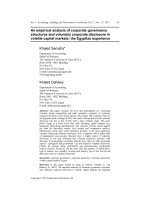
Fig. 2. 129Xe NMR spectra of xenon in the REEPO4 samples measured at 180,
240 and 295 K. Number 80 in parentheses refers to samples treated at 80 ◦ C and
200 refers to samples treated at 200 ◦ C. Note the extended chemical shift scale
for the paramagnetic Yb samples (spectra on the right).
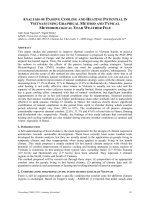
Fig. 1. FESEM images of the rare-earth phosphate samples as well as their
phase structures determined by PXRD [16]. The La and Lu samples are
diamagnetic, while the Sm and Yb samples are paramagnetic.
3
R. Khalili et al.
Microporous and Mesoporous Materials 344 (2022) 112209
μm, see Table 1), because its chemical shift is close to that of the free Xe
the particles is observed at higher temperatures. However, some meso
pore sites are still accessible, and their signal becomes observable at
lower temperatures due to increased adsorption and decreased exchange
rate. At the lowest temperature (180 K), the chemical shifts of the
mesopore signals of the Lu (80) and Lu (200) samples are almost equal,
supporting the interpretation about their similar origin. The second,
broad, lower chemical shift signal of the Lu (80) sample may arise from
partially water-filled mesopores, leading to faster exchange between the
mesopore and free Xe sites.
The spectra of the paramagnetic Sm (80) sample (with Sm3+ ions in
the 4 f 5 configuration and the spin, orbital and total angular momentum
quantum numbers S = 5/2, L = 5 and J = 5/2, respectively) include a
single, broad peak, whose chemical shift increases from about 35 to 205
ppm when the temperature decreases from 295 to 180 K. Again, the peak
is interpreted to arise predominantly from Xe in mesopores in between
the cylindrical nanocrystals of the Sm sample (see Fig. 1). The broadness
of the signal may partially reflect the paramagnetic nature of the Sm
sample. On the other hand, the asymmetric broadening of the peak to
wards lower chemical shift values at higher temperatures may be a
consequence of intermediate exchange between the mesopore and free
Xe sites. As for the Lu sample, the sites are not well resolved in the
spectrum due to the relatively small particle size (3.6 μm, see Table 1).
Spectral features of the Sm (200) sample are similar to Sm (80), but the
chemical shifts are 10–15 ppm higher. As for the other samples, we
interpret that the increased chemical shift is a consequence of the
increased accessibility of mesopores due to water evaporation. The total
water content of the Sm (80) sample (0.91 mol per mole of SmPO4) is
higher than that of La (80) but lower than that for Lu (80), and the
weight of the Sm sample decreases about 4% when the sample is heated
from 80 to 200 ◦ C [16].
Both the 129Xe chemical shifts and line widths of the Yb samples
(Yb3+ in the 4f13 configuration with S = 1/2, L = 3 and J = 7/2) are
significantly larger than those of the other REEPO4 samples due to
strong paramagnetic interactions. The fact that the shift is even larger in
Yb samples than in the other present paramagnetic systems involving
Sm, is expected based on the five times larger magnitude of the magnetic
√̅̅̅̅̅̅̅̅̅̅̅̅̅̅̅̅̅
moment of Yb3+, μ = gJ J(J + 1)μB ≈ 4.54μB (with gJ the Land´e gfactor of the ion and μB the Bohr magneton) than that of Sm3+,
μ ≈ 0.85μB . Such differences are reflected, besides the observable
chemical shifts, also in the relative sizes of the “blind spheres” around
the lanthanide ions, in which rapid paramagnetic relaxation renders the
NMR resonances altogether unobservable [70]. At 295 K, the chemical
shift is about 160 ppm, and the line width is about 150 ppm. We note
that, as described in our previous publication, also the 31P resonance of
the Yb sample was much broader than that of the other paramagnetic Sm
sample (see Fig. 4 in Ref. [16]). At 180 K, the 129Xe chemical shift of Yb
(80) is very high, about 340 ppm. The 129Xe shift of Yb (200) is about
80–100 ppm larger than that of Yb (80) due to the increased accessibility
of mesopores in between the spherical nanocrystals (see Fig. 1) because
of water evaporation. The water content of Yb (80) is the highest (1.58
mol per mole of Yb) among the REEPO4 samples studied here, and the
weight of Yb decreases slightly over 2% when the sample is heated from
80 to 200 ◦ C [16]. Due to the relatively small particle size (4.9 μm), the
free Xe site is not resolved in the spectra.
gas (0 ppm). The 40-ppm signal is interpreted to arise from Xe adsorbed
into nanometer-size (~1–100 nm, mostly in the mesoporous region)
pores, because the shift is typical for Xe in mesoporous materials [71],
and there are lots of nanometer-size porous structures visible in between
the cylindrical nanocrystals in the FESEM images (see Fig. 1). The
chemical shift of the mesopore signal increases with decreasing tem
perature and reaches the value of about 170 ppm at 180 K. Simulta
neously, the intensity of the free Xe signal decreases with decreasing
temperature, most probably due to increased adsorption of Xe into
mesopores. The spectra of the La (200) sample are very similar to those
of La (80), indicating that water evaporation at the higher temperature
does not significantly change the porous structures and surface in
teractions probed by Xe. According to the thermogravimetric analysis
(TGA) reported in our previous publication (Fig. 1 and Table 2 in
Ref. [16]), the total water content of the La (80) sample is relatively low
(0.69 mol per mole of La), and the weight of the sample decreased by less
than 2% when the preparation temperature was increased from 80 to
200 ◦ C, which may explain the similarity of the La (80) and La (200)
spectra. We note that a part of the evaporated water may be included in
the rhabdophane structure, and that water is not expected to block
mesopores.
At 295 K, the 129Xe spectrum of the Lu (80) sample includes a single
peak around 10 ppm. The chemical shift of the peak increases with
decreasing temperature, and it is about 170 ppm at 180 K. At the lower
temperatures, below 240 K, another, narrower signal appears at a higher
chemical shift, which reaches the value of about 210 ppm at 180 K. In
contrast, the Lu (200) sample only shows a single, broad 129Xe resonance
at all temperatures, with the chemical shift increasing from about 90 to
215 ppm when temperature decreases from 295 to 180 K. We interpret
that this signal arises predominantly from the mesopores residing in
between the spherical nanocrystals of Lu (see Fig. 1). However, most
likely the signal is significantly broadened because of relatively fast
exchange between the mesopore-adsorbed and the free Xe sites at higher
temperatures. Contrary to the La sample, those sites do not produce
well-resolved peaks to the spectrum because the exchange between the
sites is faster due to smaller particle size of Lu (La: 8.7 μm; Lu: 7.3 μm;
see Table 1). According to the TGA analysis, the total water content of
the Lu (80) sample is relatively high (1.14 mol per mole of Lu), and the
weight of the sample decreases by 2% when the preparation temperature
was increased from 80 to 200 ◦ C [16]. We interpret that water hinders
the access of the hydrophobic Xe to the mesopores in Lu (80) samples,
and therefore only a signal characteristic to the free Xe site in between
Table 2
Parameters resulting from the fits of Eq. (1) with the experimentally observed
129
Xe chemical shifts of xenon in the mesopores of the REEPO4 samples (δs =
chemical shift of129Xe adsorbed on the surface of the pore; D = mean pore
diameter; Q = effective heat of adsorption). As explained in the text, the pa
rameters of the samples treated at the higher temperature (200 ◦ C) are expected
to better represent the real physical properties of the REEPO4 samples. The re
sults of fits of the modified Terskikh equation (Eq. (2)) for the paramagnetic Sm
(200) and Yb (200) samples are reported in Table 3.
REE
δS (ppm)
D/ɳRK0
D (nm)b
Q (kJ/mol)
La (80)
La (200)
Lu1 (80)a
Lu2 (80)a
Lu (200)
Sm (80)
Sm (200)
Yb (80)
Yb (200)
268 ±
265 ±
340 ±
360 ±
241 ±
480 ±
413 ±
550 ±
483 ±
6300 ± 200
6770 ± 80
400000 ± 100000
11000 ± 3000
1020 ± 120
12300 ± 500
5000 ± 200
537 ± 15
550 ± 40
73 ± 3
78.8 ± 0.9
4300 ± 1200
120 ± 30
11.8 ± 1.4
143 ± 6
58 ± 2
6.3 ± 0.2
6.4 ± 0.4
9.83 ± 0.11
10.13 ± 0.04
15.3 ± 0.7
10.3 ± 0.7
9.2 ± 0.3
9.7 ± 0.3
9.02 ± 0.14
6.1 ± 0.3
8.3 ± 0.2
6
2
40
40
5
40
15
30
5
3.3. Analysis of
adsorption
129
Xe chemical shifts: mesopore sizes and heats of
The 129Xe chemical shifts of xenon adsorbed in mesopores of the
REEPO4 samples are plotted in Fig. 3. As described by Terskikh et al.
[71], the chemical shift of Xe in mesoporous materials can be approxi
mated to be a population-weighted average of the shifts in the free and
adsorbed Xe sites, leading to the following dependence between the shift
and physical properties of the sample:
a
Lu (80) had two mesopore signals in its spectrum, Lu1 refers to the lower
chemical shift signal and Lu2 refers to the higher chemical shift signal.
b
D is calculated by assuming that ɳ = 4 (cylindrical pore geometry) and K0 =
3.47⋅10− 13 m mol K1/2 J− 1.
4
R. Khalili et al.
Microporous and Mesoporous Materials 344 (2022) 112209
Here, δO
S is the orbital shift and the second term, associated with the
constant A, considers the inverse temperature dependence due to hy
perfine interaction. If zero-field splitting is included (in triplet or higher
spin states), A may also be temperature dependent, but here A is
assumed constant. Consequently, the modified Terskikh model for
paramagnetic materials is:
δ=
δOS + TA
.
D
1 + ηR√̅̅T K exp(Q/RT)
(3)
0
The parameters resulting from the fits of Eq. (3) with the chemical
shifts of the paramagnetic samples Sm (200) and Yb (200) are shown in
Table 3. In the fits, parameter δOS was fixed to be equal to the δS of the
diamagnetic sample with similar phase reported in Tables 2 and i.e., δS of
La (200) for Sm (200) and δS of Lu (200) for Yb (200). The parameter A
related to the hyperfine interaction is 70% higher for Yb (200) than Sm
(200), reflecting again the stronger paramagnetic interactions in the
former sample. The theoretical expression for this parameter, based on
the Kurland-McGarvey theory of paramagnetic shift [72] involves the
hyperfine coupling tensor of the 129Xe nucleus in the two materials. The
latter, in turn, depends on both the extent of spin delocalization and the
detailed dynamics of the Xe guest in the systems, explaining why one
cannot expect the size of the relative paramagnetic shifts to directly
follow the size of the magnetic moments of the paramagnetic metal
centers, quoted above. The modified Terskikh model fits result in
smaller pore diameters D and slightly different heats of adsorption for
Sm (200) and Yb (200). The fact that the changes are larger than the
error bars stresses the importance of using the modified model repre
senting more accurately the paramagnetic systems. The values of D and
Q are taken as correct parameter values for the Sm (200) and Yb (200)
samples in the discussion below.
According to the 129Xe chemical shift fits of the REEPO4 samples
treated at the higher temperature (200 ◦ C), the mean pore diameters of
the La and Sm samples, 79 and 40 nm, are significantly larger than those
of the Lu and Yb samples, 12 and 6 nm. According to the FESEM images
shown in Fig. 1, the La and Sm samples have similar cylindrical nano
crystals, and the average crystal width is about 25–30 nm. Most likely
the mesopores probed by Xe are cavities in between the crystals or
crystal bundles. The Lu and Yb samples contain spherical nanocrystals
with a diameter of about 80–90 nm, and the 129Xe NMR analysis implies
that the mesopores in between the spherical nanocrystals are smaller
than those between the needle-shaped nanocrystals. Interestingly, the
mesopore sizes of the Lu and Yb samples (12 and 6 nm) differ by the
factor of two, regardless of their similar xenotime phase structure. Ac
cording to the FESEM images, the spherical nanocrystals of Lu are
slightly larger than those of Yb, which may explain the different sizes of
mesopores in between the nanocrystals. Furthermore, the mean particle
size of Lu (7.3 μm) is also higher than that of Yb (4.9 μm), see Table 1.
The observed differences may be interesting from the point of view of
extraction processes and applications of REEs. The mean pore sizes, as
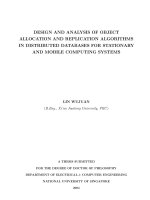
Fig. 3. 129Xe chemical shifts of xenon adsorbed in the mesopores of the REEPO4
samples as a function of temperature. Solid and dash lines show the fits of Eq.
(1) with the experimental data. Only the Lu (80) sample spectra feature two
pore peaks (see Fig. 2).
δ=
δS
.
D
1 + ηR√̅̅T K exp(Q/RT)
(1)
0
Here, δS is the chemical shift of 129Xe adsorbed on the surface of the
pore, D is the mean pore diameter, η is the pore geometry factor (e.g.,
equal to 4 for cylindrical pores), R is the universal gas constant, T is the
temperature, K0 is a pre-exponential factor, and Q is the effective heat of
adsorption. According to the model, the observed increase of chemical
shift with decreasing temperature is a consequence of increased relative
population of Xe on the surface site due to adsorption.
The fits of Eq. (1) with the 129Xe chemical shifts of xenon adsorbed in
the mesopores of the REEPO4 samples are shown in Fig. 3 (solid and dash
lines). Adjustable parameters in the non-linear least squares regression
were δS, D and Q. The resulting fitting parameters are listed in Table 2.
The values of pore diameter D were calculated by assuming cylindrical
pore geometry (ɳ = 4) and a value of pre-exponential factor K0 of
3.47⋅10− 13 m mol K1/2 J− 1. The latter value was estimated based on the
general correlation between the chemical shift and pore size in porous
silica-based materials using a typical heat of adsorption of 10 kJ/mol
[24].
According to the fits, the chemical shifts of Xe adsorbed on the sur
faces of the diamagnetic La (80) and La (200) samples are equal within
the error bars, about 265 ppm. For the diamagnetic Lu (200) sample, δS
is almost equal to the La samples, about 241 ppm, regardless of their
different phase structures (La: monazite 70%, rhabdophane 30%; Lu:
xenotime). On the other hand, Lu (80) shows significantly higher δS for
both signals, about 350 ppm. The higher δS might be a consequence of
water on surfaces; on the other hand, it may also be an artefact caused by
the assumptions of the chemical shift model for mesoporous materials
(Eq. (1)), which may not be valid because of the restricted accessibility
of the mesopores due to the moisture. Therefore, the fitting parameters
of the samples treated at the higher temperature (200 ◦ C) are expected to
represent more accurately the real physical properties (e.g., pore sizes)
of the REEPO4 samples. Sm (200) shows significantly higher δS, about
413 ppm, than La (200) and Lu (200) samples, most probably due to its
paramagnetic nature. The shift of Sm (80) sample is even higher, about
480 ppm. The shift of paramagnetic Yb (200), about 483 ppm, is slightly
higher than that of the other paramagnetic sample, Sm (200), and the
shift of Yb (80) is even higher, 550 ppm.
In the model described by Eq. (1), it is assumed that chemical shift of
Xe on the surface is independent of temperature. This is not true for
materials with paramagnetic ions, where the chemical shifts of the
neighboring nuclei are expected to be inversely dependent on temper
ature [70,72]:
A
δS (T) = δOS + .
T
Table 3
Parameters from modified Terskikh model for paramagnetic samples (Eq. (3)).
δO
S = orbital shift; D = mean pore diameter; Q = effective heat of adsorption; A =
constant associated with hyperfine interaction.
REE
a
δO
S (ppm)
D/ɳRK0
D (nm)
Q (kJ/
mol)
A (ppm K)
Sm
(200)
Yb (200)
265 ± 2
3500 ±
200
500 ± 50
40 ± 3
8.7 ± 0.2
5.7 ±
0.6
9.6 ± 0.3
22000 ±
3000
36400 ± 500
241 ± 5
a
The orbital shift δO
S was fixed to the value of δS of the diamagnetic sample
with similar phase reported in Tables 2 and i.e., δS of La (200) for Sm (200) and δS
of Lu (200) for Yb (200).
(2)
5
R. Khalili et al.
Microporous and Mesoporous Materials 344 (2022) 112209
determined by 129Xe NMR, of the Lu and Sm samples treated at the lower
temperature (80 ◦ C) appear to be larger than in the corresponding
samples treated at the higher temperature, but this is because of the
restricted access to the smaller mesopores due to moisture. The meso/
nanopore sizes experienced by fluids in the REEPO4 samples are very
difficult to interpret from the FESEM images, and therefore 129Xe NMR
analysis provides valuable additional information about the porous
structures.
The heats of adsorption (Q) for the samples treated at the higher
temperature are quite similar, ranging from 8.7 kJ/mol for Sm (200) to
10.1 kJ/mol for La (200). The values are within the range of heats of
adsorption of the silica gels (8–21 kJ/mol) [71].
3.4. Computational modelling of
129
Table 4
Calculated 129Xe chemical shifts (CSs) of xenon on monazite (LaPO4) and xen
otime (LuPO4) surfaces. The CS values calculated for the most common Miller
planes are shown along with the closest distances between Xe and REEPO4
surface atoms.
Phase
Surface
CS
(ppm)a
Xe–
REE
(Å)
Xe–P
(Å)
Xe–O
(Å)
Xe–
Ow
(Å)
Xe–
Hw
(Å)
Monazite
LaPO4
{010}
LuPO4
{100}
LuPO4
{110}
LuPO4
{101-Y}
381
3.86
4.21
3.41
3.58
3.96
185
4.99
4.48
3.50
3.62
3.01
240
3.84
4.69
3.43
3.62
2.75
243
3.86
4.28
3.47
3.55
3.21
Xenotime
Xenotime
Xenotime
Xe chemical shifts
Table 4 reports the calculated 129Xe chemical shifts (CSs) of xenon on
the diamagnetic monazite (70% of La sample) and xenotime (Lu sample)
surfaces. The structures used in the calculations included also surface
water (see Section 2.4), because, according to the TGA analysis [16], the
sample treatment at 200 ◦ C removes all free water, but surface water
evaporates only at higher temperatures. In this regard, the computed
129
Xe CSs are comparable with the experimental CSs of Xe on the sur
faces of REEPO4 samples (parameter δS in Table 2).
In the most common Miller plane for LaPO4 monazite, {010} [60],
the calculated CS is about 380 ppm, which is about 115 ppm higher than
experimentally observed CS of Xe on La (200) surface (265 ppm). There
are at least three conceivable reasons explaining the overestimation:
firstly, pure DFT functionals, like the current PBE, are known to lead to a
drastic (even on the order of 100 ppm) systematic overestimation of Xe
chemical shift in molecular environments [29,56]. Secondly, the
computed shift corresponds to one local minimum-energy configuration
with naturally high chemical shift due to the close vicinity to sur
rounding atoms, while in the experiments Xe is diffusing on the surface
and probing various other local energy minima, arguably leading to a
lower average CS. Thirdly, La (200) is not pure monazite, but it includes
also 30% of rhabdophane, which is not modelled here. Therefore, the
order of magnitudes of the experimental and computational CSs are
roughly in agreement, which provides support that the two-site ex
change model used for the analysis of experimental CSs (Eq. (1)) is
appropriate for the REEPO4 samples and the experimentally observed,
relatively large δS value is realistic. The modelled high CS can be un
derstood by looking at the optimized structure in Fig. S8: Xe atom has
sank close to the second-layer La ion. Therefore, it is surrounded by
several water molecules coordinated to the first-layer La ions, as well as
the phosphate groups in the first layer.
The most common Miller planes of LuPO4 xenotime (in descending
order) are {100}, {110} and {101-Y} [59]. Corresponding, calculated
129
Xe chemical shifts are 185, 240 and 242 ppm, and their average value
is 222 ppm. This is close to the experimental δS value of Lu (200), 241
ppm, which confirms, similarly to the case of La (200), the adequacy of
the experimental analysis. Considering the above-mentioned systematic
error due to the DFT functional it seems, however, that the modelled
smaller CS is somewhat underestimated. Detailed scrutiny of the three
optimized structures reveals that, on xenotime surfaces, Xe is not in
contact with the second-layer atoms but lies on top of the first water
layer in each of them. Hence, there are not so many neighboring atoms
that are close enough - as also displayed in distances in Table 4 - to
contribute to the increase of CS.
a
Chemical shifts were referenced with respect to the calculated free129Xe
atom nuclear shielding of 6007.64 ppm, corresponding to low-density Xe gas
chemical shift reference at 0 ppm.
water, which was present in the samples treated at the lower tempera
ture (80 ◦ C), restricted the access of hydrophobic Xe into mesopores.
129
Xe NMR analysis of the REEPO4 samples treated at the higher tem
perature (200 ◦ C, free water removed) enabled the determination of the
average sizes of mesopores explored by Xe gas. The size is largest (79
nm) for La, which has predominantly (70%) monazite phase (30%
rhabdophane), and smallest (6 nm) for Yb, which has xenotime phase.
The pore sizes of Lu and Yb (12 and 6 nm) differed by the factor of two
regardless of their similar xenotime phase structure. Interestingly, the
mesopore size experienced by Xe did not always follow the nanocrystal
size visible in the FESEM images. The heats of adsorption are quite
similar for all the REEPO4 samples, ranging from 8.7 kJ/mol for Sm
(200) to 10.1 kJ/mol for La (200). Computational modelling showed
that the relatively high experimentally observed 129Xe chemical shifts of
xenon adsorbed on diamagnetic REEPO4 surfaces (265 ppm for La (200);
241 ppm for Lu (200)) are realistic, providing support for the validity of
the analysis of the experimental chemical shifts by the two-site meso
pore model. The proposed, modified two-site exchange model for
paramagnetic materials renders the structural parameter values for the
Sm (200) and Yb (200) samples more realistic. Overall, this novel
analysis technique provides extraordinarily versatile information about
the structures of rare-earth element phosphates, which may be very
useful for developing their extraction processes and applications.
CRediT authorship contribution statement
Roya Khalili: Writing – original draft, Visualization, Investigation,
Data curation. Anu M. Kantola: Writing – review & editing, Supervi
sion, Investigation, Data curation. Sanna Komulainen: Writing – re
view & editing, Investigation, Data curation. Anne Selent: Writing –
review & editing, Investigation, Data curation. Marcin Selent: Writing –
review & editing, Investigation. Juha Vaara: Writing – review & edit
ing, Conceptualization. Anna-Carin Larsson: Writing – review & edit
ing, Supervision, Conceptualization. Perttu Lantto: Writing – review &
editing, Supervision, Investigation, Conceptualization. Ville-Veikko
Telkki: Writing – review & editing, Supervision, Resources, Funding
acquisition, Data curation, Conceptualization.
Declaration of competing interest
The authors declare that they have no known competing financial
interests or personal relationships that could have appeared to influence
the work reported in this paper.
4. Conclusions
We demonstrated, for the first time, the usefulness of 129Xe NMR in
the characterization of porous structures and adsorption properties of
rare-earth element phosphates. 129Xe spectra of xenon adsorbed on four
different REEPO4 samples (REE = La, Lu, Sm and Yb) turned out to be
very sensitive to both pore size and water content of the sample. Free
Data availability
Data will be made available on request.
6
R. Khalili et al.
Microporous and Mesoporous Materials 344 (2022) 112209
Acknowledgements
[28] B. Zhou, S. Komulainen, J. Vaara, V.-V. Telkki, Microporous Mesoporous Mater.
253 (2017) 49–54, />[29] M. Selent, J. Nyman, J. Roukala, M. Ilczyszyn, R. Oilunkaniemi, P.J. Bygrave,
R. Laitinen, J. Jokisaari, G.M. Day, P. Lantto, Chem. Eur. J. 23 (2017) 5258–5269,
/>[30] J. Roukala, J. Zhu, C. Giri, K. Rissanen, P. Lantto, V.-V. Telkki, J. Am. Soc. 137
(2015) 2464–2467, />[31] J. Jayapaul, S. Komulainen, V.V. Zhivonitko, J. Mareˇs, C. Giri, K. Rissanen,
P. Lantto, V.-V. Telkki, L. Schră
oder, Nat. Commun. 13 (2022) 1708, https://doi.
org/10.1038/s41467-022-29249-w.
[32] S. Komulainen, J. Roukala, V.V. Zhivonitko, M.A. Javed, L. Chen, D. Holden,
T. Hasell, A. Cooper, P. Lantto, V.-V. Telkki, Chem. Sci. 8 (2017) 5721–5727,
/>[33] S. E. Mailhiot, P. Peuravaara, R. J. Kearsey, B. D. Egleston, S. Komulainen, R. L.
Greenaway, A. I. Cooper, J. Vaara, P. Lantto, V.-V. Telkki, submitted for
publication (2022).
[34] O. Mankinen, J. Hollenbach, S. Ahola, J. Matysik, V.-V. Telkki, Microporous
Mesoporous Mater. 269 (2018) 75–78, />micromeso.2017.10.024.
[35] Y. Mao, N.K. Karan, R. Kumar, R. Hopson, P.R. Guduru, B.W. Shelon, L.-Q. Wang,
J. Vac. Sci. Technol., A 40 (2022), 043203, />[36] E. Dib, J. Rey, A. Vicente, S. Kunjir, H. Awala, S. Komaty, A. Daouli, T. Buˇcko, H.
E. Siblani, R. Bedard, J. Bricker, J.-P. Gilson, M. Badawi, S. Mintova, Microporous
Mesoporous Mater. 338 (2022), 111965, />micromeso.2022.111965.
[37] M. Wenzel, L. Eckert, K. Müller, D. Solonenko, C. Wiebeler, D.R.T. Zahn, D. Enke,
J. Matysik, Phys. Chem. Phys. Chem. 24 (2022) 14488–14497, />10.1039/D2CP00068G.
[38] J. Li, S. Mailhiot, H. Sreenivasan, A.M. Kantola, V.-V. Telkki, P. Kinnunen, Cement
Concr. Res. 155 (2022), 106779, />cemconres.2022.106779.
[39] K.S. Han, S.D. Burton, E.D. Walter, Y. Shin, W. Kuang, K.L. Simmons, J. Phys.
Chem. B 126 (2022) 3135–3142, />[40] G. Saielli, F. Castiglione, M. Mauri, R. Simonutti, A. Mele, ChemPhysChem 22
(2021) 1880–1890, />[41] M.A. Javed, S. Ahola, P. Håkansson, O. Mankinen, M.K. Aslam, A. Filippov, F.
U. Shah, S. Glavatskih, O.N. Antzutkin, V.-V. Telkki, Chem. Commun. 53 (2017)
11056–11059, />[42] D. Wisser, M. Hartmann, Adv. Mater. Interfac. 8 (2021), 2001266, />10.1002/admi.202001266.
[43] F. Hill-Casey, T. Hotchkiss, K.A. Hardstone, I. Hitchcock, V. Novak, C.M. Schlepütz,
T. Meersmann, G.E. Pavlovskaya, S.P. Rigby, Chem. Eng. J. 405 (2021), 126750,
/>[44] Y. Ma, L. Yu, H. Li, S. Zhang, Z. Wang, Y. Wang, J. Chen, Int. J. Biol. Macromol. 163
(2020) 1618–1623, />[45] D. Schneider, A.G. Attallah, S. Wassersleben, M. Wenzel, J. Matysik, R. KrauseRehberg, D. Enke, Microporous Mesoporous Mater. 307 (2020), 110515, https://
doi.org/10.1016/j.micromeso.2020.110515.
[46] C.D. Keenan, M.M. Herling, R. Siegel, N. Petzold, C.R. Bowers, E.A. Ră
ossler, J. Breu,
J. Senker, Langmuir 29 (2012) 643–652, />[47] M. Dvoyashkin, A. Wang, S. Vasenkov, C.R. Bowers, J. Phys. Chem. Lett. 4 (2013)
3263–3267, />[48] M.M. Spence, S.M. Rubin, I.E. Dimitrov, E.J. Ruiz, D.E. Wemmer, A. Pines, S.
Q. Yao, F. Tian, P.G. Schultz, Proc. Natl. Acad. Sci. U.S.A. 98 (2001) 10654–10657,
/>[49] L. Schră
oder, T.J. Lowery, C. Hilty, D.E. Wemmer, A. Pines, Science 314 (2006)
446–449, />[50] G. Huber, T. Brotin, L. Dubois, H. Desvaux, J.-P. Dutasta, P. Berthault, J. Am.
Chem. Soc. 128 (2006) 6239–6246, />[51] G.K. Seward, Y. Bai, N.S. Khan, I. Dmochowski, J. Chem. Sci. 2 (2011) 1103–1110,
/>[52] M.S. Albert, G.D. Cates, B. Driehuys, W. Happer, B. Saam, C.S. Springer Jr.,
A. Wishnia, Nature 370 (1994) 199–201, />[53] C. Hilty, E.E. McDonnell, J. Granwehr, K.L. Pierce, S. Han, A. Pines, Proc. Natl.
Acad. Sci. U.S.A. 102 (2005) 14960–14963, />pnas.0605396103.
[54] Q. Zeng, Q. Guo, Y. Yuan, B. Wang, M. Sui, X. Lou, L.-S. Bouchard, X. Zhou,
iScience 24 (2021), 103515, />[55] A.S. Khan, R.L. Harvey, J.R. Birchall, R.K. Irwin, P. Nikolaou, G. Schrank,
K. Eamami, A. Dummer, M.J. Barlow, B.M. Goodson, E.Y. Chekmenev, Angew.
Chem. Int. Ed. 60 (2021) 22126–22147, />[56] M. Straka, P. Lantto, J. Vaara, J. Phys. Chem. A 112 (2008) 2658–2668, https://
doi.org/10.1021/jp711674y.
[57] J. Karjalainen, J. Vaara, M. Straka, P. Lantto, Phys. Chem. Chem. Phys. 17 (2015)
7158–7171, />[58] V.A. Hackley, L.S. Lum, V. Gintautas, Inside NIST (2004) 7097, />10.6028/NIST.IR.7097.
[59] S. Roy, L. Wu, S.G. Srinivasan, A.G. Stack, A. Navrotsky, V.S. Bryantsev, Phys.
Chem. Chem. Phys. 22 (2020) 7719–7727, />[60] X. Zhao, X. Yang, Y. Li, R. Ahuja, J. Phys. Chem. C 124 (2020) 22173–22184,
/>[61] R. Rüger, M. Franchini, T. Trnka, A. Yakovlev, E. Van Lenthe, P. Philipsen, T. Van
Vuren, B. Klumpers, T. Soini, AMS 2021.1, SCM, Theoretical Chemistry,
Amsterdam, The Netherlands, Vrije Universiteit. .
The authors acknowledge financial support from the European
Research Council (ERC) under Horizon 2020 (H2020/2018–2022/ERC
grant agreement no. 772110), Academy of Finland (grant nos. 331008
and 340099), Formas project 2018–00630, and Kvantum institute
(University of Oulu). Computational resources due to CSC (Espoo,
Finland) and the Finnish Grid and Cloud Infrastructure project (persis
tent identifier urn:nbn:fi:research-infras-2016072533), were used. Part
of the work was carried out with the support of the Center for Material
Analysis, University of Oulu, Finland.
Appendix A. Supplementary data
Supplementary data to this article can be found online at https://doi.
org/10.1016/j.micromeso.2022.112209.
References
[1] B. Zhou, Z. Li, C. Chen, Minerals 7 (2017) 203, />min7110203.
[2] A. Ochiai, S. Utsunomiya, Minerals 7 (2017) 84, />min7050084.
[3] S. Gai, C. Li, P. Yang, J. Lin, Chem. Rev. 114 (2014) 2343–2389, />10.1021/cr4001594.
[4] S.N. Achary, S. Bevara, A.K. Tyagi, Coord. Chem. Rev. 340 (2017) 266–297,
/>[5] M.R. Rafiuddin, A.P. Grosvenor, Inorg. Chem. 55 (2016) 9685–9695, https://doi.
org/10.1021/acs.inorgchem.6b01471.
[6] H. Hayashi, K. Torii, S.I. Nakata, J. Mater. Chem. 7 (1997) 557–562, https://doi.
org/10.1039/A606397G.
[7] Y. Hikichi, C.F. Yu, M. Miyamoto, S. Okada, Mineral. J. J-stage 15 (1990) 349–355,
/>[8] Y. Hikichi, C.F. Yu, M. Miyamoto, S. Okada, J. Alloys Compd. 192 (1993) 102–104,
/>[9] S. Lucas, E. Champion, D. Bernache-Assollant, G. Leroy, J. Solid State Chem. 177
(2004) 1312–1320, />[10] N. Clavier, A. Mesbah, S. Szenknect, N. Dacheux, Spectrochim. Acta Mol. Biomol.
Spectrosc. 205 (2018) 85–94, />[11] T. Subramani, M.R. Rafiuddin, A. Shelyug, S. Ushakov, A. Mesbah, N. Clavier,
D. Qin, S. Szenknect, E. Elkain, N. Dacheux, A. Navrotsky, Cryst. Growth Des. 19
(2019) 4641–4649, />[12] Y. Ni, J.M. Hughes, A.N. Mariano, Am. Mineral. 80 (1995) 21–26, />10.2138/am-1995-1-203.
[13] A. Mesbah, N. Clavier, E. Elkaim, S. Szenknect, N. Dacheux, J. Solid State Chem.
249 (2017) 221–227, />[14] D. Bregiroux, F. Audubert, D. Bernache-Assollant, Ceram. Int. 35 (2009)
1115–1120, />[15] L. Karpowich, S. Wilcke, R. Yu, R. Yu, G. Harley, J.A. Reimer, L.C. Jonghe, J. Solid
State Chem. 180 (2007) 840–846, />[16] R. Khalili, A.-C. Larsson, V.-V. Telkki, P. Lantto, A.M. Kantola, J. Solid State Chem.
311 (2022), 123097, />[17] T.G. Walker, W. Happer, Rev. Mod. Phys. 69 (1997) 629–642, />10.1103/RevModPhys.69.629.
[18] D.A. Barskiy, A.M. Coffey, P. Nikolaou, D.M. Mikhaylov, B.M. Goodson, R.
T. Branca, G.J. Lu, M.G. Shapiro, V.-V. Telkki, V.V. Zhivonitko, I.V. Koptyug, O.
G. Salnikov, K.V. Kovtunov, V.I. Bukhtiyarov, M.S. Rosen, M.J. Barlow, S. Safavi, I.
P. Hall, L. Schră
oder, E.Y. Chekmenev, Chem. Eur. J. 23 (2016) 725–751, https://
doi.org/10.1002/chem.201603884.
[19] N.J. Rogers, F. Hill-Casey, K.F. Stupic, J.S. Six, C. Lesbats, S.P. Rigby, J. Fraissard,
G.E. Pavlovskaya, T. Meersmann, Proc. Natl. Acad. Sci. U.S.A. 113 (2016)
3164–3168, />[20] E. Weiland, M.A. Springuel-Huet, A. Nossov, A. G´ed´eon, Microporous Mesoporous
Mater. 225 (2016) 41–65, />[21] Q. Zeng, B. Bie, Q. Guo, Y. Yuan, Q. Han, X. Han, M. Chen, X. Zhang, Y. Yang,
M. Liu, P. Liu, H. Deng, X. Zhou, Proc. Natl. Acad. Sci. U.S.A. 117 (2020)
17558–17563, />[22] F. Kolbe, S. Krause, V. Bon, I. Senkovska, S. Kaskel, E. Brunner, Chem. Mater. 31
(2019) 6193–6201, />[23] J. Demarquay, J. Fraissard, Chem. Phys. Lett. 136 (1987) 314–318, https://doi.
org/10.1016/0009-2614(87)80258-0.
[24] V.V. Terskikh, I.L. Moudrakovski, S.R. Breeze, S. Lang, C.I. Ratcliffe, J.
A. Ripmeester, A. Sayari, Langmuir 18 (2002) 5653–5656, />10.1021/la025714x.
[25] V.-V. Telkki, J. Lounila, J. Jokisaari, J. Chem. Phys. 124 (2006), 034711, https://
doi.org/10.1021/jp076760e.
[26] V.-V. Telkki, C. Hilty, S. Garcia, E. Harel, A. Pines, J. Phys. Chem. B 111 (2007)
13929–13936, />[27] M.-A. Springuel-Huet, A. Nossov, F. Guenneau, A. G´ed´
eon, Chem. Commun. 49
(2013) 7403, />
7
R. Khalili et al.
Microporous and Mesoporous Materials 344 (2022) 112209
[62] C. Bannwarth, E. Caldeweyher, S. Ehlert, A. Hansen, P. Pracht, J. Seibert,
S. Spicher, S. Grimme, WIREs Comput. Mol. Sci. 11 (2021), e1493, />10.1002/wcms.1493.
[63] S. Grimme, C. Bannwarth, P. Shushkov, J. Chem. Theor. Comput. 13 (2017)
1989–2009, />[64] S.J. Clark, M.D. Segall, C.J. Pickard, P.J. Hasnip, M.I.J. Probert, K. Refson, M.
C. Payne, Z. Kristallogr. 220 (2005) 567–570, />zkri.220.5.567.65075.
[65] J.P. Perdew, K. Burke, M. Ernzerhof, Phys. Rev. Lett. 77 (1996) 3865–3868,
/>[66] S. Grimme, J. Comput. Chem. 27 (2006) 1787–1799, />jcc.20495.
[67] C.J. Pickard, F. Mauri, Phys. Rev. B 63 (2001), 245101, />PhysRevB.63.245101.
[68] J.R. Yates, C.J. Pickard, F. Mauri, Phys. Rev. B 76 (2007), 024401, />10.1103/PhysRevB.76.024401.
[69] A. Abragam, The Principles of Nuclear Magnetism, Clarendon, Oxford, 1974.
[70] I. Bertini, C. Luchinat, G. Parigi, Solution NMR of Paramagnetic Molecules,
Elsevier, Amsterdam, 2001.
[71] V.-V. Terskikh, I.L. Mudrakovskii, V.M. Mastikhin, J. Chem. Soc. Faraday. Trans.
89 (1993) 4239–4243, />[72] R.J. Kurland, B.R. McGarvey, J. Magn. Reson. 2 (1970) 286–301, />10.1016/0022-2364(70)90100-9.
8