Báo cáo khoa học: Purification and properties of the glutathione S-transferases from the anoxia-tolerant turtle, Trachemys scripta elegans pdf
Bạn đang xem bản rút gọn của tài liệu. Xem và tải ngay bản đầy đủ của tài liệu tại đây (234.87 KB, 13 trang )
Purification and properties of the glutathione
S-transferases from the anoxia-tolerant turtle, Trachemys
scripta elegans
William G. Willmore and Kenneth B. Storey
Institute of Biochemistry, Carleton University, Ottawa, Ontario, Canada
The glutathione S-transferases (GSTs) belong to a
multigene enzyme superfamily which catalyze the
nucleophilic addition of the thiol of reduced gluta-
thione (GSH) to a variety of electrophiles [1–7]. Thus,
they provide protection, not only against electrophiles
which tend to be toxic to the cell, but also against
oxidants which they reduce.
The GSTs are homodimers or heterodimers com-
prised of pairings of seven different subunits [5,8]. Five
main classes of GSTs exist, each containing more than
one isozyme based on substrate affinity and inhibitor
properties. The cytosolic classes have been named
alpha (a), mu (l), pi (p) and theta (h) based on
their subunit composition, substrate ⁄ inhibitor speci-
ficity, primary and tertiary structure similarities and
immunological identity [8]. The fifth class is the micro-
somal form of the enzyme. Specific GST subunits are
induced by various xenobiotics and are expressed in a
tissue specific manner [9]. Expression of GST subunits
is under the control of the antioxidant ⁄ electrophile
response element (ARE ⁄ EpRE) to which members of
the bZIP family of transcription factors (Nrf2 and
Maf G ⁄ K) bind [10]. The enzymes contain two binding
sites within the active site, a G-site for the binding of
GSH and a H-site for the binding of an electrophile.
Electrophiles have a slow spontaneous rate of reaction
with GSH which is greatly enhanced in the presence
of GST.
Electrophilic substrates for GST include xenobiotics
such as carcinogens and their metabolites, herbicides
Keywords
Adaptation; anoxia; glutathione
S-transferases; turtle
Correspondence
W. G. Willmore, Institute of Biochemistry,
Carleton University, Ottawa, Ontario,
K1S 5B6, Canada
Fax: +01 613 520 3539
Tel: +01 613 520 2600, ext. 1211
E-mail:
Website: />(Received 28 March 05, revised 17 May 05,
accepted 20 May 05)
doi:10.1111/j.1742-4658.2005.04783.x
Glutathione S-transferases (GSTs) play critical roles in detoxification,
response to oxidative stress, regeneration of S-thiolated proteins, and cata-
lysis of reactions in nondetoxification metabolic pathways. Liver GSTs
were purified from the anoxia-tolerant turtle, Trachemys scripta elegans.
Purification separated a homodimeric (subunit relative molecular mass ¼
34 kDa) and a heterodimeric (subunit relative molecular mass ¼ 32.6 and
36.8 kDa) form of GST. The enzymes were purified 23–69-fold and 156–
174-fold for homodimeric and heterodimeric GSTs, respectively. Kinetic
data gathered using a variety of substrates and inhibitors suggested that
both homodimeric and heterodimeric GSTs were of the a class although
they showed significant differences in substrate affinities and responses to
inhibitors. For example, homodimeric GST showed activity with known a
class substrates, cumene hydroperoxide and p-nitrobenzylchloride, whereas
heterodimeric GST showed no activity with cumene hydroperoxide. The
specific activity of liver GSTs with chlorodinitrobenzene (CDNB) as the
substrate was reduced by 2.6- and 8.7-fold for homodimeric and hetero-
dimeric GSTs isolated from liver of anoxic turtles as compared with aerobic
controls, suggesting an anoxia-responsive stable modification of the protein
that may alter its function during natural anaerobiosis.
Abbreviations
ARE, antioxidant response element; CDNB, chlorodinitrobenzene; EpRE, electrophile response element; GST, glutathione S-transferase;
GSH, reduced glutathione.
3602 FEBS Journal 272 (2005) 3602–3614 ª 2005 FEBS
and mutagens. In addition, GSTs bind with varying
affinities to a variety of hydrophobic compounds such
as heme, bilirubin, polycyclic aromatic hydrocarbons
and dexamethasone [7]. Endogenous second substrates
for GST are toxic products generated from tissue dam-
age. These include the compounds resulting from lipid
peroxidation of biological membranes such as reactive
alkenes, epoxides, hydroperoxides and aldehydes.
These may be the primary substrates of the micro-
somal or membrane-bound GST in the same way as
they are the substrates for Se-dependent glutathione
peroxidases (the ‘classical’ and a more recently discov-
ered phospholipid hydroperoxide glutathione peroxi-
dase) [11]. Most conjugated products of GSTs are
cytotoxic and therefore must be eliminated. Glutathi-
one S-conjugated products are exported from cells (in
particular, from liver cells where cytotoxins are con-
centrated) via a membrane ATP-dependent pump
known as the glutathione S-conjugate export pump
[12,13], converted to mercapturic acids in the kidney
and epithelial cells, and excreted in the urine [8].
Numerous lower vertebrates show well-developed
tolerance for long-term oxygen deprivation and studies
in recent years have demonstrated that anoxia toler-
ance includes not just biochemical adjustments that
deal with the metabolic and energetic consequences of
survival without oxygen but also adaptations of anti-
oxidant defenses that help to limit oxidative stress on
cells when oxygen is reintroduced [14,15]. The best ver-
tebrate facultative anaerobes are freshwater turtles of
the genera Trachemys and Chrysemys. These can sur-
vive for several weeks submerged in deoxygenated
water at cold temperatures, an adaptation that sup-
ports winter survival in ice-locked ponds [14]. Liver
and heart GST activities decreased significantly after
20 h of anoxic submergence in the red-eared slider,
Trachemys scripta elegans [16], indicating that the
enzyme responded to anoxia stress. This change could
result from one or more factors such as a change in
the amount of GST protein present, a covalent modifi-
cation of GST that alters its properties, or a change in
the mixture of GST isozymes present in the organ to
better suit the enzyme for function under anoxic condi-
tions. Stress-related changes in the maximal activities
of GST are known to occur in many stress-tolerant
organisms. For example, the maximal activities of
GST increased during anoxia exposure in brain of the
leopard frog Rana pipiens [17] but decreased during
freezing in kidney and heart of the wood frog Rana
sylvatica [18]. A decrease in maximal GST activity also
occurred during estivation in liver and four other
organs of the spadefoot toad Scaphiopus couchii [19].
In the present study, two GST isoforms were puri-
fied from liver of the anoxia tolerant turtle, T. s. ele-
gans. Analysis of kinetic and inhibitory properties
characterized these as alpha class GSTs but the two
forms showed a variety of distinctive differences. The
specific activities of both were reduced in anoxic liver
suggesting anoxia-responsive regulation of GST.
Results
GST Purification
Table 1 summarizes the purification of turtle liver
GSTs using Matrix Red dye ligand chromatography,
Sephacryl S-200 gel filtration and hydroxylapatite ion
exchange chromatography. GST activity from liver of
both aerobic and anoxic turtles eluted from the Matrix
Red column in a single peak at 440 mm KCl (data
not shown). Elution from Matrix Red gave a 3.7-fold
purification with 86% yield of the control liver
enzyme. With the anoxic enzyme, however, this col-
umn gave no purification (no change in specific activ-
ity) but it was used anyway so that both enzymes were
treated alike. Typical elution profiles from Sephacryl
Table 1. Purification of GST from liver of control and anoxic turtles. Enzyme activity was assayed using optimal CDNB and GSH concentra-
tions. Results are from a single purification but all other trials yielded similar results.
Column
Control Liver Anoxic Liver
Specific activity Specific activity
(UÆmg
)1
protein) Fold purification % yield (UÆmg
)1
protein) Fold purification % yield
Supernatant 0.319 1.00 100 0.0408 1.00 100
Matrix Red 1.17 3.67 86.0 0.0335 0.821 95.9
Sephacryl S-200 11.6 36.4 108 5.91 145 113
Hydroxylapatite
(Peak 1)
7.31 22.9 103 2.80 68.6 117
Hydroxylapatite
(Peak 2)
55.4 174 6.37 156
W. G Willmore and K. B. Storey GST function in anoxia-tolerant turtles
FEBS Journal 272 (2005) 3602–3614 ª 2005 FEBS 3603
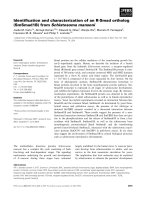
S-200 are shown in Fig. 1 for GSTs from control and
anoxic turtle liver. Both enzymes eluted in a single
peak with a calculated mean molecular mass of the
native dimer being 59.8 ± 3.25 kDa. Elution from
Sephacryl S-200 resulted in an activation of the
enzyme (125 and 118% yield as compared with the
activity after the Matrix Red column and 108 and
113% as compared with the crude extract for control
and anoxic enzymes, respectively). The increase in spe-
cific activity at this purification step suggested the
possible loss of a low molecular mass repressor of the
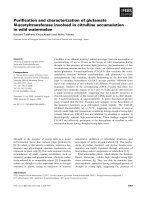
enzyme. A typical elution profile for control and
anoxic turtle liver GSTs off hydroxylapatite is shown
in Fig. 2. Two peaks eluted in both cases at about 98
and 131 mm KPi, respectively. The portion of total
activity that was present in Peak 2 was higher in sam-
ples from anoxic liver than in aerobic liver, the Peak
1 ⁄ Peak 2 ratio being 1.46 : 1 for the enzyme from con-
trol preparations and 1.03 : 1 for anoxic preparations
(assayed with CDNB as the substrate). The combined
yield of GST activity in the two peaks was 103% for
control and 117% for anoxic enzymes, respectively,
compared with the crude supernatant (Table 1). No
activity with H
2
O
2
as a substrate was detected in either
of the CDNB-utilizing GST peaks that were eluted
from the hydroxylapatite column indicating that this
column had separated Se-dependent GPOX activity
from GST. No new peaks of GST activity were seen
in the elution profiles off any column when isolations
from anoxic liver were compared with aerobic liver. It
was therefore concluded that no new isozymes of GST
were produced during anoxia exposure. Subsequent
kinetic studies characterized the properties of GST in
hydroxylapatite Peaks 1 and 2 from control liver.
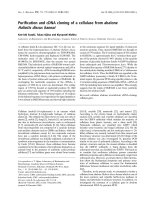
Isoelectric focusing
Isoelectric focusing of GSTs from liver of aerobic and
anoxic turtles is shown in Fig. 3. In both cases, turtle
liver GSTs separated into two peaks; pI values were
8.5 and 8.7 for the larger peak and 6.1 and 6.8 for the
smaller peak in aerobic vs. anoxic preparations,
respectively, using CDNB as a substrate. The larger
shift in pI values for the smaller peak possibly repre-
sents an anoxia-dependent stable modification of the
enzyme. When cumene hydroperoxide was used as a
substrate, the glutathione peroxidase activity of turtle
liver GSTs was tested. The ratio of cumene hydroper-
oxide to CDNB activities was 0.37 to 0.39 for Peak 1
and either 0.58 or 0.81 for control and anoxic turtle
Fig. 1. Typical profiles of GST elution from Sephacryl S-200 for the
liver enzyme from control and anoxic T. s. elegans. Activities are
expressed relative to peak fractions which were set at 100%. GST
activity from control and anoxic turtle liver pools eluted in one peak
at the same molecular mass (between 56.5 and 63.0 kDa). Stand-
ards were Blue Dextran (BD; 2000 kDa), phosphofructokinase (PFK;
360 kDa), pyruvate kinase (PK; 238 kDa), aldolase (ALD; 150 kDa),
hexokinase (HK; 102 kDa), hemoglobin (Hb; 64.5 kDa), and cyto-
chrome c (Cyt c; 13.7 kDa). d, s, control and anoxic isolations,
respectively.
Fig. 2. Typical profiles for GST elution from hydroxylapatite for the
liver enzyme from control and anoxic T. s. elegans. Activities are
expressed relative to peak fractions which were set at 100%. The
column was eluted with a 0–250 m
M gradient of potassium phos-
phate. GST activity eluted in two peaks at 98 and 131 m
M KP
i
for
Peak 1 and Peak 2, respectively. The percentage of total GST activ-
ity present in Peak 2 increased during anoxia. d, s, control and
anoxic isolations, respectively.
GST function in anoxia-tolerant turtles W. G Willmore and K. B. Storey
3604 FEBS Journal 272 (2005) 3602–3614 ª 2005 FEBS
liver GSTs, respectively, for Peak 2 (Table 2). The
increase in the ratio of activities for anoxic liver GSTs
for Peak 2 was due primarily to a decrease in CDNB
activity. No activity with H
2
O
2
as the substrate was
detected in either peak.
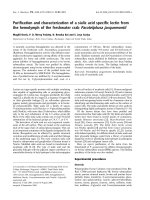
SDS/PAGE
The results of SDS ⁄ PAGE of turtle liver GSTs, puri-
fied to homogeneity, are shown in Fig. 4A; lane 3
shows the Peak 1 enzyme and lane 4 shows the Peak 2
enzyme eluted from the hydroxylapatite column. A
comparison with equine liver GST is also shown in
lane 2. Using the standard curve constructed from the
protein standards (Fig. 4B), the molecular mass of the
Peak 1 GST subunit was determined to be 34.0 kDa
(Table 2). Peak 2 showed 2 subunits of 36.8 and
32.6 kDa. All turtle liver subunits were larger than the
two equine liver subunits (28.9 and 21.1 kDa). It was
concluded that GST in Peak 1 is a homodimer with an
approximate molecular mass of 68 kDa (homGST)
whereas GST in Peak 2 is a heterodimer with an
approximate mass of 69.4 kDa (hetGST); both are lar-
ger than equine liver GST which is a heterodimer of
50.0 kDa.
Fig. 3. Isoelectric focusing profiles of liver GST from control (A) and
anoxic (B) T. s. elegans. Activities are expressed relative to peak
fractions which were set at 100%. Two peaks of GST activity were
found in both control and anoxic situations. In both cases the activ-
ity profile with cumene hydroperoxide activity as the substrate (h)
matched the profile for CDNB activity (d). s, pH.
Table 2. General characteristics of GSTs purified from turtle liver.
Results are means ± SEM, n ¼ 3 determinations on independent
preparations; otherwise n ¼ 1. Units are corrected for the volume
assayed.
Hydroxylapatite
(Peak 1)
Hydroxylapatite
(Peak 2)
Arrhenius activation energy
(E
a
) (kJÆmol
)1
)
36 ± 2.2 40 ± 3.7
pH optimum 7.2 7.2
Molecular mass (Da) 34 000 36 800
(subunit 1)
32 600
(subunit 2)
Specific activity using CDNB (UÆmg protein
)1
)
Control 7.3 ± 0.38 55 ± 5.8
a
Anoxic 2.8 ± 0.051
b
6.4 ± 0.098
a,b
Specific activity using cumene hydroperoxide (UÆmg protein
)1
)
Control 1.8 ± 0.054 0
Anoxic 0.94 ± 0.0086
b
0
Isoelectric
Focusing
(Peak 1)
Isoelectric
Focusing
(Peak 2)
pI
Control 8.5 ± 0.24
c
6.1 ± 0.26
Anoxic 8.7 ± 0.10
c
6.8 ± 0.26
CDNB activity (UÆmL
)1
of peak fraction assayed)
Control 1.9 0.46
Anoxic 1.7 0.26
Cumene hydroperoxide activity (UÆmL
)1
of peak fraction assayed)
Control 0.72 0.26
Anoxic 0.61 0.21
Ratio of cumene hydroperoxide to CDNB activities
Control 0.39 0.58
Anoxic 0.37 0.81
a
Significantly different from Peak 1-values as assessed by a two-
tailed Student’s t-test, P < 0.005;
b
significantly different from aero-
bic control values P < 0.005;
c
major peak activity using CDNB.
W. G Willmore and K. B. Storey GST function in anoxia-tolerant turtles
FEBS Journal 272 (2005) 3602–3614 ª 2005 FEBS 3605
Kinetic and inhibition characteristics
The specific activity of purified GST in Peaks 1 and 2
changed dramatically between aerobic and anoxic
states, in all cases decreasing significantly (P<0.005)
in the anoxic state (Table 2). With CDNB as the sub-
strate, the specific activity of purified Peak 1 GST was
7.3 ± 0.38 UÆmg
)1
protein for the aerobic control
enzyme and fell by 62% to 2.8 ± 0.05 UÆmg
)1
protein
in anoxia. Peak 1 activity using cumene hydroperoxide
as the substrate similarly decreased by 47% from
an aerobic value of 1.8 ± 0.054 UÆmg
)1
protein to
an anoxic value or 0.94 ± 0.0086 UÆmg
)1
protein.
Activity of Peak 2 GST with CDNB changed even
more dramatically, decreasing by 89% from 55.4 ±
5.8 UÆmg
)1
protein for the aerobic enzyme to 6.4 ±
0.098 UÆmg
)1
protein in anoxia. Activity using cumene
hydroperoxide as a substrate was not detected in Peak
2 off hydroxylapatite.
Substrate and inhibitor profiles of Peaks 1 and 2
GST isozymes off of hydroxylapatite from aerobic
control liver are summarized in Table 3. Peak 1 GST
had a greater affinity for GSH, with a K
m
that was
only 63% of the Peak 2-value. By contrast, Peak 2
GST had a greater affinity for CDNB with a K
m
that
was 67% of the Peak 1 enzyme. Peak 1 GST could use
A
B
Fig. 4. SDS ⁄ PAGE of purified GSTs from liver of control T. s. ele-
gans. (A) A 15% acrylamide gel was run, lane 1, mass standards;
2, horse liver GST (Sigma); 3, turtle liver GST from Peak 1; 4, turtle
liver GST from Peak 2. The standards were myosin (200 kDa), b-ga-
lactosidase (116 kDa), phosphorylase B (97.4 kDa), serum albumin
(66.2 kDa), ovalbumin (45 kDa), carbonic anhydrase (31 kDa),
trypsin inhibitor (21.5 kDa), lysozyme (14.5 kDa) and aprotinin
(6.5 kDa). (B) Standard curve used to determine the subunit
molecular mass of turtle GSTs. The positions of GST subunits are
shown (s).
Table 3. Kinetic parameters of GST isozymes purified from aerobic
turtle liver. Results are means ± SEM, n ¼ 3 independent determi-
nations.
Effector
Hydroxylapatite
(Peak 1)
Hydroxylapatite
(Peak 2)
K
m
GSH (mM) 0.38 ± 0.019 0.60 ± 0.064
a
K
m
CDNB (mM) 1.7 ± 0.15 1.14 ± 0.040
a
K
m
Cumene hydroperoxide
(m
M)
0.11 ± 0.021 No activity
I
50
GSSG (mM) 2.0 ± 0.19 2.6 ± 0.57
I
50
Cibacron Blue (lM) 48 ± 0.97 8.4 ± 0.38
b
I
50
Rose Bengal (lM) 0.31 ± 0.016 0.47 ± 0.085
I
50
S-hexylglutathione (lM) 0.31 ± 0.036 0.39 ± 0.19
I
50
iodoacetamide (mM) 40 ± 0.46 8.7 ± 0.33
b
I
50
KCl (M) 0.33 ± 0.039 0.18 ± 0.020
a
I
50
NaCl (M) 0.332 ± 0.0341 0.17 ± 0.012
a
I
50
Na
2
SO
4
(M) No inhibition 0.19 ± 0.045
I
50
NH
4
Cl (M) 0.20 ± 0.020 0.12 ± 0.010
a
I
50
Na acetate (M) No inhibition No inhibition
Other substrates tested (specific activity in UÆmg
)1
; n ¼ 1 deter-
mination)
1,2-dichloro-4-nitrobenzene
(1 m
M)
0.0035 0.0090
p-Nitrobenzylchloride (1 m
M) 0.18 0.28
p-Nitrophenylacetate (1 m
M) 0.15 1.2
a
Significantly different from the corresponding Peak 1-value via the
Student’s t-test P < 0.05;
b
P < 0.001.
GST function in anoxia-tolerant turtles W. G Willmore and K. B. Storey
3606 FEBS Journal 272 (2005) 3602–3614 ª 2005 FEBS
cumene hydroperoxide as a substrate but Peak 2 GST
could not. Neither enzyme showed activity with H
2
O
2
indicating that Se-dependent GPOX activity was not
present in either peak. Several other potential GST
substrates were also tested for catalytic activity. Nei-
ther enzyme showed activity with ethacrynic acid,
trans-4-phenyl-3-buten-2-one or 1,2-epoxy-3-(p-nitro-
phenoxy) propane. Peak 2 GST showed 2.56-, 1.56-,
and 7.93-fold greater activity than Peak 1 GST using
1,2-dichloro-4-nitrobenzene, p-nitrobenzylchloride, and
p-nitrophenylacetate, respectively. Responses to inhibi-
tors also characterize different GST isoforms. Ciba-
cron Blue and iodoacetamide were both much stronger
inhibitors of Peak 2 GST with I
50
values that were just
18–22% that of the corresponding Peak 1-values. Peak
2 GST was also more strongly inhibited by chloride
salts (KCl, NaCl, NH
4
Cl) with I
50
values that were
52–60% of the corresponding values for Peak 1 GST.
Sodium acetate did not inhibit either enzyme and
sodium sulfate inhibited only Peak 2 GST. Rose ben-
gal, hexylglutathione, and the GSSG product of the
GST reaction inhibited both turtle liver GST isozymes
to a similar extent.
Temperature and pH dependence
Fig. 5 shows pH curves for Peak 1 and Peak 2 GSTs
from aerobic turtle liver. The pH optimum of both
enzymes was 7.2 (Table 2). Activity declined relatively
slowly on the acidic side so that about 40% of activity
still remained at pH 6 whereas activity fell sharply at
higher pH values with almost no activity remaining at
pH 7.6 and above.
Arrhenius plots for Peaks 1 and 2 GSTs are shown
in Fig. 6. Both enzymes showed a straight line rela-
tionship over the full range of temperatures tested
(5–40 °C). Calculated activation energies (Ea) were
36 ± 2.2 and 40 ± 3.7 kJÆmol
)1
for Peak 1 and Peak 2
GST, respectively, and were not significantly different.
Discussion
Freshwater species of turtles (T. s. elegans and Chryse-
mys picta bellii) can survive extended periods of sub-
mergence past the point at which internal oxygen
reserves are exhausted. These species tolerate oxygen
deprivation for a day or more at 20 °C and at least
3 months at 3 °C [20]. Such conditions occur during
overwintering hibernation in ice-covered rivers and
ponds where the water becomes quite hypoxic and tur-
tle bury themselves in anoxic mud [21]. The hallmarks
of anoxia tolerance in turtles include a profound
lowering of metabolic rate and a buffering of lactic
acidosis [22]. The magnitude of metabolic depression
can be 10–20% of the normoxic rate and can be
further decreased to 0.1% due to Q
10
effects of tem-
perature. During hibernation, plasma lactic acid load
can climb to as high as 150–200 mm [23,24]. In non-
tolerant organisms, the drop in plasma pH can be as
large as a full pH point [25]. Freshwater turtles coun-
ter this acid load by buffering it with bicarbonate,
Ca
2+
, and Mg
2+
ions from the shell [26]. In terms of
their biochemistry, the enzymes of freshwater turtles
must work optimally at low pHs during acid load.
The current study shows that turtle GSTs function
optimally under acidic conditions occurring under
anaerobiosis.
Turtles, being ectotherms, will have lower metabolic
rates than those of endotherms of comparative sizes
[22]. A drop in environmental temperature will lower
an ectotherm’s metabolism even further due to Q
10
effects [22]. Therefore, the activities of turtle enzymes
normally differ from those of mammalian vertebrates
at their respective biological temperatures and oxygen
exposure. With temperature differences taken into
account, Na
+
⁄ K
+
ATPase and creatine kinase activit-
ies are two- to threefold higher in rat than in turtle
brain, whereas hexokinase and lactate dehydrogenase
Fig. 5. pH profiles of GSTs purified from liver of control turtles.
Data are means ± SEM for n ¼ 3 trials performed on a single
enzyme preparation. Where error bars are not visible, they are con-
tained within the symbol. Phosphate buffer was used and pH was
confirmed immediately prior to and following the assay; the pH val-
ues shown are the average of these two values. Peak 1 (d, lines)
and Peak 2 (s, dotted lines) GST had pH optima of 7.20 and 7.21,
respectively.
W. G Willmore and K. B. Storey GST function in anoxia-tolerant turtles
FEBS Journal 272 (2005) 3602–3614 ª 2005 FEBS 3607
activities were found to be similar [27]. This is consis-
tent with the idea that lower rates of Na
+
and K
+
pump fluxes result in lower rates of aerobic energy
metabolism in turle brains compared with rat brains.
Superoxide dismutase activities in turtle brain, lung
and skeletal muscle, but not liver or cardiac muscle
were found to be significantly lower than those found
in mouse and rabbit [28]. This shows the relationship
between SOD activities and oxygen exposure in verte-
brate species. The GST activities in the current study
were measured at room temperature to remove any
temperature effects on enzyme activities that normally
occur during over-wintering hibernation.
The maximum activity of GST in T. s. elegans liver
was previously found to decrease by 25% over 20 h of
anoxia exposure and this suggested a possible role for
changes in GST activity in the support of anaerobiosis
[16]. The mechanism of GST modulation in anoxia
could take one of several forms and, hence, this study
of turtle liver GST was undertaken to identify any
anoxia-responsive changes in isozymic forms, specific
activities, and kinetic properties of the enzyme. The
current data document the presence of two isozymes of
GST in turtle liver that are separable by column chro-
matography and isoelectric focusing but did not find
evidence of a change in the expression pattern of either
isozyme during anoxia or of the expression of novel
GST isozymes under anoxia. However, the effect of
anoxia exposure on liver GST activity was profound
when the purified enzymes were examined; the specific
activities of purified Peak 1 and 2 GSTs from anoxic
liver were only 38 and 11%, respectively, of the corres-
ponding values for the aerobic enzymes (Table 2). This
suggests that the GST protein may undergo a stable
modification in response to anoxia that lowers its spe-
cific activity and may also affect other kinetic pro-
perties. To date, there have been no reports in the
literature that GSTs are regulated by post-translational
modification. Most GSTs are regulated by a change in
isozyme form and specific GST subunits are induced
by various xenobiotics and are expressed in a tissue
specific manner [5,9].
GSTs are often purified using an affinity column
which has GSH attached to the stationary phase,
either S-hexylglutathione or sulfobromophthalein gluta-
thione [29], but neither of these worked for turtle liver
GSTs which either bound irreversibly to the resins
(and could not be eluted with very high concentrations
of GSH) or were denatured. The glutathione S-transf-
erases contain two sites for substrate binding; a G-site
for the binding of glutathione and a H-site for the
binding of hydrophobic substrate. S -hexylglutathione
has previously been shown to bind to the H-site of the
enzyme [30] while sulfobromophthalein, a noncompeti-
tive inhibitor of GSTs, has been shown to bind to a
site other than the active site [31]. In both cases, elu-
tion with GSH would not be possible. Interestingly the
large relative molecular mass GSTs from the yeast
Yarrowia lipolytica [32] were also found not to bind to
GSH affinity columns. Studies on crystallized turtle
liver GSTs would provide information on the proxi-
mity of the G-, H- and inhibitor sites in relation to
GSTs from other organisms.
Turtle liver GST was purified with a combination of
three chromatography methods: dye ligand, gel filtra-
tion and ion exchange. The purification scheme devel-
oped for turtle GSTs resulted in final specific activities
of 7.31 and 55.4 UÆmg
)1
protein for Peaks 1 and 2
GST from aerobic control liver and 2.80 and
6.37 UÆmg
)1
protein for the enzymes from anoxic liver
(Table 1). Specific activities for both enzymes were in
the range of values reported for a class GSTs in ham-
ster liver (8.0–8.1 UÆmg
)1
protein) [33] but, with the
exception of the specific activity of Peak 2 GST from
control animals, were lower than activities reported for
human liver (16–37 UÆmg
)1
protein) [1], various mam-
malian tissues (20–357 UÆmg
)1
protein) [34] and adult
Fig. 6. Arrhenius plots for GSTs purified from liver of control T. s.
elegans. Data are means ± SEM for n ¼ 3 trials performed on a
single enzyme preparation. Where error bars are not visible, they
are contained within the symbol. Phosphate buffer was used and
cuvette temperature was checked immediately prior to and follow-
ing the assay; the temperatures shown are the mean these two
values. Peak 1 (d, solid line) and Peak 2 (s, dotted line) enzymes
from hydroxylapatite. For both isozymes, heat denaturation was evi-
dent at 40 °C.
GST function in anoxia-tolerant turtles W. G Willmore and K. B. Storey
3608 FEBS Journal 272 (2005) 3602–3614 ª 2005 FEBS
toad (Bufo bufo) liver (24–55 UÆmg
)1
protein) [35].
However, SDS ⁄ PAGE of the pooled peak fractions
revealed that the enzymes were purified to homogen-
eity (Fig. 4A).
Turtle liver GSTs showed a higher molecular mass
than most known GSTs. SDS ⁄ PAGE of Peak 1 GST
showed a subunit with a mass of 34 kDa, whereas
Peak 2 GST was composed of two subunits of 36.8
and 32.6 kDa. This indicated that the Peak 1 enzyme
was a homodimer and the Peak 2 enzyme a heterodi-
mer. Native molecular masses for both would be about
68 kDa which is somewhat higher than the 60 kDa
estimated from the Sephacryl column. This is consider-
ably higher than the masses of 45–50 kDa that have
been reported for toad, rabbit, rat or human liver
[1,35,36]. The native molecular mass of some yeast
(Y. lipolytica) GSTs, however, is 110 kDa [32]. Thus
GSTs can vary widely in their subunit size. The larger
molecular mass of turtle GSTs may arise as a result
of post-translational modifications of the subunit pro-
teins. Cloning and sequencing of turtle GST subunits
would confirm their size, identify potential sites of
post-translational modification and establish their
place within the classification of nonmammalian GSTs.
Cytosolic GSTs can generally be assigned to one of
four classes (a, l, p and h) based on their pI and kin-
etic characteristics [37]. The isozymes a, l, and p have
basic, near-neutral, and acidic isoelectric points,
respectively. Isoelectric focusing separated turtle liver
GSTs into one major and one minor isozyme exhibit-
ing activity with CDNB. Subsequent characterization
of these peaks revealed that each had some cumene
hydroperoxide activity. Class a isozymes exhibit strong
activity with cumene hydroperoxide so it is likely that
the major peak with basic pI values of 8.5–8.9 repre-
sents an a class GST in turtle liver. The cumene hydro-
peroxide activity exhibited by the minor isoform also
suggests an a class although the pI (6.5–6.8) is more
suggestive of l class which typically shows only minor
activity towards cumene hydroperoxide.
The classification of GSTs also depends on their
responses to substrates and inhibitors. Like all GSTs,
turtle liver GSTs showed activity with the nonspecific
substrates including CDNB, 1,2-dichloro-4-nitroben-
zene, and p-nitrophenylacetate (Table 3). The Peak 1
enzyme also used cumene hydroperoxide, a prominent
a class substrate. GSTs in both peaks also showed
good activity with p-nitrobenzylchloride which is spe-
cifically used by the a1 isozyme (but not a2 in rats)
but did not utilize ethacrynic acid (a p GST substrate),
trans-4-phenyl-3-buten-2-one (a l class substrate) or 2-
epoxy-3-(p-nitrophenoxy)propane (a l and p class sub-
strate) [38]. Overall, then, the substrate specificities of
the turtle liver GSTs are consistent with their classifi-
cation as a class enzymes. Responses to inhibitors also
generally supported this conclusion. Cibacron Blue
causes greatest to least inhibition (lowest to highest
I
50
)ofl, p and a isozymes, respectively [38]. Rose
Bengal very strongly inhibits p class GSTs [38] while
iodoacetamide, a reagent directed against thiol groups,
is a nonspecific inhibitor of all classes. S-hexylglutathi-
one shows highest to lowest inhibition of a, l and p
GST isozymes, respectively [38]. Both Peak 1 and 2
GSTs showed low inhibition by Cibacron Blue
although Peak 2 had a substantially lower I
50
than did
Peak 1. Rose Bengal inhibition of turtle liver GSTs
was in the range seen for inhibition of human a and l
class GSTs [39]. Inhibition by S-hexylglutathione was
the same for Peak 1 and Peak 2 isozymes and was
stronger than the inhibition of human a GST [39].
Hence, both substrate and inhibition responses suggest
that Peak 1 GST is an a class enzyme while Peak 2
may be an a-like isozyme without peroxidase activity.
Peak 1 and 2 GSTs from turtle liver also differed in
several other ways. Specific activities of turtle liver
GSTs from crude extracts, using CDNB as a substrate,
were comparable to those of rat liver (0.254 UÆmg
)1
protein), brain (0.034 UÆmg
)1
protein) and cultured
glial cells (0.093 UÆmg
)1
protein measured at 25 °C)
[40]. Activities of the purified enzymes were compar-
able to those found in human liver microsomes (21.6
and 3.8 UÆmg
)1
protein for CDNB and cumene hydro-
peroxide, respectively) [41]. Specific activities of puri-
fied turtle liver GSTs were much lower than those for
Xenopus liver GST (207 and 2.1 UÆmg
)1
protein for
CDNB and cumene hydroperoxide, respectively) [42],
but were comparable to largemouth bass (7.0 and
0.5 UÆmg
)1
protein for CDNB and cumene hydroper-
oxide, respectively) [43] and salmonid species (17–28
and 22–37 UÆmg
)1
protein for liver and kidney purified
enzymes, respectively) [44]. Specific activities of Peak 1
enzyme using cumene hydroperoxide as a substrate
were in the range of a GSTs found in human lung
(1.84 UÆmg
)1
protein) [45] which play a protective role
in lipid peroxidation. Specific activities using cumene
hydroperoxide were not as high as a GSTs found in
human liver (10.6 UÆmg
)1
protein) [38] or hamster liver
(2.7–3.4 UÆmg
)1
protein) [33]. Peak 1 GST showed a
significantly lower K
m
for GSH than did the Peak 2
enzyme but the opposite was true of the K
m
for
CDNB. The K
m
values for CDNB were higher than
that of human lung GST (K
m
¼ 0.033–0.042 mm) [45].
Both enzymes were inhibited by GSSG, the oxidized
form of GSH, with I
50
values of 2–2.6 mm; however,
this is about 100-fold higher than GSSG levels in vivo
so inhibition by this compound, which accumulates
W. G Willmore and K. B. Storey GST function in anoxia-tolerant turtles
FEBS Journal 272 (2005) 3602–3614 ª 2005 FEBS 3609
during oxidative stress, may not be a significant influ-
ence on enzyme activity in vivo. Both enzymes were
also strongly inhibited by S -hexylglutathione; this
strong inhibition (high affinity binding) may be the
reason that high concentrations of GSH could not
elute turtle liver GSTs from an S-hexylglutathione
matrix. The two turtle liver GSTs responded differ-
ently to various other inhibitors. For example, both
iodoacetamide and Cibacron blue were poor inhibitors
of Peak 1 GST but inhibited the Peak 2 enzyme with
I
50
values 5–6 fold lower than those of the Peak 1
enzyme. Peak 2 GST was also more strongly inhibited
by all chloride salts than was the Peak 1 isozyme.
The Peak 1 and Peak 2 GSTs separated by hydroxyl-
apatite chromatography did not differ in their pH
optima or activation energies. Furthermore, the lack of
a break in the Arrhenius relationship shows that
enzyme structure and conformation was not compro-
mised over the range of temperatures tested for either
enzyme. This range covers the physiological tempera-
ture range over which the animal normally functions.
Peak 1 and Peak 2 GSTs both had a pH optimum of
around 7.2. This pH optimum is on the acidic side of
the pH optima of most known GSTs, including human
l class enzymes [46]. The adaptive significance of this
is that turtle GSTs may function normally under the
acidotic cellular conditions that develop over the
course of long-term anoxia. Previous studies [25] have
shown that the blood pH of turtles can drop from 8 to
7 over the course of 130 days of anoxic submergence
at 3 °C. Enzymes that are crucial for cell survival dur-
ing metabolic depression would be required to function
under acidic conditions. Turtle GSTs may represent
one class of enzymes that function normally in the face
of metabolic acidosis occurring during over-wintering.
Likewise, keeping the pH optima of enzymes that are
inactivated during anoxia high would provide a signal
for shutting down entire biochemical pathways during
hibernation. Determination of the pH optima of other
purified turtle enzymes would reveal if this is a general
mechanism of anoxia survival in freshwater turtles.
In conclusion, the lower specific activities of GSTs
in liver from anoxic turtles (using either CDNB
or cumeme hydroperoxide as substrates) suggest a
possible specific suppression of GST activity during
anaerobiosis, perhaps caused by a stable modification
of the protein. However, the elution profiles from the
various columns demonstrate that anoxia exposure did
not stimulate the synthesis of any new isozymic forms
of GST. Based on SDS ⁄ PAGE as well as kinetic and
inhibition properties, the Peak 1 GST eluted from hyd-
roxylapatite was identified as a homodimeric a-class
GST whereas the Peak 2 isozyme appears to be a
heterodimeric a-class enzyme that lacked peroxidase
activity. Reduced activities using both substrates were
also documented for the anoxic, compared with the
aerobic, enzyme forms separated by isoelectric focus-
ing. For the Peak 2 enzyme retrieved by isoelectric
focusing, the decrease in CDNB activity was much
greater than the decrease in cumene hydroperoxide
activity during anoxia, suggesting that peroxidase
activity of this second isozyme was more conserved
during turtle hibernation. The GST isozyme(s) in Peak
2 of isoelectric focusing may play an important role in
removing the products of lipid peroxidation during
anoxia as some oxidative stress may occur in turtle
liver during anoxia (indicated by changes in the
GSH ⁄ GSSG ratio) [16]. Conservation of GST activity
in turtle liver also provides the animal the means to
deal with oxidative stress during the reoxygenation
after anoxic excursions.
Experimental procedures
Chemicals and animals
All chemicals were purchased from Sigma Chemical Co.
(St. Louis, MO) or Boehringer Mannheim Corp. (Montreal,
Quebec, Canada) and were of the highest purity available.
Winter acclimated adult red-eared sliders (T. s. elegans)
were obtained from Wards Natural Science, Mississauga,
Ontario and were maintained in large tanks of dechlori-
nated water at 7 °C for at least 3 weeks prior to experimen-
tation. Turtles had access to deep water and a dry platform
supplied with a heat lamp and were fed ad libitum on a diet
of trout pellets, lettuce and egg shells.
Control (normoxic) turtles were sampled directly from
the tank. Anoxia was imposed by submerging turtles at
5 °C in sealed tanks of deoxygenated water that had been
bubbled previously with 100% nitrogen gas for 1 h [16]. A
wire mesh placed 20 cm below the surface of the water pre-
vented turtles from surfacing. Turtles were sampled after
for 20 h of anoxic submergence. All animals were killed
by decapitation and organ samples were removed quickly,
frozen in liquid nitrogen and then transferred to )80 °C for
storage.
Preparation of tissue extracts and GST assay
Frozen tissue samples were quickly weighed and homogen-
ized 1 : 5 (w ⁄ v) in ice-cold 50 mm potassium phosphate
buffer (pH 7.5, containing 1 mm EDTA) and with phenyl-
methylsulfonyl fluoride (1 mgÆmL
)1
) added immediately
before homogenizing using an Ultra-Turrax (Tekmar) tissue
homogenizer. Homogenates were then sonicated for 10 s on
ice with a Kontes microultrasonic cell disrupter and centri-
fuged at 16 000 g for 15 min at 4 °C using an Eppendorf
GST function in anoxia-tolerant turtles W. G Willmore and K. B. Storey
3610 FEBS Journal 272 (2005) 3602–3614 ª 2005 FEBS
microcentrifuge. Supernatants were removed and desalted
by passage through a small column (1 · 5 cm) of Sephadex
G-25 (equilibrated in homogenizing buffer) with centrifuga-
tion for 1 min in an IEC benchtop centrifuge at full speed
[47].
GST was assayed by monitoring the formation of the
thioether product of the reaction between reduced gluta-
thione (GSH) and 1-chloro-2,4-dinitrobenzene (CDNB)
(e ¼ 9.6 mM
)1
) at 340 nm [1]. Standard assay conditions in
a 1 mL volume were 50 mm potassium phosphate (KPi)
buffer (pH 6.5), 1 mm EDTA, 6 mm GSH and 1 mm
CDNB. Blanks were run in the absence of either GSH or
enzyme. One unit of activity is defined as the amount of
enzyme that formed 1 lmol of product per min at 21 °C.
Turtle liver GST purification
The purification procedure was developed using liver
extracts from control turtles but also used for purification of
GSTs from anoxic liver. Four milliliters of crude supernatant
was applied to a Matrix Red column (2 cm length · 2.8 cm
diameter) equilibrated in homogenization buffer. A 30 mL
void volume was collected (containing no GST activity) and
then GST was eluted with a KCl gradient (0–1 m) with
37 · 1 mL fractions collected. Ten microliters of each frac-
tion was assayed for GST activity. Peak fractions were
pooled and concentrated in dialysis tubing (Spectra ⁄ Por
molecular porous membrane tubing, relative molecular mass
cut-off at 12–14 000, Spectrum Medical Industries, Inc.,
Houston, Texas, USA) surrounded by solid polyethylene
glycol 20 000. The concentrated enzyme was then applied to
a Sephacryl S-200 gel filtration column (45 cm length ·
1.8 cm diameter) equilibrated in homogenization buffer
(pH 6.0). The column was eluted with homogenization
buffer and, after a 34 mL void volume, 40 · 1 mL fractions
were gathered and assayed for GST activity. Peak fractions
were pooled, concentrated as above and then applied to a
hydroxylapatite column (2 cm length · 1.8 cm diameter)
equilibrated in homogenization buffer (pH 6.0). A 3 mL
void volume was collected and then a gradient of 0–250 mm
KPi was run. Forty-five fractions of 1 mL each were collec-
ted and assayed for GST activity. Peak fractions were com-
bined and used for subsequent studies. Stability tests
revealed that the pure enzyme retained 27–64% activity after
8 days at 4 °C (or 2 days of freezing at )80 °C). For long-
term storage, glycerol was added to the pure enzyme to a
final concentration of 50%. For native molecular mass deter-
mination, the same Sephacryl S-200 column used for purifi-
cation was calibrated using Blue Dextran to determine the
void volume and six protein standards.
Isoelectric focusing of turtle liver GSTs
Samples of crude supernatant were subjected to isoelectric
focusing [48] using an LKB 8101 isoelectric focusing
column (110 mL) with a sucrose gradient containing
pH 3.5–10 ampholines. The column was run for 14–18 h at
450 V constant voltage at 5 °C. After focusing, the column
was drained into 2 mL fractions and the elution profile of
enzyme activity and the pH gradient were measured. Peak
fractions were tested for activity using both CDNB and
cumene hydroperoxide substrates, the latter testing for
Se-independent glutathione peroxidase activity which is
catalyzed by GST.
SDS/PAGE of turtle liver GSTs
Peak fractions from the hydroxylapatite column were sub-
jected to discontinuous SDS ⁄ PAGE. Samples of purified
GSTs were mixed 1 : 1 (v:v) with 2· SDS ⁄ PAGE loading
buffer (100 mm Tris ⁄ HCl, pH 6.8, 4% w ⁄ v SDS, 20% v ⁄ v
glycerol, 0.2% w ⁄ v bromophenol blue) and boiled for
5 min. Turtle enzyme preparations were then loaded into
wells of a 0.75 mm thick gel and run adjacent to broad
range standards (Bio-Rad, Hercules, CA) and horse liver
GST (Sigma, Oakville, Ontario) using 1· Tris-glycine run-
ning buffer (3.02 gÆL
)1
Tris-base, 18.8 gÆL
)1
glycine, 0.1%
w ⁄ v SDS). The stacking gel was 5% w ⁄ v acrylamide
(30 : 0.8 w ⁄ w acrylamide:bisacrylamide) and the separating
gel was 15% w ⁄ v acrylamide. The gel was run at 200 V
for 1 h and then fixed in 30% v ⁄ v methanol, 10% v ⁄ v
acetic acid for 1 h at room temperature on a rotary sha-
ker. The gel was stained for 2 h in 0.25% Coomassie Bril-
liant Blue R, 50% v ⁄ v methanol, and 7.5% v ⁄ v acetic
acid, destained overnight in 30% methanol, 10% v ⁄ v acetic
acid and then photographed using a Polaroid DS34 Direct
Screen Instant Camera (Bio ⁄ Can Scientific, Mississauga,
Ontario, Canada).
Kinetic and inhibition characteristics of turtle
liver GSTs
Substrate affinity constants (K
m
) for GSH, CDNB and cum-
ene hydroperoxide as well as I
50
values (the concentration of
inhibitor that reduces activity by 50%) for various salts and
a range of known inhibitors of GST were determined for
the Peak 1 and 2 enzymes from the hydroxylapatite column.
I
50
determinations were performed at optimal GSH and
CDNB concentrations. Specific substrates for known classes
of GSTs were tested for activity (at 1 mm each) including
ethacrynic acid, trans-4-phenyl-3-buten-2-one, 1,2-epoxy-
3-(p-nitrophenoxy) propane, 1,2-dichloro-4-nitrobenzene,
p-nitrobenzylchloride, and p-nitrophenylacetate.
Temperature and pH dependence of turtle liver
GSTs
The temperature and pH dependence of Peak 1 and Peak 2
GSTs were assessed in KP
i
buffer under optimal substrate
concentrations. Temperature dependence was assessed over
W. G Willmore and K. B. Storey GST function in anoxia-tolerant turtles
FEBS Journal 272 (2005) 3602–3614 ª 2005 FEBS 3611
the range from 5 to 40 °C using increments of 3 °C and
analyzed using an Arrhenius plot of log V vs. 1 ⁄ K. For pH
curves, different buffer pH values were obtained by mixing
appropriate amounts of KH
2
PO
4
and K
2
HPO
4
with further
adjustment using HCl or KOH as needed. Assay pH in
cuvettes was measured prior to and immediately following
the enzyme assay.
Protein determinations
Soluble protein concentration was determined by the Coo-
massie blue G-250 binding method [49] using the Bio-Rad
prepared reagent with bovine serum albumin as the stand-
ard. Spectrophotometric quantification at 595 nm used a
Dynatech MR-5000 microplate reader with a final well vol-
ume of 310 lL.
Statistical analyses
Kinetic constants, activation energies from Arrhenius plots,
and statistical analyses were determined using computer
programs for enzyme kinetics and statistics [50].
Acknowledgements
Thanks to A. Ima and J.M. Storey for editorial revi-
sions to the manuscript. This work was supported by a
postgraduate scholarship to W.G.W and a discovery
grant to K.B.S. from the NSERC Canada; K.B.S.
holds the Canada Research Chair in Molecular Physio-
logy.
References
1 Habig WH & Jakoby WB (1981) Glutathione S-trans-
ferases (rat and human). Methods Enzymol 77 , 218–231.
2 Ketterer B, Meyer DJ & Clark AG (1988) Soluble glu-
tathione transferase isozymes. In Glutathione Conjuga-
tion: Mechanisms and Biological Significance (Sies, H &
Ketterer, B, eds), pp. 73–135. Academic Press, London.
3 Mannervik B & Danielson VH (1988) Glutathione
transferases – structure and catalytic activity. CRC Crit
Rev Biochem 23, 283–337.
4 Morgenstern R & DePierre JW (1988) Membrane-
bound glutathione transferases. In Glutathione Conjuga-
tion: Mechanisms and Biological Significance (Sies, H &
Ketterer, B, eds), pp. 157–174. Academic Press,
London.
5 Pickett CB & Lu AYH (1989) Glutathione S-trans-
ferases: gene structure, regulation and biological
function. Annu Rev Biochem 58, 743–764.
6 Coles B & Ketterer B (1990) The role of glutathione
and glutathione transferases in chemical carcinogenesis.
Crit Rev Biochem Mol Biol 25, 47–70.
7 Rushmore TH & Pickett CB (1993) Glutathione S-trans-
ferases, structure, regulation, and therapeutic implica-
tions. J Biol Chem 268, 11475–11478.
8 Sheehan D, Meade G, Foley VM & Dowd CA (2001)
Structure, function and evolution of glutathione trans-
ferases: implications for classification of non-mamma-
lian members of an ancient enzyme superfamily.
Biochem J 360, 1–16.
9 Daniel V (1993) Glutathione S-transferases: gene struc-
ture and regulation of expression. Crit Rev Biochem
Mol Biol 28, 173–207.
10 Owuor ED & Kong A-HT (2002) Antioxidants and oxi-
dants regulated signal transduction pathways. Biochem
Pharm 64, 765–770.
11 Andersson C, Mosialou E, Weinander R, Herbert H
& Morgenstern R (1993) Rat liver microsomal gluta-
thione transferase: studies on structure and
function. In Structure and Function of Glutathione
Transferases (Tew, KD, Pickett, CB, Mantle, TJ,
Mannervik, B & Hayes, JD, eds), pp. 109–116. CRC
Press, London.
12 Ishikawa T (1992) The ATP-dependent glutathione
S-conjugate export pump. Trends Biochem Sci 17,
463–468.
13 Ishikawa T (1993) Glutathione S-conjugate export
pump. In Structure and Function of Glutathione
Transferases (Tew, KD, Pickett, CB, Mantle, TJ,
Mannervik, B & Hayes, JD, eds), pp. 211–221. CRC
Press, London.
14 Herbert CV & Jackson DC (1985) Temperature effects
on the responses to prolonged submergence in the turtle
Chrysemys picta bellii. I. Blood acid-base and ionic
changes during and following anoxic submergence.
Physiol Zool 58, 655–669.
15 Hermes-Lima M & Zenteno-Savin T (2002) Animal
response to drastic changes in oxygen availability and
physiological oxidative stress. Comp Biochem Physiol C
133, 537–556.
16 Willmore WG & Storey KB (1997) Glutathione systems
and anoxia tolerance in turtles. Am J Physiol 273,
R219–R225.
17 Hermes-Lima M & Storey KB (1998) Role of antioxi-
dant defenses in the tolerance of severe dehydration by
anurans. The case of the leopard frog Rana pipiens. Mol
Cell Biochem 189, 79–89.
18 Joanisse DR & Storey KB (1996) Oxidative damage and
antioxidants in Rana sylvatica, the freeze tolerant wood
frog. Am J Physiol 271, R545–R553.
19 Grundy JE & Storey KB (1998) Antioxidant defenses
and lipid peroxidation damage in estivating toads,
Scaphiopus couchii. J Comp Physiol B 168, 132–142.
20 Jackson DC (2004) Acid-base balance during hypoxic
hypometabolism: selected vertebrate strategies. Resp
Phys Neuro 141, 273–283.
GST function in anoxia-tolerant turtles W. G Willmore and K. B. Storey
3612 FEBS Journal 272 (2005) 3602–3614 ª 2005 FEBS
21 Ultsch GR (1989) Ecology and physiology of hiberna-
tion and overwintering among freshwater fishes, turtles,
and snakes. Biol Rev 64, 435–516.
22 Jackson DC (2000) Living without oxygen: lessons from
the freshwater turtle. Comp Biochem Physiol A 125,
299–315.
23 Jackson DC & Heisler N (1982) Plasma ion balance of
submerged anoxic turtles at 3°C: the role of calcium
lactate formation. Respir Physiol 49, 159–174.
24 Jackson DC, Wang T, Koldkjaer P & Taylor EW
(2001) Lactate sequestration in the carapace of the cray-
fish Austropotamobius pallipes during exposure in air.
J Exp Biol 204, 941–946.
25 Ultsch GR, Carwile ME, Crocker CE & Jackson DC
(1999) The physiology of hibernation among painted
turtles: the eastern painted turtle Chrysemys picta picta .
Physiol Biochem Zool 72, 493–501.
26 Jackson DC, Ramsey AL, Paulson JM, Crocker CE &
Ultsch GR (2000) Lactic acid buffering by bone and
shell in anoxic softshell and painted turtles. Physiol Bio-
chem Zool 73, 290–297.
27 Suarez RK, Doll CJ, Buie AE, West TG, Funk GD &
Hochachka PW (1989) Turtles and rats: a biochemical
comparison of anoxia-tolerant and anoxia-sensitive
brains. Am J Physiol 257, R1083–R1088.
28 Simon LM, Liu J, Theodore J & Robin ED (1977)
Some comparative aspects of the organ distribution of
superoxide dismutase activity in the freshwater turtle,
Pseudemys scripta elegans. Comp Biochem Physiol B 58,
377–379.
29 Nishinaka T, Kodaka R, Nanjo H, Terada T, Mizogu-
chi T & Nishihara T (1992) Purification and characteri-
zation of glutathione S-transferase isozymes in dog lens.
Int J Biochem 24, 1737–1742.
30 Ji X, Tordova M, O’Donnell R, Parsons JF, Hayden
JB, Gilliland GL & Zimniak P (1997) Structure and
function of the xenobiotic substrate-binding site and
location of a potential non-substrate-binding site in a
class p glutathione S-transferase. Biochem 36, 9690–
9702.
31 Kolobe D, Sayed Y & Dirr HW (2004) Characterization
of bromosulphophthalein binding to human glutathione
S-transferase A1–1: thermodynamics and inhibition
kinetics. Biochem J 382, 703–709.
32 Foley V & Sheehan D (1998) Glutathione S-transferases
of the yeast Yarrowia lipolytica have unusually large
molecular mass. Biochem J 333, 839–845.
33 Bogaards JJP, Van Ommen F & Van Bladeren PJ
(1992) Purification and characterization of eight glu-
tathione S-transferase isoenzymes of hamster. Compari-
son of subunit composition of enzymes from liver,
kidney, testis, pancreas and trachea. Biochem J 286,
383–388.
34 Addya S, Mullick J, Fang J-K & Avadhani NG (1994)
Purification and characterization of a hepatic mitochon-
drial glutathione S-transferase exhibiting immunochem-
ical relationship to the a-class of cytosolic enzymes.
Arch Biochem Biophys 310, 82–88.
35 Aceto A, Dragani B, Bucciarelli T, Sacchetta P, Martini
F, Angelucci S, Amicarelli F, Miranda M & Di Ilio C
(1993) Purification and characterization of the major
glutathione transferase from adult toad (Bufo bufo)
liver. Biochem J 289, 417–422.
36 Primiano T & Novak RF (1993) Purification and char-
acterization of class l glutathione S-transferase isozymes
from rabbit hepatic tissue. Arch Biochem Biophys 301,
404–410.
37 Mannervik B, Awasthi YC, Board PG, Hayes JD, Di
Ilio C, Ketterer B, Listowsky I, Morgenstern R, Mu-
ramatsu M, Pearson WR et al. (1992) Nomenclature for
human glutathione transferases. Biochem J Lett 282,
305–308.
38 Mannervik B (1985) The isozymes of glutathione S-
transferase. Adv Enzymol 57, 357–417.
39 Tahir MK, Guthenberg C & Mannervik B (1985) Inhi-
bitors for distinction of three types of human glu-
tathione transferase. FEBS Lett 181, 249–252.
40 Sagara J & Sugita Y (2001) Characterization of cytoso-
lic glutathione S-transferase in cultured asterocytes.
Brain Res 902, 190–197.
41 Prabhu KS, Reddy PV, Jones EC, Liken AD & Reddy
CC (2004) Characterization of a class alpha glutathione-
S-transferase with glutathione peroxidase activity in
human liver microsomes. Arch Biochem Biophys 424,
72–80.
42 Sun TH, Ling X, Persson B & Morgenstern R (1998) A
highly active microsomal glutathione transferase from
frog (Xenopus laevis) liver that is not activated by
N-ethylmaleimide. Biochem Biophys Res Commun 246,
466–469.
43 Doi AM, Pham RT, Hughes EM, Barber DS & Galla-
gher EP (2004) Molecular cloning and characterization
of a glutathione S-transferase from largemouth bass
(Micropterus salmoides) liver that is involved in the
detoxification of 4-hydroxynonenal. Biochem Pharmacol
67, 2129–2139.
44 Novoa-Valinas MC, Perez-Lopez M & Melgar MJ
(2002) Comparative study of the purification and char-
acterization of the cytosolic glutathione S-transferases
from two salmonid species: Atlantic salmon (Salmo
salar) and brown trout (Salmo trutta). Comp Biochem
Physiol C 131, 207–213.
45 Singhal SS, Saxena M, Ahmad H, Awasthi S, Haque
AK & Awasthi YC (1992) Glutathione S-transferases of
human lung: characterization and evaluation of the pro-
tective role of the a-class isozymes against lipid peroxi-
dation. Arch Biochem Biophys 299, 232–241.
46 Comstock KE, Widersten M, Hao X-Y, Henner WD
& Mannervik B (1994) A comparison of the enzy-
matic and physicochemical properties of human
W. G Willmore and K. B. Storey GST function in anoxia-tolerant turtles
FEBS Journal 272 (2005) 3602–3614 ª 2005 FEBS 3613
glutathione transferase M4–4 and three other human
Mu class enzymes. Arch Biochem Biophys 311, 487–495.
47 Helmerhorst E & Stokes GB (1980) Microcentrifuge
desalting: a rapid quantitative method for desalting
small amounts of protein. Anal Biochem 104, 130–135.
48 Vesterberg O (1971) Isoelectric focusing of proteins.
Methods Enzymol 22, 389–412.
49 Bradford MM (1976) A rapid and sensitive method for
the quantitation of microgram quantities of protein
utilizing the principle of protein-dye binding. Anal
Biochem 72, 248–254.
50 Brooks SPJ (1992) A simple computer program with
statistical tests for the analysis of enzyme kinetics.
Biotechniques 13, 906–911.
GST function in anoxia-tolerant turtles W. G Willmore and K. B. Storey
3614 FEBS Journal 272 (2005) 3602–3614 ª 2005 FEBS