Ebook Logistics and supply chain management: creating value-adding networks (4th ed): Part 2
Bạn đang xem bản rút gọn của tài liệu. Xem và tải ngay bản đầy đủ của tài liệu tại đây (2.41 MB, 136 trang )
The synchronous
supply chain
MM
The extended enterprise and the virtual supply chain
MM
The role of information in the virtual supply chain
MM
Laying the foundations for synchronisation
MM
‘Quick response’ logistics
MM
Production strategies for quick response
MM
Logistics systems dynamics
7
In conventional supply chains each stage in the chain tends to be disconnected
from the others. Even within the same company the tendency is for separate functions to seek to optimise their own performance. As a result the interfaces between
organisations and between functions within those organisations need to be buffered with inventory and/or time lags. The effect of this is that end-to-end pipeline
times are long, responsiveness is low and total costs are high.
To overcome these problems it is clear that the supply chain needs to act as
a synchronised network – not as a series of separate islands. Synchronisation
implies that each stage in the chain is connected to the other and that they all
‘march to the same drumbeat’. The way in which entities in a supply chain become
connected is through shared information.
The information to be shared between supply chain partners includes demand
data and forecasts, production schedules, new product launch details and bill of
material changes.
To enable this degree of visibility and transparency, synchronisation requires a
high level of process alignment, which itself demands a higher level of collaborative working. These are issues to which we shall return. The box below indicates
some of the key processes that need to be linked, upstream and downstream, to
provide the foundation for supply chain synchronisation.
141
MM
Planning and scheduling: Material positioning/visibility, advanced planning,
scheduling, forecasting, capacity management.
MM
Design: Mechanical design, electrical design, design for supply chain, component selection.
MM
New product introduction: Bill of materials management, prototyping, design
validation, testing, production validation, transfer to volume.
MM
Product content management: Change generation, change impact assessment, product change release, change cut-in/phase-out.
MM
Order management: Order capture/configuration, available to promise, order
tracking, exception management.
MM
Sourcing and procurement: Approved vendor management, strategic sourcing,
supplier selection, component selection.
Source: Cookson, C. ‘Linking supply chains to support collaborative
manufacturing’, Ascet, Vol. 3, 2001, www.ascet.com
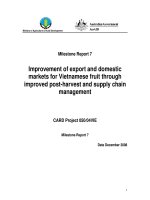
Figure 7.1 depicts the difference between the conventional supply chain with limited transfer of information and the synchronous supply chain with network-wide
visibility and transparency.
The extended enterprise and the virtual supply
chain
The nature of business enterprise is changing. Today’s business is increasingly
‘boundaryless’, meaning that internal functional barriers are being eroded in favour
of horizontal process management and externally the separation between vendors,
distributors, customers and the firm is gradually lessening. This is the idea of the
extended enterprise, which is transforming our thinking on how organisations compete and how value chains might be reformulated.
Underpinning the concept of the extended enterprise is a common information
‘highway’. It is the use of shared information that enables cross-functional, horizontal management to become a reality. Even more importantly it is information
shared between partners in the supply chain that makes possible the responsive
flow of product from one end of the pipeline to another. What has now come to
be termed the virtual enterprise or supply chain is in effect a series of relationships
between partners that is based upon the value-added exchange of information.
Figure 7.2 illustrates the concept.
The notion that partnership arrangements and a mentality of co-operation are
more effective than the traditional arm’s-length and often adversarial basis of
relationships is now gaining ground. Thus the supply chain is becoming a confederation of organisations that agree common goals and who bring specific
142
LOGISTICS & SUPPLY CHAIN MANAGEMEN T
Figure 7.1 Achieving synchronisation through shared information: (a) before
synchronisation; (b) after sychronisation
(a)
Tier 2
Tier 1
OEM
Customer
(b)
Customer
Tier 1
Tier 1
OEM
Tier 2
Tier 2
Customer
Key:
OEM = Original equipment manufacturer
Tier 1 and 2 = Supplier echelons
Figure 7.2 The extended enterprise and the virtual supply chain
Sources
Converters
Retailers
Product and service flow
Information flow
Funds flow
Suppliers
Distributors
Consumer
Source: A.T. Kearney
THE SYNCHrONOUS SUPPLY CHAIN
143
strengths to the overall value creation and value delivery system. This process
is being accelerated as the trend towards outsourcing continues. Outsourcing
should not be confused with ‘subcontracting’ where a task or an activity is simply
handed over to a specialist. In a way it would be better to use the term ‘in-sourcing’ or ‘re-sourcing’, when we refer to the quite different concept of partnering that
the virtual supply chain depends upon. These partnerships may not be for all time
– quite possibly they exist only to exploit a specific market opportunity – but they
will be ‘seamless’ and truly synergetic.
The role of information in the virtual supply chain
Leading organisations have long recognised that the key to success in supply chain
management is the information system. However, what we are now learning is that
there is a dimension to information that enables supply and demand to be matched
in multiple markets, often with tailored products, in ever-shorter time-frames.
This extension of the information system beyond the classical dimensions
of simple planning and control enables time and space to be collapsed through
the ability to link the customer directly to the supplier and for the supplier to react,
sometimes in real time, to changes in the market. Rayport and Sviokla1 have
coined the term ‘marketspace’ to describe the new world of electronic commerce,
internets and virtual supply chains. In the marketspace, customer demand can be
identified as it occurs and, through CAD/CAM and flexible manufacturing, products
created in minimal batch sizes. Equally, networks of specialist suppliers can be
joined together to create innovative yet cost-effective solutions for complex design
and manufacturing problems. The way that Airbus now designs and assembles
its advanced aeroplanes, for example, would not be possible without the use of
global information networks that link one end of the value chain to the other.
The Internet has in many ways transformed the ways in which supply chain
members can connect with each other.2 It provides a perfect vehicle for the establishment of the virtual supply chain. Not only does it enable vast global markets to be
accessed at minimal cost and allow customers to shorten dramatically search time
and reduce transaction costs, but it also enables different organisations in a supply
chain to share information with each other in a highly cost-effective way. Extranets
as they have come to be termed are revolutionising supply chain management.
Organisations with quite different internal information systems can now access data
from customers on sales or product usage and can use that information to manage
replenishment and to alert their suppliers of forthcoming requirements.
One of Britain’s major retailers, Tesco, is using an extranet to link with its suppliers to share point-of-sale data. At the same time the company is successfully
running a home shopping and delivery system for consumers over the Internet.
Within the business, intranets are in place that enable information to be shared
between stores and to facilitate communication across the business. We are
probably even now only scraping the surface in terms of how the Internet and its
associated technologies can be used to further exploit the virtual supply chain.
Figure 7.3 highlights some of the current applications of Internet-based concepts
to supply chain management.
144
LOGISTICS & SUPPLY CHAIN MANAGEMEN T
THE SYNCHrONOUS SUPPLY CHAIN
145
Source: A.T. Kearney
Customer service
• Information and support
products and services
• Electronic help desk
• Mass customisation and
order processing
Marketing channel
• Public relations and advertising
• Market research and test
• Electronic mails and catalogues
Information retrieval
• Online news
• Statistics, reports and databases
• Data mining
• Competitive analysis
Supplier relationships
• Logistics
• Product search
• Electronic data interchange
• Ordering and payment
• Supply chain integration
Building strategic alliances
• Newsletters, bulletin boards,
discussion databases
• Sharing knowledge and experience
Internet
Intranet
Extranet
Financial transactions
• Selling and payment
• Managing accounts
• Credit card payments
Figure 7.3 Internet applications and the supply chain
Electronic distribution
• Product, data, information
Internal communications
• Complete internal, external, vertical
and horizontal communications
• Groupware
• Collaboration
• Knowledge transfer
• Telecommuting
Human resources and
employee relations
• Job opening posting
• Expert search
• Employee training and support
• Distance learning
Sales force automation
• On-site configuration and order processing
• Sales process transformation
The IT solutions now exist to enable supply chain partners to share information
easily and at relatively low cost. A major benefit that flows from this greater transparency is that the internal operations of the business can become much more
efficient as a result. For example, by capturing customer demand data sooner,
better utilisation of production and transport capacity can be achieved through
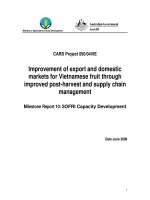
better planning or scheduling. Figure 7.4 indicates some of the uses to which
improved logistics information can be put.
Figure 7.4 Functions of a logistics information system
Planning function
• Stock management
• By product/
customer
• By location
• Demand forecasting
• Strategy planning
Co-ordination function
Database
• Production
scheduling
• Materials requirement
planning
• Sales/marketing
planning
• External data
• Customer orders
• Inbound shipments
• Internal data
• Production
• Inventory
Customer service
communication function
• Customer order status
• Inventory availability
• By product
• By stock location
• Outbound shipment
status
Control function
• Customer service
levels
• Vendor performance
• Carrier performance
• System performance
Increasingly, it seems that successful companies have one thing in common
– their use of information and information technology to improve customer responsiveness. Information systems are reshaping the organisation and also the nature
of the linkages between organisations. Information has always been central to the
efficient management of logistics but now, enabled by technology, it is providing
the driving force for competitive logistics strategy.
We are now starting to see the emergence of integrated logistics systems that
link the operations of the business, such as production and distribution, with the
supplier’s operations on the one hand and the customer on the other.3 Already it is
the case that companies can literally link the replenishment of product in the marketplace with their upstream operations and those of their suppliers through the
146
LOGISTICS & SUPPLY CHAIN MANAGEMEN T
use of shared information. The use of these systems has the potential to convert
supply chains into demand chains in the sense that the system can now respond
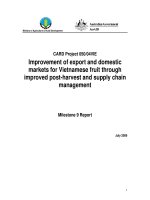
to known demand rather than having to anticipate that demand through a forecast.
Figure 7.5 describes the architecture of such a system.
One company that has recognised the importance of improving supply chain
visibility through shared information is Cisco Systems, a market leader in telecommunications and network equipment (see below).
Cisco Systems: creating a virtual supply chain through shared
information
Cisco Systems, one of the world’s leading players in the networking and telecommunications markets, has created a virtual supply chain in which almost all
manufacturing and physical logistics are outsourced to specialist contract manufacturers and third-party logistics companies. Only a very small proportion of their
20,000 different stock keeping units are actually ‘touched’ by Cisco.
Following a sudden collapse in sales as the Internet bubble of the closing years
of the twentieth century finally burst, Cisco was forced to write off over $2 billion of
obsolete inventory. Subsequent investigations highlighted the reason for this spectacular fall from grace: inadequate visibility of real demand across the entire supply
chain leading to significant over-ordering of components.
Determined not to see a repeat of this catastrophic event – the size of the inventory write-off created a new world record and led to a major financial setback for
the company – Cisco set out to build a state of the art communications network
to enable information to be shared across the ‘extended enterprise’ of their major
tier 1 suppliers and logistics service providers. This has been achieved through the
creation of an ‘e-hub’. The purpose of the e-hub is to act as the nerve centre and
to ensure real-time visibility of demand, inventory levels and production schedules.
Through its event management capability it can provide early warning of supply
chain problems.
As a result of its investment in creating supply chain wide visibility through
shared information, Cisco has enabled a highly synchronised network of global
partners to act as if they were a single business.
Laying the foundations for synchronisation
In the same way that the conventional wisdom in production and manufacturing
is to seek economies of scale through larger batch quantities, similar thinking can
often be found in the rest of the supply chain. Thus companies might seek to ship
by the container or truck load, customers are discouraged from ordering in smaller
quantities by price penalties and delivery schedules are typically based on optimising the efficiency of routes and the consolidation of deliveries. Clearly such an
THE SYNCHrONOUS SUPPLY CHAIN
147
148
LOGISTICS & SUPPLY CHAIN MANAGEMEN T
8
Available
Inventory
planning
Minimums
maximums
15 EOQ
Source: Digital Equipment Corporation
Promotion
scheduling
Promotion
14 schedules
Available
Replenishment
requirements
Deployment
Forecast demand
Forecasting
9
Actual
demand
Shipped
Billed
12
13
Committed
Credit
Billing
1
3
Scheduled
Request
10
Production
scheduling
7
5
Shipped
17
Finished
goods
warehousing
Inventory
costing
Networking
planning
Requisition
11
Purchasing
Shipments
6
18
Transportation
Transportation
planning
Routes
carriers rates
4
Loads to pick
Rated
shipments
E.T.A.
Locations
Transaction
Receipts service areas
reporting
adjustments stocking rules
16
Finished
goods
inventory
status
2
Allocation
Demand flow
Economic shipping units
management
Demand
flow
data
Figure 7.5 An integrated logistics information system
approach runs counter to the requirements of a synchronous supply chain. Under
the synchronisation philosophy the requirement is for small shipments to be made
more frequently and to meet the precise time requirements of the customer.
The challenge to logistics management is to find ways in which these
changed requirements can be achieved without an uneconomic escalation of
costs. There may have to be trade-offs but the goal must be to improve total
supply chain cost effectiveness.
The basic principle of synchronisation is to ensure that all elements of the chain
act as one, and hence there must be early identification of shipping and replenishment requirements and, most importantly of all, there must be the highest level of
planning discipline.
In a synchronous supply chain the management of in-bound materials flow
becomes a crucial issue. In particular the search for consolidation opportunities
has to be a priority. Thus, for example, rather than one supplier making a series of
deliveries in small quantities to a customer, the orders from a number of suppliers
are combined into a single delivery. It is perhaps not surprising that the emergence
of synchronous supply chains as a management philosophy has coincided with
the growth of third-party distribution and logistics companies specialising in providing an in-bound consolidation service.
These logistics service companies can manage the pick-up of materials and
components from suppliers on a ‘milk round’ basis, using a central ‘hub’ or transhipment centre for re-sorting and consolidating for in-bound delivery. They may also
perform certain value-adding activities such as quality control, kitting, sequencing or
final finishing. In complex assembly operations such as motor manufacture the prior
sequencing of parts and components prior to assembly is a crucial activity (see the
example below of seat delivery to Nissan’s assembly line in north-east England).
Synchronised delivery: how Nissan Motors UK receives vehicle seats
Elapsed hours
0 Painted body passes to trim line in Nissan
Precise vehicle specifications of next 12 vehicles transmitted by computer from
Nissan to seat suppliers
Supplier transfers information to picking lists
Seat covers selected from range
1 Covers prepared for assembly (in reverse order)
Seat assembly from synchronised manufacture of sub-assemblies (frames,
foams, finishers, plastic parts)
2 Quality audit and load
Delivery of seats to stock holding point by special purpose vehicle
Stock to lineside
3 Rear seats fitted followed by front seats (waiting stillages returned to empty
wagon)
Delivery frequency now every 15–20 minutes
THE SYNCHrONOUS SUPPLY CHAIN
149
Similar developments have enabled the transformation of retail logistics. The idea
of ‘stockless distribution centres’ or ‘cross-docking’ enables a more frequent and
efficient replenishment of product from manufacture to individual stores. Crossdocking, often facilitated by a logistics service provider, is a simple, but powerful,
concept. Point-of-sale data from individual stores is transmitted to the retailer’s
head office to enable them to determine replenishment requirements. This information is then transmitted directly to the suppliers who assemble orders for specific
stores and the pallets or cases are then bar-coded (or increasingly electronically tagged). On a pre-planned basis these store orders are then collected by
the logistics service provider and are taken to a transhipment centre (the ‘crossdock’ facility) – possibly operated by the logistics service provider – where they
are sorted for store delivery along with other suppliers’ orders. In effect, a just-intime delivery is achieved, which enables minimum stock to be carried in the retail
stores, and yet transport costs are contained through the principles of consolidation (see Figures 7.6 and 7.7).
Figure 7.6 Daily sales data drives the replenishment order system
Supplier
Supplier
Supplier
Supplier
Supplier
Logistics
service
company
Store
Store
Head
office
Store
Store
Store
‘Quick response’ logistics
An outgrowth of the synchronisation philosophy has emerged in recent years
under the banner of ‘quick response’ logistics. 4 The basic idea behind quick
response (QR) is that in order to reap the advantages of time-based competition
it is necessary to develop systems that are responsive and fast. Hence QR is the
umbrella term for the information systems and the logistics systems that combine
to provide ‘the right product in the right place at the right time’.
150
LOGISTICS & SUPPLY CHAIN MANAGEMEN T
Figure 7.7 Acting on this information a consolidated pick-up and store delivery
sequence is activated
Supplier
Supplier
Supplier
Scheduled
pick-ups from
suppliers
Supplier
Supplier
Logistics
service
company
Transhipment
centre
Store
Store
Store
Store
Consolidated
local delivery
Store
The basic idea behind quick response (QR) is that in order to reap the
advantages of time-based competition it is necessary to develop systems
that are responsive and fast.
What has made QR possible is the development of information technology and in
particular the rise of Internet-enabled data exchange, bar coding, the use of electronic point-of-sale (EPOS) systems with laser scanners and so on.
Essentially the logic behind QR is that demand is captured in as close to realtime as possible and as close to the final consumer as possible. The logistics
response is then made directly as a result of that information. An example of such
an approach is provided in the United States by Procter & Gamble which receives
sales data directly from the check-out counters of North America’s largest retailer,
Wal-Mart. Making use of this information P&G can plan production and schedule
delivery to Wal-Mart on a replenishment basis. The result is that Wal-Mart carries
less inventory yet has fewer stock-outs and P&G benefits from better economies
in production and logistics as a result of the early warning and – most importantly
– greatly increased sales to Wal-Mart. Whilst the investment in the information
system is considerable, so too is the payback.
THE SYNCHrONOUS SUPPLY CHAIN
151
A further feature in favour of QR systems is that by speeding up processing
time in the system, cumulative lead times are reduced. This can then result in lower
inventory (see Figure 7.8) and thus further reduce response times. In effect a ‘virtuous circle’!
Figure 7.8 Quick response system can trigger a ‘virtuous circle’ in logistics
Quick response
Reduced
lead times
Less inventory
required
Less
pipeline
inventory
Less
safety stock
Reduced
forecasting
error
Quick response systems have begun to emerge in the fashion and apparel industry where the costs of traditional inventory-based systems based upon buyers’
prior purchase decisions (in effect a ‘push’ system) can be considerable. In the
United States it is estimated that the annual costs to the US textile and apparel
industry of conventional logistics systems is $25 billion. This comprises the following elements:
Forced markdowns
$14.08bn
Stock-outs
$6.08bn
Inventory carrying costs
$5.08bn
Total:
$25.24bn
There could be massive advantages to be gained by all parties in the supply
chain if the concept of QR was adopted throughout the chain. Thus in the case
of fashion garments the aim should be to link retail sales with the apparel manufacturers, who in turn are linked to the textile producers who themselves are linked
to the suppliers of fibres. One such reported case is the linkage through shared
152
LOGISTICS & SUPPLY CHAIN MANAGEMEN T
information of the US textile company Milliken with the Seminole Manufacturing
Company (a manufacturer of men’s slacks) and the retailer Wal-Mart. Information
on end-user demand was captured at the point-of-sale and rapidly fed back up
the supply chain, enabling dramatic reductions in lead times to be achieved and
hence substantial reductions in inventory.
Another case from the US is provided by the chain of retail fashion stores, The
Limited. Each of the several thousand stores in the chain tracks consumer preferences daily using their point-of-sale data. Based upon this, orders are sent by
satellite links to the suppliers around the world. Using Hong Kong as a consolidation centre, goods are flown back to The Limited’s distribution centre in Columbus,
Ohio. At the distribution centre the goods are price-marked and re-sorted for
immediate onward shipment by truck and plane to the retail stores. The whole
cycle from reorder to in-store display can be achieved in six weeks. Conventional
systems take more like six months.
Production strategies for quick response
As the demand by all partners in the supply chain for a quick response increases,
the greater will be the pressure placed upon manufacturing to meet the customer’s
needs for variety in shorter and shorter time-frames.
The answer has to lie in flexibility. As we have already observed, if it were possible to reduce manufacturing and logistics lead times to zero then total flexibility
could be achieved. In other words the organisation could respond to any request
that was technologically feasible in any quantity. Whilst zero lead times are obviously not achievable, the new focus on flexible manufacturing systems (FMS) has
highlighted the possibility of substantial progress in this direction.
The key to flexibility in manufacturing is not just new technology, e.g. robotics,
although this can contribute dramatically to its achievement. The main barrier to
flexibility is the time taken to change; to change from one level of volume to another
and to change from making one variant to another. Typically we call this ‘set-up
time’. It will be apparent that if set-up times can be driven as close as possible to
zero then flexible response to customer requirements presents no problem.
The Japanese, not surprisingly, have led the way in developing techniques for
set-up time reduction. ‘Single minute exchange of die’, or SMED, is the goal in
many Japanese plants. In other words continuous attention by management and
the workforce is focused upon the ways in which set-up times can be reduced.
Sometimes it will involve new technology, but more often than not it is achieved
through taking a totally different look at the process itself. In many cases set-up
times have been reduced from hours down to minutes, simply by questioning the
conventional wisdom.
What in effect we are seeing is a fundamental shift away from the economies of
scale model, which is volume based and hence implies long production runs with
few change-overs, to the economies of scope model, which is based upon producing small quantities of a wider range, hence requiring more change-overs.
THE SYNCHrONOUS SUPPLY CHAIN
153
It has been suggested that under the economies of scope model:
… a single plant can produce a variety of output at the same cost as (if not lower
than) a separate plant, dedicated to producing only one type of product at a
given level. In other words an economic order quantity (EOQ) of one unit, and
specific production designs, engender no additional costs. Economies of scope
change the materials-driven, batch-system technology into a multi-functional,
flow system configuration.
SOURCE: D. LEI AND J.D. GOLDHARS 5
The marketing advantages that such flexibility brings are considerable. It means
that in effect the company can cater for the precise needs of multiple customers,
and they can offer even higher levels of customisation. In today’s marketplace
where customers seek individuality and where segments or ‘niches’ are getting
ever smaller, a major source of competitive advantage can be gained by linking
production flexibility to customers’ needs for variety.
A classic example is provided by Benetton, the Italian fashion goods manufacturer and distributor, which has created a worldwide business based upon
responsiveness to fashion changes – with a particular emphasis upon colour. By
developing an innovative process whereby entire knitted garments can be dyed in
small batches, they reduced the need to carry inventory of multiple colours, and
because of the small batch sizes for dying they greatly enhanced their flexibility.
Benetton’s speed of response is also assisted by the investment that they have
made in high-speed distribution systems, which are themselves aided by rapid
feedback of sales information from the marketplace.
Many companies are now seeking to construct supply chains to enable them to
support a marketing strategy of mass customisation. The idea behind this is that
today’s customers in many markets are increasingly demanding tailored solutions
for their specific requirements. The challenge is to find ways of achieving this marketing goal without increasing finished goods inventory and without incurring the
higher costs of production normally associated with make-to-order.
Often this can be achieved by postponing the final configuration or assembly of
the product until the actual customer requirement is known – a strategy pursued by
Dell and Hewlett Packard, for example.
In other cases high technology in the form of computer-aided design/computer-aided manufacturing (CAD/CAM) can provide the means for this mass
customisation.
Logistics systems dynamics
One of the major advantages of moving to QR and synchronous supply chain strategies is that, by reducing lot quantities and increasing the rate of throughput in the
logistics system, modulations in the level of activity in the pipeline can be reduced.
Logistics systems are prone to what has been called the ‘Bullwhip’ or ‘Forrester
Effect’, after Jay Forrester, who developed a set of techniques known as Industrial
Dynamics.Forrester defined industrial dynamics as:
154
LOGISTICS & SUPPLY CHAIN MANAGEMEN T
The study of the information feedback characteristics of industrial activity to
show how organizational structure, amplification (in policies) and time delays
(in decisions and returns) interact to influence the success of the enterprise.
It treats the interactions between the flows of information, money, orders,
materials, personnel, and capital equipment in a company, an industry or a
national economy.6
Using a specially developed computer simulation language, DYNAMO, Forrester
built a model of a production/distribution system involving three levels in the distribution channel: a retailer’s inventory, a distributor’s inventory and a factory
inventory. Each level was interconnected through information flows and flows of
goods. The model used real-world relationships and data and included parameters such as order transmission times, order processing times, factory lead times
and shipment delivery times. Management could then examine the effects on the
total system of, say, a change in retail sales or the impact of changing production
levels or any other policy change or combination of changes.
What becomes apparent from this modelling of complex systems is that small
disturbances in one part of the system can very quickly become magnified as the
effect spreads through the pipeline.
For example, many consumer product companies that are heavy spenders
on trade promotions (e.g. special discounts, incentives, etc.) do not realise what
the true costs of such activities are. In the first instance there is the loss of profit
through the discount itself, and then there is the hidden cost of the disturbance to
the logistics system. Consider first the loss of profit. When a discount is offered for
a limited period then that discount obviously will apply to all sales – not just any
incremental sales. So if sales during the promotional period are, say, 1,100 cases
but without the promotion they would have been 1,000, then whilst the incremental revenue comes only from the additional 100 cases, the discount applies to all
1,100. Additionally the retailer may decide to take advantage of the discount and
‘forward order’; in other words buy ahead of requirement to sell at a later time at
the regular price. One study7 found that for these reasons only 16 per cent of promotions were profitable, the rest only ‘bought sales’ at a loss.
The second impact of promotional activity on profit is the potential it provides
for triggering the ‘acceleration effect’ and hence creating a Forrester-type surge
throughout the logistics pipeline. This is because in most logistics systems there
will be ‘leads and lags’, in other words the response to an input or a change in the
system may be delayed. For example, the presence of a warehouse or a stock
holding intermediary in the distribution channel can cause a substantial distortion
in demand at the factory. This is due to the ‘acceleration effect’, which can cause
self-generated fluctuations in the operating characteristics of a system.
As an example, imagine a retailer with an inventory management reordering strategy based on starting each week with the equivalent of three weeks’ demand in
stock. So if weekly demand were 100 units for a particular item the target starting
inventory would be 300 (i.e. 100 × 3). Now let us assume that as a result of a promotion demand increases by 10 per cent to 110. This means that the system would
place an order to bring the next week’s starting inventory up to 330 (i.e. 110 × 3). So
the reorder quantity would have to be 140 (i.e. the 110 units sold to consumers plus
the extra 30 required to meet the new starting level).
THE SYNCHrONOUS SUPPLY CHAIN
155
In this particular case an increase in consumer demand of 10 per cent leads to
a one-off increase in demand on the supplier of 40 per cent!
If in the next period consumer demand were to fall back to its old level then the
same effect would happen in reverse.
It is not unusual for companies undertaking frequent promotional activity to experience considerable upswings and downswings in factory shipments on a continuing
basis. Figure 7.9 illustrates the lagged and magnified effect of such promotional
activity upon the factory. It can be imagined that such unpredictable changes in production requirements add considerably to the unit costs of production.
Figure 7.9 The impact of promotional activity upon production requirement
Volume
Retail
sales
Production
requirement
Norm
In the grocery industry, where much of this promotional activity is found, there is a
growing recognition of the need to achieve a closer linkage between the ordering
policies of the retail trade and the manufacturing schedules of the supplier. In the
United States it was estimated that the time from the end of the production line to
purchase by the consumer in a retail store was 84 days for a typical dry grocery
product (see Figures 7.10 and 7.11).
This means that the ‘tidal wave’ effect of changes in demand can be considerably magnified as they pass through all the intermediate stock holding and reorder
points. One of the benefits of a quick response system is that by linking the retail
check-out desk to the point of production through electronic data transfer, the
surge effect can be dramatically reduced. This fact alone could more than justify
the initial investment in linked buyer/supplier logistics information systems.
156
LOGISTICS & SUPPLY CHAIN MANAGEMEN T
Figure 7.10 Grocery industry delivery system order cycle
Retailer
Initiate
order
Remove
product from
shelf
Inventory
depletion
Manufacturer
Order
transmission
Receive order
and initiate
processing
In-store
inventory
storage
Place on
shelf
Order
processing
Retail
warehouse
storage
Warehouse
order
Complete
production
and store
Production
Authorise Manufacturer
shipment inventory
depletion Initiate
production
cycle
Delivery
Receive
shipment and
store
Raw
material
storage
Purchase
materials
Interface
Source: Grocery Manufacturers Association of America
Figure 7.11 Grocery industry product flow
Retailer
Manufacturer
1 day
Initiate
order
Remove
product
from shelf
24 days
Place
on shelf
18 days
Order
Inventory transmission
depletion
Receive order
and initiate
processing
Initiate
order
Retail
warehouse
storage
Order
processing
36 days
Complete
Warehouse production
and store
storage
Authorise
shipment
Manufacturer
inventory
depletion
Production
Initiate
production
cycle
Delivery
Receive
shipment
and store
1–3 days
6 days
Raw material
storage
Purchase
materials
Interface
Source: Grocery Manufacturers Association of America
THE SYNCHrONOUS SUPPLY CHAIN
157
References
1. Rayport, J.F. and Sviokla, J.J., ‘Managing in the marketspace’, Harvard
Business Review, November–December 1994.
2. Chandrashekar, A. and Schary, P., ‘The virtual web-based supply chain’, in
Franke, U. (ed.), Managing Virtual Web Organizations in the 21st Century, Idea
Group Publishing, 2002.
3. Heinrich, C., Adapt or Die: Transforming your Supply Chain into an Adaptive
Business Network, John Wiley & Sons, 2003.
4. Lowson, R., King, R. and Hunter, A., Quick Response: Managing the Supply
Chain to Meet Consumer Demand, John Wiley & Sons, 1999.
5. Lei, D. and Goldhars, J.D., ‘Computer-Integrated manufacturing: redefining
the manufacturing firm into a global service business’, International Journal of
Operations & Production Management, Vol. 11, No. 10, 1991.
6. Forrester, J., Industrial Dynamics, MIT Press, 1961.
7. Abraham, M.M. and Lodish, L.M., ‘Getting the most out of advertising and
promotion’, Harvard Business Review, May–June 1990.
158
LOGISTICS & SUPPLY CHAIN MANAGEMEN T
Complexity and the
supply chain
MM
The sources of supply chain complexity
MM
The cost of complexity
MM
Product design and supply chain complexity
MM
Mastering complexity
8
We have several times in previous chapters suggested that rather than refer to
supply chains we should talk instead about networks. The idea of a chain suggests
a series of linear one-to-one relationships whereas the reality is that the focal firm
lies at the centre of a complex web of interconnected and interrelated yet independent entities.
Partly as a result of outsourcing activities that previously were performed inhouse combined with the trend to offshore manufacturing, many companies have
found that they have added to the complexity of their operations because the
degree of interdependency across the network has increased. Thus an event or
action taking place in one part of the network will often have unforeseen impacts
somewhere else in the network. The unpredictability of these events is heightened
by the growing volatility that characterises today’s business environment.
The well-known ‘butterfly’ effect seems to typify much of today’s supply chain
turbulence. The idea is that a butterfly, flapping its wings somewhere over the
Amazon basin, can cause a hurricane thousands of miles away! Whilst this example of what is sometimes described as ‘chaotic’ effects may be a little far-fetched,
it provides a useful reminder of how the ‘law of unintended consequences’ applies
to today’s highly interconnected supply chains.
In April 2010 a previously dormant volcano in Iceland erupted, sending a plume
of ash into the upper atmosphere. A cloud of ash and debris from the eruption
began to drift across the skies of Northern Europe. Because of a concern for aircraft safety most airports in the region were closed for the best part of a week.
Whilst there was a considerable impact on individuals’ travel plans – many thousands of people were stranded away from home – there was also a less visible,
159
but significant, impact on a number of supply chains. Many time-critical components are sent by air freight or air express and as major hubs in the UK and
continental Europe were forced to close, the ‘butterfly effect’ was felt around the
world. The extract from The Times below illustrates some of the problems caused
by a volcano a long way from the factories that were affected, and thus highlights
the increasing interconnectedness of global supply chains.
Parts shortage starts to choke production
The impact of the ash cloud has been felt on the economy for the first time, with
manufacturing companies warning that they will have to shut down production
because of a shortage of components.
Airbus, the aircraft manufacturer, said yesterday that its wing assembly facility in
North Wales would have to slow or shut production within days if the airspace did
not reopen.
The company, which employs 11,000 people in Britain, has been unable to get
parts into the country. It has also been unable to fly completed wings to Airbus’s
other factories in Hamburg and Toulouse, which could result in the final assembly
of aircraft grinding to a halt.
The impact on the globalised nature of industry has affected Nissan. Two factories in Japan will stop production of cars from today after running out of a key
component sourced from the Irish Republic.
The closure of airspace is estimated to be costing the European economy about
£400 million a day in lost productivity.
SOURCE: ROBERTSON, D. AND DEROUX, M., ‘PARTS SHORTAGE STARTS TO
CHOKE PRODUCTION’, THE TIMES, 21 APRIL 2010
In its strictest sense, complexity does not mean complicated (although complex
systems often are complicated) but rather it describes a condition of interconnectedness and interdependency across a network. A good example of a complex
system is the weather. Many different influences combine to create a specific
weather condition; each of those influences are themselves the result of interactions and hence a small change in one element can fundamentally affect the final
outcome. Hence the difficulties faced by weather forecasters trying to predict even
tomorrow’s weather.
Therefore the outcome of complexity in a supply chain, as with the weather, is
uncertainty and with that uncertainty comes an increased likelihood that forecast
error will increase in line with complexity. This growing uncertainty brings with it a
serious challenge to the classic practice of running the business on the basis of
forecasts. It will be apparent that in conditions of stability – and hence lower uncertainty – forecast accuracy should generally be high. Equally, the converse will be
true, i.e. as uncertainty increases so too will forecast accuracy reduce. Hence the
160
LOGISTICS & SUPPLY CHAIN MANAGEMEN T
argument that if uncertainty is to be the norm – at least for the foreseeable future
– then a new approach will be required. Indeed, the challenge that organisations
now face is how to reduce their dependence on forecasts and to become increasingly demand- and event-driven.
The sources of supply chain complexity
Complexity in a supply chain can arise from a number of sources and some of the
most common causes are detailed below.
1 Network complexity
The more nodes and links that exist in a network then clearly the more complex it becomes. As a result of outsourcing non-core activities many companies
are today much more reliant on external suppliers of goods and services. Those
external suppliers also are dependent upon a web of second tier suppliers, and
so on. There is a strong likelihood that the focal firm at the centre of the network
will not even be aware of many of the second or third tier suppliers that feed their
upstream supply chain. The potential for unexpected disruptions to the supply
chain is clearly heightened by these extended networks as evidenced by the following example.
Following the shut-down of Dell’s American assembly line within days of the
September 1999 earthquake in Taiwan the company set out to understand why this
had happened.
To do this Dell studied where their tier-one suppliers did their shopping and
this in turn soon yielded the first important answer – the Taiwan Semiconductor
Manufacturing Corporation (TSMC). Dell’s executives realised that they were in fact
buying hundreds of millions of dollars of chips each year from TSMC indirectly.
Source: Abridged from Lynn, B.C., The End of the Line, Doubleday, 2005
2 Process complexity
Underpinning every supply chain are innumerable processes – processes internal
to the firm as well as those processes managed by upstream and downstream
partners. Often these processes have been developed in a haphazard way and
have been added to and modified to reflect current requirements and as a result
have become more complex. This complexity is manifested in processes with multiple steps, often performed in series rather than in parallel.
Lengthy processes containing many different activities will not only create
extended lead times but are also more prone to variability in performance.
COM P LEXITY AND THE SUPPLY CHAIN
161
The more steps in a process and the more ‘hand-offs’ that exist, the greater
the likelihood that there will be frequent discrepancies between planned and
actual outcomes.
There is a need for a constant review of process structure and a consequent
re-engineering if this pervasive source of supply chain complexity is to be kept to
a minimum.
When end-to-end supply chains are examined in detail it usually transpires
that the majority of time is non-value-adding time. More often than not this nonvalue-adding time is idle time – in other words time spent as inventory. This
non-value-adding time is itself generated by the processes that underpin the
supply chain.
3 Range complexity
Most business organisations find that the range of products and/or services that
they offer to the market has a tendency to grow rather than reduce. The rate of
introduction of new products or services, new pack sizes or variants and brand
extensions seems to outpace the rate at which existing products or services are
eliminated. The general effect of this mushrooming of the product/service portfolio
is to extend the ‘long tail’ of the Pareto distribution.
Typically as more variants are added to a range the demand per variant will
reduce, with a subsequent impact on forecast accuracy. Consider the difference
between the Ford Motor Company at the time of Henry Ford I producing a single
model – the Model T, with the reputed offer of ‘any colour you like as long as it’s
black’ – with the company today.
Ford, even in today’s troubled markets, offers a vast range of models with
extensive options. In theory there are possibly millions of different variants! This
multiplication of the product range means that, inevitably, the average demand per
variant is very low. Hence the difficulty of forecasting at the individual variant level
and thus the typically large inventories that build up as a result of forecast error.
4 Product complexity
The design of products can have a significant impact on supply chain complexity.
It can be argued that the supply chain begins on the drawing board in that decisions on the choice of materials and components can directly or indirectly impact
total life cycle costs as well as agility and responsiveness.
Product complexity can arise because the number of components or subassemblies is high, or because there is little commonality across the Bills of
Materials for different products. The less the commonality at the Bill of Materials
level the less the flexibility to vary product mix or volume.
A further unforeseen impact of product design decisions is that if components or materials are specified which happen to have lengthy replenishment lead
times then the ability to respond rapidly to changes in demand for the product will
be impeded.
162
LOGISTICS & SUPPLY CHAIN MANAGEMEN T
By involving logistics and supply chain planners early in the design process
much of the subsequent complexity can be avoided. For example, at Motorola all
new product ideas are screened for complexity1 before they can be considered
for commercialisation.
In the past at Motorola there was often little commonality of parts across the
range. For a single mobile phone there could be over 100 possible configurations,
i.e. four different colours and 30 software choices. Furthermore, these product variations were made ahead of demand to a forecast that was only accurate 3 per
cent of the time! To tackle this problem Motorola devised a ‘Complexity Index’ for
each product, which included the number of components, the degree of commonality, lead time of supply and so on. Ideas for new products with high scores on
the Complexity Index tend not to be proceeded with.
5 Customer complexity
Customer complexity arises as a result of too many non-standard service options
or customised solutions. The costs of serving different customers can vary significantly. Each customer will exhibit different characteristics in terms of their ordering
patterns, e.g. frequency of orders, size of orders, delivery requirements and so on.
These differences will be increased further as a result of the availability of different
service options or packages and/or customisation possibilities.
Gottfredson and Aspinall give an example of how too extensive a service offer
can add complexity to the sales process:
One telecommunications company, for example, has used the power of
information technology to slice and dice its service set into ever more finely
differentiated options. The firm hoped it would boost revenues by more precisely
fulfilling the needs of every imaginable buyer. But offering so many options has
had the opposite effect. The company’s customer service reps are now forced
to sort through more than a thousand promotion codes whilst they’re talking to a
potential customer. Most of the promotions offer distinct levels of discounts and
product benefits. Making sense of them all is an overwhelming task.2
Even though from a sales and marketing perspective there may be advantages to
be gained from offering a range of options to customers, these decisions must be
tempered by a detailed knowledge of their cost and agility implications. Ultimately
the only complexity that can be justified is that complexity which delivers real value
for which customers are prepared to pay.
A problem that is faced by many businesses is that they have a limited understanding of the true costs of servicing individual customers. It is quite possible that
because some customers generate a high cost-to-serve and order products with
relatively low margins they could actually lose money for the company. Using tools
such as activity-based costing can help identify those customers whose cost-toserve is high relative to the revenue that they generate. Using this information,
alternative service options might be devised that could improve the profitability of
those customers.
COM P LEXITY AND THE SUPPLY CHAIN
163
6 Supplier complexity
The size of the supplier base can add to supply chain complexity by increasing
the number of relationships that must be managed as well as increasing total
transaction costs. Because one of the pre-requisites for agility is a high level of
collaborative working with key suppliers, this implies a high level of active supplier
management and supplier involvement in process integration. It is unlikely that this
degree of closeness can be achieved across a diverse supplier base and hence
the need for rationalisation. The implications of such a supply base rationalisation
are profound. Clearly careful regard must be paid to the effect of a smaller number
of suppliers on the resulting supply chain risk profile. Too high a level of dependence on just a few critical suppliers can be dangerous. Instead a better option,
if available, is to have a lead supplier across a category of products who takes
responsibility for the management of that category across a number of suppliers,
for example in the same way a logistics service company such as UPS might coordinate a number of logistics and transport providers for a client company.
With a smaller supplier base, a company can more proactively manage supplier
relationships through ‘supplier development’ programmes. Typically such programmes involve the company working closely with individual suppliers to identify
opportunities to improve not just product quality, but also process quality and to
work jointly on cost-reduction initiatives.
5 Organisational complexity
Most businesses have traditionally organised around functions and departments
and their organisation charts have many levels and tend to be hierarchical in their
structure. Such ‘vertical’ organisational arrangements are no doubt administratively
convenient in that there can be a ‘division of labour’ between functions as well as
effective budgetary control. However, they tend to inhibit agility because they are,
of necessity, inwardly looking with a focus on efficiency rather than customer facing
with a focus on effectiveness. A further problem is that over time the functions have
a tendency to become ‘silos’ with their own agendas and they can lose sight of the
fundamental purpose of the business, i.e. to win and keep profitable customers.
The challenge is to find a way to break through these silos and to re-shape the
organisation around the key value-creating and value-delivery processes. Such
process-oriented businesses are ‘horizontal’ rather than ‘vertical’ in their orientation. They are cross-functional and hence there is a stronger emphasis on teams
and on process improvement in terms of speed and reliability.
As organisations grow, either organically or through merger and acquisition, the
likelihood is that they will become more cumbersome and less able to respond
rapidly to change. Consequently there is a constant need to re-engineer existing
processes and to root out the complexity that will inevitably arise if things are left
to themselves. Organisational complexity can also be exacerbated by having to
work across time zones and cultures as a result of the globalisation of business.
Frequently this added complexity is an unintended consequence of low-cost country sourcing and/or cross-border mergers.
164
LOGISTICS & SUPPLY CHAIN MANAGEMEN T
8 Information complexity
Today’s supply chains are underpinned by the exchange of information between
all the entities and levels that comprise the complete end-to-end network. The
volume of data that flows in all directions is immense and not always accurate and
can be prone to misinterpretation. Visibility of actual demand and supply conditions can be obscured through the way that information is filtered and modified
as it passes from one entity or level to another. The so-called ‘bullwhip’ effect is
a manifestation of the way that demand signals can be considerably distorted as
a result of multiple steps in the chain. As a result of this distortion, the data that is
used as input to planning and forecasting activities can be flawed and hence forecast accuracy is reduced and more costs are incurred.
In a sense, information complexity in a supply chain is directly or indirectly
influenced by the preceding seven sources of complexity. Network and process
complexity will impact the number of stages, steps and levels through which the
information must pass; range and product complexity add variety and lead to multiple Bills of Materials and hence more data; customer and supplier complexity
means that the exchange of data increases significantly and organisational complexity implies more levels through which information must pass as well as more
hand-offs from one function to another.
The antidote to information complexity is firstly a reduction in the other seven
sources of complexity as well as greater visibility. A key to that visibility has to be
a greater level of collaborative working across the supply chain where information
transparency is seen as a vital pre-requisite for a more efficient and effective value
delivery system.
The cost of complexity
It can be argued that an increasing proportion of total end-to-end costs in the
supply chain are driven by complexity in one form or another. Often these costs
may not be readily transparent as they are hidden in general overheads or the
costs of carrying inventory, which as we observed in Chapter 3 are not always
properly accounted for.
Underlying much of the cost of complexity in the supply chain is the Pareto Law
(the so-called 80:20 rule). Vilfredo Pareto (1848–1923) was an Italian industrialist,
sociologist, economist and philosopher. In 1909 he identified that 80 per cent of the
total wealth of Italy was held by just 20 per cent of the population. Thus was born the
80:20 rule that has been found to hold across many aspects of social and economic
life. In Chapter 2 it was suggested that an 80:20 relationship exists with regard to
customers and products, i.e. typically 80 per cent of the profit derives from 20 per
cent of the customer and likewise 80 per cent of the profit comes from just 20 per
cent of the products. Generally this 80:20 relationship applies across most elements
of the supply chain and is a key contributor to complexity and hence cost.
Most businesses will find if they perform an 80:20 analysis that they have a
‘long-tail’ of customers who, whilst significant in numbers, actually contribute very
COM P LEXITY AND THE SUPPLY CHAIN
165