Concept and methodology for evaluating core damage frequency considering failure correlation at multi units and sites and its application
Bạn đang xem bản rút gọn của tài liệu. Xem và tải ngay bản đầy đủ của tài liệu tại đây (8.48 MB, 16 trang )
Nuclear Engineering and Design 288 (2015) 82–97
Contents lists available at ScienceDirect
Nuclear Engineering and Design
journal homepage: www.elsevier.com/locate/nucengdes
Concept and methodology for evaluating core damage frequency
considering failure correlation at multi units and sites and its
application
K. Ebisawa a , T. Teragaki a , S. Nomura a , H. Abe a,∗ , M. Shigemori b , M. Shimomoto b
a
b
Former Incorporated Administrative Agency, Japan Nuclear Safety Organization, Japan
Mizuho Information & Research Institute, 2-3, Kanda-Nishikicho, Chiyoda-ku, Tokyo, Japan
h i g h l i g h t s
•
•
•
•
We develop a method to evaluate CDF considering failure correlation at multi units.
We develop a procedure to evaluate correlation coefficient between multi components.
We evaluate CDF at two different BWR units using correlation coefficients.
We confirm the validity of method and correlation coefficient through the evaluation.
a r t i c l e
i n f o
Article history:
Received 26 February 2014
Received in revised form
24 December 2014
Accepted 6 January 2015
a b s t r a c t
The Tohoku earthquake (Mw9.0) occurred on March 11, 2011 and caused a large tsunami. The Fukushima
Daiichi Nuclear Power Plant with six units were overwhelmed by the tsunami and core damage occurred.
Authors proposed the concept and method for evaluating core damage frequency (CDF) considering failure correlation at the multi units and sites. Based on the above method, one of authors developed the
procedure for evaluating the failure correlation coefficient and response correlation coefficient between
the multi components under the strong seismic motion. These method and failure correlation coefficients
were applied to two different BWR units and their CDF was evaluated by seismic probabilistic risk assessment technology. Through this quantitative evaluation, the validity of the method and failure correlation
coefficient was confirmed.
© 2015 The Authors. Published by Elsevier B.V. This is an open access article under the CC BY-NC-ND
license ( />
1. Introduction
The Tohoku earthquake (Mw9.0) occurred at 14:46 on March
11, 2011 and caused a large tsunami. The strong seismic motion
was observed at the Fukushima Daiichi Nuclear Power Plant (F1NPP) with six units and reactors were shut down after control rods
had been inserted. While the reactors were shut down normally,
they were then overwhelmed by the tsunami about 46 min after
the earthquake occurred. The various components of the water
intake system and emergency diesel generators were flooded.
External power supply was also lost due to damage by strong seismic motions and the tsunami. In this situation, station blackout
occurred. As a consequence, reactor cooling system functions were
∗ Corresponding author at: 1-9-9 Roppongi, Minatoku, Tokyo 106-8450, Japan.
Tel.: +81 3 5114 2226; fax: +81 3 5114 2236.
E-mail address: Hiroshi (H. Abe).
lost, core damage occurred and radioactive materials were released
to the off-site area (Japanese Government, 2011).
Regarding PRA methodology relating earthquake and earthquake induced tsunami, implementation standards considering the
combination of these events are to be developed.
However, in Japan, AESJ at first published Seismic PRA implementation standard (Hirano et al., 2008; Atomic Energy Society of
Japan, 2009). Then tsunami PRA implementation standard (Atomic
Energy Society of Japan, 2011) was published, referring research
results (Ebisawa et al., 2012a) of tsunami PRA.
Concept of considering combination of seismic and tsunami
events was developed by one of this paper authors after Fukushima
Daiichi (F1-NPP) accident (Ebisawa et al., 2012b). The concept
was referred in revised seismic PRA implementation standard
(Narumiya et al., 2014).
And, the current issues related to seismic PRA and tsunami PRA,
based on lessons learned from the Fukushima Daiichi accident are
methodology for evaluating core damage frequency (CDF) at multi
units and sites.
/>0029-5493/© 2015 The Authors. Published by Elsevier B.V. This is an open access article under the CC BY-NC-ND license ( />0/).
K. Ebisawa et al. / Nuclear Engineering and Design 288 (2015) 82–97
83
Fig. 1. Situation of tsunami (by Tokyo Elec. Power Co., 2011).
The concerning points related to these issues which crossing
over plural units and sites are;
(1) Correlation of damage between plural components.
(2) Damage of shared facilities (sea water supply system, electric
power sharing, off site power supplier, etc.)
(3) Human reliability, etc.
In these issues related to the multi units and sites, there are
many studies (Fleming, 1999; Jung, 2003; Fleming, 2005; Hakata,
2006; Schroer, 2012; Kawamura, 2014).
In these studies, Fleming (2005) referred about the idea of site
risk metrics instead of the typical CDF and large early release
frequency (LERF) characterization. This idea is no simple way to
manipulate the single-unit PRA to capture risk from multi-unit
plant. Schroer (2012) described about a thorough classification of
multi-unit risk interactions and dependencies, along with the application of such categories to the existing methods for multi-unit CDF
evaluation.
Kawamura (2014) picked up the issue of human reliability based
on experience in Fukushima Daini NPP at the Tohoku earthquake
and pointed up the importance of close collaboration between software and hardware.
On the other hand, authors proposed the concept and method
for evaluating CDF considering failure correlation at the multi units
and sites (Ebisawa et al., 2012c). Based on the above method, one of
authors developed the procedure for evaluating the failure correlation coefficient and response correlation coefficient between the
multi components under the strong seismic motion (Ebisawa et al.,
2012c). These procedure and failure correlation coefficients were
applied to two different BWR units and their CDF was evaluated.
Through this quantitative evaluation, the validity of the method
and failure correlation coefficient was confirmed.
This paper describes the overview of the F1-NPP accident.
The paper highlights the concept and methodology for evaluating
CDF considering failure correlation at multi units and sites. Furthermore, the paper also refers the evaluation results that these
procedure and failure correlation coefficients were applied to two
different BWR units.
2. Overview of Fukushima NPP accident and lessons
learned from the accident
2.1. Overview of F1-NPP accident at Tohoku earthquake/tsunami
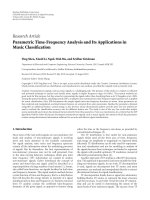
F1-NPP was overwhelmed by a tsunami about 46 min after the
earthquake as shown in Fig. 1. The tsunami height was so high that
the experts estimated it to be more than 10 m from a photograph
showing the overflow status of tsunami seawall (10 m) in Fig. 1
(Japanese Government, 2011; Ebisawa et al., 2012c; Kameda, 2012).
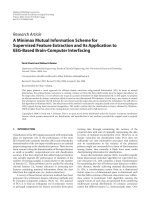
Fig. 2. (c) Illustration of sea water supply system and situation of tsunami disaster at Fukushima Daiichi nuclear power plant (by Tokyo Elec. Power Co., 2011).
84
K. Ebisawa et al. / Nuclear Engineering and Design 288 (2015) 82–97
Fig. 3. Procedure of seismic PRA.
As to the sea water pump facilities for component cooling,
all units were flooded by the tsunami as shown in Fig. 2. The
Emergency Diesel Generators and switchboards installed in the
basement floor of the reactor and the turbine buildings were
flooded except for Unit 6, and the emergency power source supply was lost (Japanese Government, 2011; Ebisawa et al., 2012c;
Kameda, 2012).
On the other hand, operator succeeded to start RCIC and operate controlling residual heat well, however, RCIC stopped to work
after two days. Cooling systems in FL other than RCIC were not
operated due to a loss of AC power. Failure of reactor core cooling
resulted in core damage in about 5 or 6 h. Temperature and pressure in the primary containment vessel rose up, and radioactive
materials were released through seals into the power plant and
then the surrounding area. Consequently, a wide area was contaminated by the radioactive materials (Japanese Government, 2011;
Ebisawa et al., 2012c; Kameda, 2012).
2.2. Lessons learned from the F1-NPP accident
The current issues of seismic engineering based on lessons
learned from F1-NPP accident are referred as follows (Ebisawa et al.,
2012c);
(i) Occurrence of gigantic main earthquake and tsunami, a combination of seismic hazard and tsunami hazard,
(ii) Consideration of gigantic aftershock and triggered earthquake,
(iii) Core damage over a short period of time based on functional
failure of support systems (seawater supply, power supply and
signal systems),
(iv) Common cause failure of multi structures and components,
(v) Dependency among neighboring units,
(vi) External events risk evaluation at multi units and sites and
(vii) Combined emergency of both natural disaster and the nuclear
accident.
Fig. 4. Outline of logic tree.
K. Ebisawa et al. / Nuclear Engineering and Design 288 (2015) 82–97
85
The contents related to the issue (iii), (v), (vi) and (vii) are found in
chapters 4 and 5.
3. Outline of seismic PRA
3.1. Seismic PSA Procedure (Atomic Energy Society of Japan,
2009)
The procedure of seismic PRA consists of five steps as shown in
Fig. 3.
- Step 1: Collection of information related to earthquakes and the
setting of accident scenarios
- Step 2: Seismic hazard evaluation
- Step 3: Fragility evaluation
- Step 4: Accident sequence evaluation
- Step 5: Documentation
In the above procedure, core damage frequency (CDF) is evaluated by the following Eq. (1).
∞
CDF =
−
0
dH(∝)
d∝
P(∝)d ∝
(1)
where H(˛) is seismic hazard, P(˛) is core damage probability, ˛ is
peak ground acceleration at bedrock.
Fig. 5. Accident sequence evaluation.
These issues are connected as the following perspectives based
on the above 2.1.2 damage of F1-NPP.
- Weak site protection despite the evidence on the chance of simultaneous tsunami and earthquake is corresponded to the above (i)
and (ii).
- Flood damage to safety related switchgears and emergency generating diesels, which were located in the basement of turbine
buildings as the key cause of Station Blackout to units 1–4 is
corresponded to the (iii).
- Inadequate use of plant-specific and internal flood PRA to identify
and improve safety vulnerabilities is corresponded to the (iii).
- Inadequate knowledge and awareness about the multi-unit
dependencies and interactions is corresponded to the (iv)–(vi).
- Insufficient accident management and planning on all the plant
units, as well as government agencies is corresponded to the (vi)
and (vii).
3.2. Collection of information related to earthquake and setting of
accident scenario (Atomic Energy Society of Japan, 2009)
The collection of information related to earthquakes and the
setting of accident scenarios is shown in Fig. 3. First, relevant information should be gathered. Then, a “plant walk-down” based on the
gathered information should be conducted. Finally, various accident scenarios based on gathered relevant information and results
of the “plant walk-down” should be set.
3.3. Seismic hazard evaluation (Atomic Energy Society of Japan,
2009)
The evaluation of the seismic hazard should be considered
“aleatory uncertainty” and “epistemic uncertainty”. The former
derives from phenomenology and the latter derives from a lack
of recognition and information. The epistemic uncertainties exist
in the source models and propagation models of seismic motion as
described above. Evaluation of epistemic uncertainty is conducted
by using a logic tree (LT) with this epistemic uncertainty as a target
as shown in Fig. 4.
Fig. 6. Examples of location of nuclear power plants at Japan.
86
K. Ebisawa et al. / Nuclear Engineering and Design 288 (2015) 82–97
Fig. 7. Concept of evaluation of response correlation.
3.4. Fragility evaluation (Atomic Energy Society of Japan, 2009)
3.5. Accident sequence evaluation (Atomic Energy Society of
Japan, 2009)
The fragility F(˛) of component is evaluated by the following Eq.
(2).
∞
F(˛) =
xR
fR (˛, xR )
0
fC (x)dx
(2)
dxR
0
where fR (˛,xR ) is realistic response of component represented
as logarithmic normal distribution (median MR (˛), logarithmic
standard deviation ˇR ) by the following Eq. (3). fR (˛,xR ) is capacity of component represented as logarithmic normal distribution
(median MC , logarithmic standard deviation ˇC ) by the following
Eq. (4). ˛ is peak ground acceleration of seismic motion at bedrock.
1
1
−
2
exp
fR (˛, xR ) = √
2 ˇR x
1
fC (x) = √
exp
2 ˇC x
−
1
2
ln(x/MR (˛))
ˇR
ln (x/MC )
ˇC
In cases of needing to evaluate accident sequences, the
sequences are represented by using an event tree (ET) based on various accident scenarios. The developed fault trees (FTs) that consist
of each event tree are shown in Fig. 5.
Core damage probabilities (CDPs) are evaluated by using ETs,
FTs and by examining the fragilities of components. The CDF is
estimated by multiplying the seismic hazard curve per Gal by CDP
curve, which then corresponds to a semicircular shape area that is
calculated by the integration of seismic motion acceleration (Gal).
3.6. Calculation code for seismic PRA and tsunami PRA
(3)
JNES developed the code for evaluating seismic and tsunami
margins based on seismic PRA and tsunami PRA technologies and
called as the calculation code SANMARG (JNES, 2014a,b). SANMARG
has the following main functions.
(4)
(1) Function of seismic PRA from the above 3.2 to 3.5
(2) Function of tsunami PRA as the same procedure from the above
3.2 to 3.5
2
2
Fig. 8. Concept regarding influence on CDP of failure correlation.
K. Ebisawa et al. / Nuclear Engineering and Design 288 (2015) 82–97
87
Fig. 9. Target buildings and components.
(3) Function considering failure correlation
(4) Function of both single unit and multi units
(5) Function of both ET/FT analysis and large FT analysis
The standardization of the plant seismic design in Japan has been
advanced. However, under strong seismic motion, it is very likely
that various structures and components at multi units and sites
would fail at the same time.
4. Concept and methodology regarding failure correlation
of at multi units and sites
4.1. Characteristics of multi units and sites (Ebisawa et al., 2012c)
4.2. Concept regarding failure correlation at multi units and sites
(Ebisawa et al., 2012c)
Seismic ground motion influence on the region is about 150 km
in radius on the seismic hazard of Japan. There are multi units and
sites in the region such as Wakasa region with 14 units and five
sites in Japan as shown in Fig. 6.
JNES has been studying from the viewpoint of “Correlated Seismic Motion Methodology”, “Correlation of component’ response in
the buildings at the same site” and “multi-unit and site evaluation
methodology” as shown in Fig. 7.
Fig. 10. Analysis models of response correlations.
88
K. Ebisawa et al. / Nuclear Engineering and Design 288 (2015) 82–97
j in unit J and that of Fk of component k in unit K. Fj and Fk are
represented as follows.
Fj = ln
Fk = ln
Fig. 11. Floor response spectra and logarithmic standard deviation.
In addition, it is necessary to determine the “Safety Goal” and
“Performance Goal”.
Concepts regarding influence on CDP of failure correlation are
shown in Fig. 8. Failure correlation is defined as the correlation
coefficient Fj , Fk between performance function Fj of component
fRj
fCj
fRk
fCk
= lnfRj − lnfCj
= lnfRk − lnfCk
where fRj and fCj are response and capacity of component j, respectively. fRk and fCk are those of component k. In Fig. 8, CDPJ and CDPK
are CDP of unit J and K, respectively. CDPJ is bigger than CDPK . CDPJK
is overlap area of CDPJ and CDPK . CDP is CDP considered failure
correlation coefficient between unit J and K.
The right case is dependence (Inclusion) and is 1 (Complete
subordination). CDPK is involved in CDPJ . CDP is CDPJ in relationship of union between J and K (OR case). CDP is CDPK in
relationship of intersection between J and K (AND case). The left
case is dependence (Exclusion) and
is −1 (Mutual exclusion).
CDPK is not involved in CDPJ . CDP is CDPJ + CDPK in OR case. CDP
is 0 in AND case. The center case is independence and is 0 (Complete independence). CDP is CDPJ + CDPK − CDPJK in OR case. CDP
is CDPJK in AND case.
An example of the above left case is relationship between component with seismic isolation and that without seismic isolation.
Since each natural period is large separated, response characteristics of their components are very different. In the components
without seismic isolation, since their response characteristics are
roughly similar, the most realistic case is subordination and is the
range between 0 and 1. In this case, there are the following three
event causes (Fleming, 2005).
(1) Event causes initiating event (IE) on unit J: consequential core
damage (CD) on unit J
(2) Event causes initiating event (IE) on unit K: consequential CD
on unit J
Fig. 12. Response coefficients between the different damping factors and periods at the same lumped mass in the same reactor building.
K. Ebisawa et al. / Nuclear Engineering and Design 288 (2015) 82–97
89
Fig. 13. Response coefficients between the different damping factors and periods at the different lumped mass in the different buildings.
(3) Multi units IE on unit J and unit K: consequential CD on unit J
and unit K
4.3. Methodology for evaluating CDF considering failure
correlation at multi units and sites
j,k
The CDF considering failure correlation at multi units is
expressed by the following equation. In this report, The CDF represents target units as two-units (unit j and unit k).
∞
CDF =
−
0
dH(∝)
·P
d∝
jk (˛)d˛
(5)
where CDF (1/siteyear) is CDF considering failure correlation
between unit j and k. H(˛) is seismic hazard (1/year). P jk (˛) is CDP
considering failure correlation coefficient between unit j and k. ˛
is maximum acceleration at bedrock (Gal).
P jk(˛) is evaluated by the following equation (Atomic Energy
Society of Japan, 2009).
P
jk (˛)
uj
= (2 )−1 (|V|)−1/2
uk
1
− X (˛) · V−1 · X(˛)
2
exp
−∞
−∞
·dxk
dxj
(6)
1
−
correlation of plant response. The second item is correlation of plant
capacity.
xj (˛)
ˇRj · ˇRk
=
2 + ˇ2 ·
ˇRj
Sj
+
·
2 + ˇ2
ˇRk
Sk
ˇSj · ˇSk
2 + ˇ2 ·
ˇRj
Sj
2 + ˇ2
ˇRk
Sk
Rj,Rk
·
Sj,Sk
(8)
where Rj,Rk is the correlation coefficient of response between unit
j and k. ˇRj and ˇRk are the logarithmic standard deviation of
response of unit j and unit k, respectively. Sj,Sk is the correlation
coefficient of capacity between unit j and unit k. ˇSj and ˇSk are the
logarithmic standard deviation of capacity.
4.4. Procedure for evaluating response correlation coefficient and
its evaluation example
4.4.1. Definition of response correlation (Ebisawa et al., 2012c)
Response correlation is defined as correlation of sympathetic
vibration behavior depending on the frequency characteristics of
input seismic motions and the vibration characteristics of components and structures.
(7)
4.4.2. Evaluation procedure of response correlation coefficient
(Ebisawa et al., 2012c)
The evaluation procedure and conditions of response correlation
coefficient (CC) are as follows.
where X (˛) is horizontal matrix of response (Xj (˛)) and k (Xk (˛)).
X(˛) is vertical matrix of (xj (˛) and xk (˛)). uj and uk are maximum
value of integral interval which is calculated by the median and
logarithmic standard deviation of the response and capacity. j,k is
failure correlation coefficient between unit j and k. V is correlation
matrix calculated by jk . V−1 is reverse matrix of V.
The jk obtains the following Eq. (8) (Atomic Energy Society of
Japan, 2009; Bohn et al., 1983). In the equation, the first item is
(1) Frequency and phase characteristics of input seismic motions:
30 seismic motions are to be set up in various phase and frequency characteristics.
(2) Level of maximum acceleration of input seismic motions:
300 Gal for linear response region and 2000 Gal for non-linear
response region
(3) Target buildings and components: As shown in Fig. 9, reactor building and heat exchange building in which sea water
X (˛) · V−1 · X(˛)
= [xj (˛)xk (˛)]
=
1
1−
1
1−
j,k
2
j,k
2
j,k
2
(xj (˛) − 2
−
j,k
xk (˛)
1
2
j,k xj (˛) + xk (˛) )
90
K. Ebisawa et al. / Nuclear Engineering and Design 288 (2015) 82–97
Table 1
Relationship of response correlation coefficients between floors levels and periods
under the damping factor 3%.
Period (s)
Floor
Same (0.1)
Different (0.02–0.1, 0.1–0.5)
(4)
(5)
(6)
(7)
Same
Different
1.0
0.6–0.7
0.7–0.8
0.5–0.6
supply system installed. Major target components are indicated
in Fig. 9
Building floor modeling. Building floor on which target components and structures are installed are modeled as 8 mass in
lumped mass vibration model as shown in Fig. 10.
Damping factors of components and structures: 4 value; 1%, 2%,
3%, 5%
Evaluation ranges of response spectra: 5 ranges divided by 0.02,
0.05, 0.10,0.15, 0.50 s, as shown in Fig. 11, for each damping
factor
Estimation equation of CC ( Ri,Rk ): estimation equation of CC
( Ri,Rk ) is Eq. (9).
Ri,Rk
=
Cov(Xi (˛), Xk (˛))
(9)
i k
where Xj (˛) and Xk (˛) are random variables of responses of plant j
and k response. j and k are standard deviations of Xj (˛) and Xk (˛).
Cov (Xj (˛), Xk (˛)) is covariance of Xj (˛) and Xk (˛).
4.4.3. Evaluation examples of response correlation coefficient
(1) Example of response CCs between the different damping factors
and periods at the same lumped mass in the same R/B
The example of response CCs between the different damping
factors and periods at the same lumped mass in the same reactor
building is illustrated in Fig. 12. In this figure, the target lumped
mass number is the example of No. 2. There are various damping
factors and periods. The response correlation coefficients are shown
as the color values. The CCs in the case of the same lumped mass,
damping factor and period are 1.0 and red values in the diagonal
lines.
(2) Example of response CCs between the different damping factors and periods at the different lumped mass in the different
building
The example of response CCs between the different damping
factors and periods at the different lumped mass in the different
building is illustrated in Fig. 13. The response CC between the different damping factors and periods at the same building are orange
color are about 0.7. On the other hand, those at the different building shows green collar are about 0.3.
(3) Results of response correlation coefficient
Table 1 summarizes the CC focused on the difference of floor
levels and natural periods. When two mass points are installed
Fig. 14. Target seismic hazard curve.
on the same level and have the same natural period, CCs are 1.0.
When two mass points are installed on the different level and
have the different natural period, CCs are 0.5–0.6.
As for the change of the correlation coefficient, a few tendencies were seen in the same period though the damping
changed.
4.5. Procedure for evaluating CDF considering failure correlation
at multi units and sites
The procedure for evaluating CDF at multi units and sites consists of two steps. First step is to evaluate the CDF at a single unit
considering failure correlation. Second step is to evaluate at multi
units and sites based on the single unit evaluation result.
(1) Single unit
The procedure to estimate the CDF of a single unit considering
failure correlation is as follows.
(1) In the case of complete independence, identify the significant components which influence the CDF in F-V
importance analysis.
(2) Out of all the identified components, select 3 or 4.
(3) Identify response correlation coefficient.
(4) Use them to carry out CDF evaluation considering the failure
correlation.
In the above (2), criterion of cut-off value for selecting 3
or 4 components is over about F-V value 0.2.
(2) Two or more units
The procedure to estimate the CDF of a multi-unit site considering failure correlation is as follows.
(1) According to the failure correlation treatment targeting two
units, treatment of more than two units is similar to that of
two units.
Table 2
Target units and case and step of evaluation.
Case
Target units
1
2
3
BWR-J
BWR-K
BWR-J and K
Step
1 Complete independence
2 Subordination
3 Complete subordination
ET/FT, Large FT
ET/FT, Large FT
ET/FT, Large FT
Large FT
Large FT
Large FT
K. Ebisawa et al. / Nuclear Engineering and Design 288 (2015) 82–97
Fig. 15. Example of fragility evaluation of emergency diesel generator.
Fig. 16. Example of fragility evaluation of RCW piping supports.
91
92
K. Ebisawa et al. / Nuclear Engineering and Design 288 (2015) 82–97
Fig. 17. Evaluation result of CDF under complete independent at BWR-J.
(2) Treatment of more than two units in detail: first, evaluate
the CDF of each unit, then select only the units which contribute to total CDF. Next, use F-V importance analysis to
identify the significant sequence of the selected units.
(3) Experience so far indicate that 2 or 3 units suffice.
(4) Therefore, limit the number of units to 2 or 3. Then, use a
simplified model which focuses only on severe sequence.
Consider FC and evaluate CDF.
5. Examples of CDF evaluation considering failure
correlation at multi units
5.1. Evaluation conditions
5.1.1. Target site and plant, and used data
(1) Aim of evaluation
The aim of the evaluation is to identify how the failure correlation between the critical components of inside-building to
each-unit CDF affects the overall CDF of the site having the different type units. So in this example, the failures of the common
facilities (seawater supply systems, off-site power grids, etc.)
between multi units are not considered.
(2) Target site and plant
Target site is assumed one in Japan. Target plants were two
different type BWR units modeled with open information. For
convenience, the units were named as BWR-J and K.
(3) Evaluation cases and steps
Table 2 summarizes the evaluation cases and steps. This
example had three cases while each case had three steps. Cases
1 and 2 were to evaluate CDF for single plant while Case 3
was to evaluate CDF combined two units. Step 1 and 3 were
to extract dominant sequences and components in addition to
evaluating CDF with complete independence and complete
subordination. Step 2 was to evaluate CDF with subordination.
(4) Used data
The evaluation data are the open data. The practical examples
of the open data will be described in later Section 5.1.3.
5.1.2. Seismic hazard evaluation data
The seismic hazard is assumed one in Japan and its curves are
shown in Fig. 14. In the curves, the mean one is the red line.
5.1.3. Fragility evaluation data
The fragility evaluation method is based on the Japan Atomic
Energy Research Institute (JAERI) method and called as the
response factor method (Atomic Energy Society of Japan, 2009).
In the realistic response evaluation, design responses are the
open data and response factors (median and logarithmic standard
Fig. 18. Contribution of accident sequences to CDF under complete independent at
BWR-J.
Table 3
Applied accident sequence evaluation approach.
Approach
Purpose in this example
Large FT
ET/FT
To simplify sequence quantification for multi unit evaluation
To pick up dominant sequence in single unit
Dominant sequences of each unit are combined and set up into
Large FT for multi unit
To verify the Large FT method, comparing CDF by ET/FT
approach and Large FT approach in single unit
deviation (LSD) values) are the open data by JAERI (Atomic Energy
Society of Japan, 2009; JNES, 2014a,b). In the realistic capacity evaluation, capacity data are the shaking table data by JNES, and their
median and LSD are the open data by JNES (Atomic Energy Society
of Japan, 2009; Suzuki et al., 2010).
The examples of the fragility evaluation results of emergency diesel generators and RCW pipe supports are shown
in Figs. 15 and 16, respectively. It was important to show
both required and related information, e.g. logarithmic normal
distributions of realistic response and capacity, fragility curves
(mean and some confidence), failure modes and parts, and the
major digital data of such curves.
5.1.4. Failure correlation data
Failure correlation is composed of response and capacity correlations. Response correlation was applied in step 2 (subordination
and complete subordination) with the correlation coefficients analyzed in chapter 4.
On the other hand, no capacity correlation was applied and the
correlation coefficient of capacity was treated as 0. It is the reason that the relationship of capacity correlation between unit j and
k is generally very smaller than that of response treated as to be
independent.
5.1.5. Accident sequence evaluation data
Table 3 summarizes the accident sequence evaluation approach.
The method to evaluate the accident sequence utilizes both large
FT and ET/FT analyses. The former can be used for both case 1 and
2 of a single unit and case 3 of multi units in Table 3. The latter
can be used only within a single unit for case 1 and 2. Authors
recognizes that only former is available to quantify CDF considering
K. Ebisawa et al. / Nuclear Engineering and Design 288 (2015) 82–97
93
Fig. 19. Dominant accident sequence s under complete independent at BWR-J(1/2).
failure correlation between multi components at multi units. The
method using large Fault Tree in this case is not found in documents
surveyed and seems to be originated by authors. The latter is to
verify the evaluation results of case 1 and 2 by the former.
With large FT method, this study extracts accident sequences,
which are generally large in multi units. For example, the total
sequence number of two units combined is 300 × 300 = 90,000,
which is hardly realistic to model. Used ETs and FTs were those
of open information. The number of accident sequences was about
300 for each BWR-J and K units. No human operation was applied
during the earthquake.
5.2. Evaluation of BWR-J unit (case 1)
5.2.1. Step 1 (complete independent)
The seismic hazard, CDP and CDF curves are shown in Fig. 17. The
CDF was 4.7 × 10⁻⁶ (1/reactor year). The contribution of accident
sequences to CDF is shown in Figs. 18–20 illustrate the identification results of dominant accident sequences and shows as the
red color line the top 10 sequences within the figures. The total
CDF of top 10 sequences accounted for 91% of the CDF. The most
critical initiating event was LOSP and accounted for the 90% of the
CDF.
Fig. 20. Dominant accident sequences under complete independent at BWR-J (2/2).
94
K. Ebisawa et al. / Nuclear Engineering and Design 288 (2015) 82–97
Fig. 23. Evaluation result of CDF under complete independent at BWR-K.
Fig. 21. Identification results of dominant components by F-V importance analysis
at BWR-J.
The Fussell-Vesely (F-V) importance analysis results are shown
in Fig. 21. Dominant components contributing to the CDF are all
RCW piping systems (A and B) and emergency DGs (A and B).
5.2.2. Step 2 (subordination and complete subordination)
Based on discussions in Section 5.2.1, failure correlation was
applied between RCW piping and DGs for all lines (A and B). A part of
the large FT is illustrated in Fig. 22. From discussions in Section 4.4,
all failure CCs for subordination were set to be 0.5 for combinations
on the same building, different floor and whose natural periods
were different. Other conditions were the same as those in Step 1.
Table 4 summarizes the evaluation results in the three failure
correlations. The tendency of evaluation results are as follows.
(1) Evaluation results by Large FT method matches with those by
ET/FT method.
(2) Complete subordination-based CDF is about 65% of complete
independence-based CDF.
(3) Subordination-based CDF with a failure correlation coefficient
of 0.5 is about 67% of complete independence-based CDF.
5.3. Evaluation of BWR-K unit (case 2)
5.3.1. Step 1 (complete independent)
The seismic hazard, CDP, and CDF curves are illustrated in Fig. 23.
The CDF was 2.0 × 10⁻⁶ (1/reactor year). The contribution of accident sequences to CDF is shown in Fig. 24. The total CDF of top 10
accident sequences accounted for 93% of the CDF. The most critical initiating event was LOSP and accounted for the 98% of the
CDF.
Fig. 22. Example of part of large fault tree at BWR-J.
K. Ebisawa et al. / Nuclear Engineering and Design 288 (2015) 82–97
95
Table 4
Comparison of evaluation results of CDF at BWR-J.
CDF of BWR-J (1/unit, yr)
Large FT method
ET/FT method
Complete independence CDFCI (CC, : 0)
Subordination CDFPC (CC, : 0.5)
Complete subordination CDFCC (CC, : 1)
4.6 × 10⁻⁶
4.7 × 10⁻⁶
3.1 × 10⁻⁶ (CDFPC /CDFCI = 67%)
3.3 × 10⁻⁶
3.0 × 10⁻⁶ (CDFPC /CDFCI = 65%)
3.2 × 10⁻⁶
CC, : correlation coefficient.
Fig. 24. Contribution of accident sequences to CDF under complete independent at
BWR-K.
The F-V importance analysis results are shown in Fig. 25.
Dominant components contributing to the CDF are all
RCW piping systems (A, B and C) and emergency DGs
(A, B and C).
Fig. 25. Identification results of dominant components by F-V importance analysis
at BWR-K.
5.3.2. Step 2 (subordination and complete subordination)
Based on discussions in Section 5.3.1, failure correlation was
applied between RCW piping and DGs for all lines (A, B and C). A part
of the large fault tree is illustrated in Fig. 26. All failure correlation
Fig. 26. Example of part of large fault tree at BWR-K.
96
K. Ebisawa et al. / Nuclear Engineering and Design 288 (2015) 82–97
Table 5
Evaluation results of CDF at BWR-K.
CDF of BWR-K (1/unit, yr)
Complete independence CDFCI (CC, : 0)
Large FT method
ET/FT method
1.8 × 10⁻⁶
2.0 × 10⁻⁶
CC, : correlation coefficient.
5.4. Evaluation of BWR-J and K units (case 3)
Fig. 27. Identification results of dominant components by F-V importance analysis
at BWR-K and BWR-K.
coefficients were set to be 0.5 with the same reason discussed in
Section 4.4. Other conditions were the same as those in Step 1.
Table 5 shows the evaluation results in the complete independent. The large FT approach calculated almost the same CDF as the
ET/FT approach.
5.4.1. Step 1 (complete independent)
This evaluation adopted the top 10 dominant accident
sequences for each unit, i.e. total 20 sequences, derived from
the previous complete independent evaluations. These top 10
sequences dominated over 90% of the CDF for each plant. The CDF
was 5.4 × 10⁻⁶ (1/site year).
The F-V importance analysis results are shown in Fig. 27. Dominant components contributing to CDF are all RCW piping systems
and DGs of BWR-J in addition to those of BWR-K.
5.4.2. Step 2 (subordination and complete subordination)
Based on discussions in Section 5.4.1, failure correlation was
applied between RCW piping and DGs for all lines (A, B and C).
From discussions in Section 4.4, all failure CCs for subordination
were set to be 0.3 for combinations on the different building, different floor and whose natural periods were different. A part of the
large FT in which both plant FTs were connected with an OR gate
Fig. 28. Example of part of large fault tree at BWR-K and BWR-K.
K. Ebisawa et al. / Nuclear Engineering and Design 288 (2015) 82–97
97
Table 6
Comparison of evaluation results of CDF at BWR-J and BWR-K.
CDF of BWR – J & K (1/site, year)
Complete independence CDFCI (CC,
Large FT method
= 0)
5.4 × 10⁻⁶
is illustrated in Fig. 28. Other conditions were the same as those in
Step 1.
Table 6 summarizes the comparison of the evaluation results in
the three failure correlation conditions, which gave the following
discussions.
(1) In the evaluation of failure correlation effects on CDF of multi
units, BWR-J & K, we used the top 10 sequences of each plant, i.e.
20 sequences, derived from the complete independence condition which sequences dominate over 90% of each plant’s CDF,
to facilitate the Large FT method. The total sequences used for
the CDF evaluation are about 300 for each BWR-J & K under the
complete independence condition.
(2) The total CDF of the top 10 sequences in BWR-J dominates
91% (4.1 × 10⁻⁶ /reactor year) of total CDF and so is 93%
(1.6 × 10⁻⁶ /reactor year) in BWR-K. Their relation is “BWRJ > BWR-K”.
(3) The complete independence-based CDF of BWR-J & K
(5.4 × 10⁻⁶ /site year) matches the sum of the above 91%- and
93%-CDFs for BWR-J and BWR K, respectively.
(4) The complete subordinate-based CDF of BWR-J & K
(3.9 × 10⁻⁶ /site year), which is about 72% of complete
independence-based CDF, is nearly similar to CDF shown
in the above (2) (4.1 × 10⁻⁶ /reactor year, BWR-J).
(5) Subordination-based CDF with a correlation coefficient of 0.3
BWR-J & K (4.8 × 10⁻⁶ /site year) is about 89% of complete
independence-based CDF.
6. Conclusion
This paper is summarized as follows.
(1) Authors identified that external event risk evaluation at the
multi units and sites based on lessons learned from F1-NPP
accident are one of the important issues.
(2) Authors proposed the concept and method for evaluating CDF
considering failure correlation at the multi units and sites.
(3) Based on the above method, one of authors developed the procedure for evaluating the failure correlation coefficient and
response correlation coefficient between the multi components
under the strong seismic motion.
(4) Authors has applied the above procedure and failure correlation
coefficients to two different BWR units and evaluated their CDF.
(5) Through the quantitative evaluation of effects of correlation on
CDF, in the case of complete independence, subordination and
complete subordination, authors confirmed the validity of the
method.
(6) Future plans are to expand the above method into three or more
units and to confirm the effects of failure correlation coefficients
on CDF.
Subordinate CDFPC (CC,
= 0.3)
4.8 × 10⁻⁶ (CDFPC /CDFCI = 89%)
Complete subordinate CDFCC (CC,
= 1)
3.9 × 10⁻⁶ (CDFPC /CDFCI = 72%)
Acknowledgements
The authors gratefully acknowledge for bestowing the valuable suggestions regarding the formulated correlation from Prof.
H. Kameda. The authors would like to express our appreciation to
the valuable recommendations from Mr. M. Hirano.
References
Atomic Energy Society of Japan, 2009. Seismic PSA implementation standards.
Atomic Energy Society of Japan, 2011. Tsunami PRA implementation standards.
Bohn, M.P., et al., 1983. Application of the SSMRP methodology to the seismic risk
at the Zion nuclear power plant, NUREG/CR-3428.
Ebisawa, K., et al., 2012a. Usability of tsunami PRA based on Fukushima-Daiichi NPP
accident under 2011 Tohoku tsunami. In: The 15th World Conf. on Earthquake
Engineering, Lisbon, Portugal, September 24–28.
Ebisawa, K., et al., 2012b. Concept for developing seismic-tsunami PSA methodology considering combination of seismic and tsunami events at multi-units. In:
Proceeding of the one year after 2011 great east Japan earthquake – International Symposium on Engineering Lessons Learned from the Giant Earthquake,
Tokyo.
Ebisawa, K., et al., 2012c. Current issues on PRA regarding seismic and tsunami
events at multi units and sites based on lessons learned from Tohoku earthquake/tsunami. Korean Nucl. Soc. Nucl. Eng. Technol. 44 (5).
Fleming, K.N., 1999. Technical issues in the treatment of dependence in seismic risk
analysis. In: Proceedings of the organization for the economic cooperation and
development//Nuclear energy agency workshop on seismic risk, Tokyo, Japan.
Fleming, K.N., 2005. On the issue of integrated risk – a PRA practioner’s perspective. In: ANS International Topical Meeting On Probabilistic Safety Analysis, San
Francisco, CA.
Hakata, T., 2006. Seismic PSA Method for Multiple Nuclear Plants in a Site, Reliability
Engineering and System Safety.
Hirano, M., et al., 2008. Outline of seismic PSA implementation standards on the
Atomic Energy Society of Japan. In: The 14th World Conf. on Earthquake Engineering, Beijing, China.
Japanese Government, 2011. Report of Japanese government to the IAEA ministerial
conference on nuclear safety.
Japan Nuclear Energy Safety Organization (JNES), 2014a. User’s manual of a computer code for seismic and tsunami margin analysis based on seismic & tsunami
PRA technologies, SANMARG. JNES-RE-2013-2047.
JNES, 2014b. Procedure for Evaluating Response Factors, Sub-response Factors and
Response Correlation Coefficients regarding Fragility Evaluation on Seismic PRA
and Examples of Quantitative Evaluation. JNES-RE-2013-2048.
Jung, J.E.Y.a.J.H.W.S., 2003. A new method to evaluate alternate AC power
source effects in multi-unit nuclear power plants. Reliab. Eng. Syst. Saf. 82,
165–172.
Kameda, H., 2012. Engineering agenda on earthquake-tsunami safety of nuclear
power plants raised by the 2011 Great East Japan Earthquake disaster. In:
Proceeding of the One Year After 2011 Great East Japan Earthquake – International Symposium on Engineering Lessons Learned From the Giant Earthquake,
Tokyo.
Kawamura, S., 2014. Awareness based on lessons learned from Fukushima
Daiichi NPP accident. In: JANSI Annual Conference 2014 for Step
up.
Narumiya, Y., et al., 2014. Revision of the AESJ standard for seismic probabilistic risk
assessment (1): extension and enhancement of accident. In: PSAM 12, Honolulu,
USA.
Schroer, S., 2012. An Event Classification Schema for Considering Site Risk in MultiUnit Nuclear Power Plant Probabilistic Risk Assessment.
Suzuki, K., et al., 2010. Seismic capacity tests of NPP components and equipment.
In: Seismic-Symposium 10, Session C VI-2. Niigata Institute of Technology,
Japan.