Validation of BWR spent nuclear fuel isotopic predictions with applications to burnup credit
Bạn đang xem bản rút gọn của tài liệu. Xem và tải ngay bản đầy đủ của tài liệu tại đây (8.85 MB, 15 trang )
Nuclear Engineering and Design 345 (2019) 110–124
Contents lists available at ScienceDirect
Nuclear Engineering and Design
journal homepage: www.elsevier.com/locate/nucengdes
Validation of BWR spent nuclear fuel isotopic predictions with applications
to burnup credit☆
T
⁎
I.C. Gauld , U. Mertyurek
Oak Ridge National Laboratory, P.O. Box 2008, Oak Ridge, TN 37834, USA
A R T I C LE I N FO
A B S T R A C T
Keywords:
Boiling water reactor
Radiochemical assay data
Isotopic validation
Burnup credit
Validating boiling water reactor (BWR) spent nuclear fuel inventory calculations is challenging due to the
complexity of BWR assembly designs, the lack of publicly available radiochemical assay measurements, and
limited access to documentation on fuel design and operating conditions. This study compiled and evaluated
experimental data on measured nuclide concentrations in commercial spent fuel for 77 fuel samples that cover a
wide range of modern assembly designs and operating conditions. These data were used to validate predictions
of the isotopic content using the SCALE Polaris lattice physics depletion code. The isotopic bias and uncertainties
derived from comparisons of calculated and measured nuclide concentrations are applied to estimate the
combined effect on the effective neutron multiplication factor for a representative burnup credit spent nuclear
fuel storage system. The experimental data, validation results, model uncertainties, and uncertainty analysis
results for a cask burnup credit application system are described.
1. Introduction
Quantifying bias and uncertainty in the calculated nuclide compositions of spent nuclear fuel is essential for validating the codes and
nuclear data used for many safety and licensing calculations. This is
most often accomplished by comparing calculated spent fuel nuclide
contents directly with measurements obtained by nondestructive or
destructive radiochemical assay (RCA) of spent fuel samples that are
representative of the application model. Isotopic measurement data
have been widely used internationally by industry and research institutes to validate depletion capabilities, and they are used extensively
by Oak Ridge National Laboratory (ORNL) to validate the SCALE code
system (Rearden and Jessee, 2017).
Previous SCALE validation studies using RCA data have focused
mainly on pressurized water reactor (PWR) spent fuel. More than 120
fuel samples from PWR spent fuel have been analyzed by ORNL in
support of PWR burnup credit and other safety activities (Radulescu
et al., 2014; Ilas et al., 2012). However, analysis of boiling water reactor (BWR) spent fuel (Hermann and DeHart, 1998; Wimmer, 2004;
Mertyurek et al., 2010), has been more limited due to a lack of measurements of BWR spent fuel compositions for modern assembly designs
with well-documented operating information. The restricted availability of public sources of BWR spent fuel assay data for modern assembly designs and enrichments is due in part to the commercial proprietary nature of the newer assembly designs, enrichment
configurations, and operating conditions in the reactor. Publicly
available spent fuel measurements previously considered for BWR isotopic validation in the United States have included early 6 × 6 (Barbero
et al., 1979) and 7 × 7 (Guenther et al., 1991) BWR assemblies with
relatively low enrichments and designs that lacked the heterogeneity of
modern BWR assemblies. Moreover, the coolant axial void conditions
for these older assemblies were not reported. Measurements of an 8 × 8
BWR assembly from the Fukushima Daini-2 reactor were reported by
the Japan Atomic Energy Agency (JAEA) with coolant void information
included (Nakahara et al., 2000); these data were also used in the
earlier isotopic validation studies. Measurements for newer BWR designs are largely available only through proprietary experimental programs.
Over the past decade there has been increased international recognition of the need for expanded, high quality, public sources of
experimental data to validate spent fuel calculations. In 2006, the
Nuclear Science Committee of the Organisation for Economic
☆
This manuscript has been authored by UT-Battelle, LLC, under contract DE-AC05-00OR22725 with the US Department of Energy (DOE). The US government
retains and the publisher, by accepting the article for publication, acknowledges that the US government retains a nonexclusive, paid-up, irrevocable, worldwide
license to publish or reproduce the published form of this manuscript, or allow others to do so, for US government purposes. DOE will provide public access to these
results of federally sponsored research in accordance with the DOE Public Access Plan ( />⁎
Corresponding author. Tel.: +1-865-574-5257.
E-mail address: (I.C. Gauld).
/>Received 12 November 2018; Received in revised form 24 January 2019; Accepted 25 January 2019
Available online 20 February 2019
0029-5493/ © 2019 The Authors. Published by Elsevier B.V. This is an open access article under the CC BY license
( />
Nuclear Engineering and Design 345 (2019) 110–124
I.C. Gauld and U. Mertyurek
Cooperation and Development/Nuclear Energy Agency (OECD/NEA)
established an Expert Group on Assay Data of Spent Nuclear Fuel
(EGADSNF) to compile, document, and evaluate a comprehensive set of
publicly available RCA data (OECD/NEA, 2019) and to make these data
available through the OECD/NEA web-based Spent Fuel Isotopic
Composition Database (SFCOMPO). This database is managed as an
activity under the OECD/NEA Working Party on Nuclear Criticality
Safety (WPNCS). The updated database, SFCOMPO 2.0 (Michel-Sendis
et al., 2017), was released publicly in 2017, with contributions from
many NEA member countries. The database is intended to support engineering and safety analyses for nuclear fuel cycle applications and
back-end nuclear facilities related to fuel handling, dry spent fuel storage installations, pool storage, fuel reprocessing facilities, and waste
repositories. New BWR measurements are included in SFCOMPO from
recent publications, and extensive contributions from the Japan Nuclear Regulation Authority (NRA) are also included.
This paper describes a validation study of BWR isotopic predictions
using the expanded experimental database of destructive RCA measurements and calculations performed with the Polaris lattice physics
code (Jessee et al., 2014) in SCALE 6.2.2 (Rearden and Jessee, 2017)
using Evaluated Nuclear Data File/B Version VII.1 (ENDF/B-VII.1)
nuclear cross section and decay data (Chadwick et al., 2011).
The concept of taking credit for the reduction in reactivity due to
fuel burnup is commonly referred to as burnup credit. The reduction in
reactivity that occurs with burnup is due to the change in concentration
(net reduction) of fissile nuclides and the production of actinide and
fission-product neutron absorbers. Interim Staff Guidance 8 (Interim
Staff Guidance, 2012) on the implementation of burnup credit for storage and transportation systems (ISG-8 rev. 3) issued in 2012 by the US
Nuclear Regulatory Commission (NRC) applies only to PWR fuel assemblies.
The studies described in the present work are motivated by the
desire to develop an improved technical basis for BWR spent fuel criticality safety analyses using burnup credit. The range of application
applies to BWR fuel burnup beyond the region of peak reactivity that is
associated with the use (depletion) of fuel containing gadolinium oxide
(Gd2O3) or other integral neutron absorbers that are widely used in
modern BWR assembly designs.
In addition to the public BWR data in the SFCOMPO database, this
work applies measurements for a modern General Electric (GE) GE14
10 × 10 fuel assembly made under a proprietary experimental program
coordinated by the Spanish fuel manufacturer ENUSA Industrias
Avanzadas, S.A. and the Spanish Nuclear Safety Council, Consejo de
Seguridad Nuclear (CSN) (Conde et al., 2006). Data were also obtained
for a SVEA-96 10 × 10 assembly from the proprietary MOX and UOX
LWR Fuels Irradiated to High Burnup (MALIBU) experimental program
coordinated by the Belgian Nuclear Research Center (SCK·CEN)
(Boulanger et al., 2004). Additional data for a GE11 9 × 9 assembly
design were obtained from measurements made under the US Department of Energy Office of Civilian Radioactive Waste Management
(OCRWM) Yucca Mountain project (Radulescu, 2003). These data
provide an improved experimental basis for the evaluation of BWR
isotopic uncertainties by including modern heterogeneous assembly
designs, expanded isotopic measurements, and more complete reactor
operating history information. At this writing, some of these data are
commercially protected but may be made available in the future
through nondisclosure agreements to support licensing activities.
In this study, an application of BWR isotopic uncertainty analysis
was applied to a nuclear criticality safety burnup credit model. The
uncertainty in keff due to biases and uncertainties in calculated nuclide
concentrations is presented. Criticality calculations were performed
using the KENO V.a Monte Carlo neutron transport code and the 252energy group ENDF/B-VII.1 cross section library available in SCALE
6.2.2. Credit for fuel burnup was considered for the major actinides in
spent fuel (Parks et al., 2000) with and without the addition of minor
actinides and principal fission products (Table 1).
Table 1
Actinides and fission products considered in the burnup credit criticality analyses.
U†
Pu†
101
Ru
149
Sm
234
240
†
U†
Pu†
103
Rh
150
Sm
235
241
U†
Am†
133
Cs
152
Sm
236
238
242
241
U
Pu†
109
Ag
151
Sm
Pu†
Mo
145
Nd
153
Eu
237
238
243
95
Np
Am
143
Nd
151
Eu
Pu†
Tc
147
Sm
155
Gd
239
99
Major actinides.
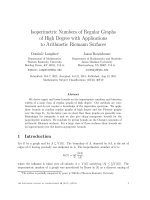
Fig. 1. Polaris lattice physics calculation flow (Williams and Kim, 2012).
2. Code and modelling descriptions
2.1. Lattice physics and depletion analyses
Polaris is a new module introduced in SCALE 6.2 that provides twodimensional (2D) multigroup (MG) neutron transport lattice physics
with pin-by-pin depletion capability for production calculations of light
water reactor (LWR) fuel assembly designs. A detailed description of
the methods and calculational approach of Polaris is provided by Jessee
et al. (2014). The calculational flow of the Polaris code is shown in
Fig. 1.
Polaris was developed as an efficient transport and depletion code
specifically for LWR analyses to supplement the general-purpose
TRITON depletion capability (DeHart and Bowman, 2011) in SCALE,
which uses one-dimensional (1D, XSDRN), 2D (NEWT), or three-dimensional (3D) Monte Carlo (KENO) neutron transport solutions. For
the neutron transport calculation, Polaris employs the method of
characteristics (MOC), which solves the characteristic transport equation over a set of equally spaced particle tracks across the lattice geometry. Polaris also provides an easy-to-use input format allowing users
to set up lattice models with a minimal amount of input as compared to
TRITON input requirements.
An efficient embedded self-shielding method (ESSM) is used in
Polaris for resonance self-shielding of all fuel rods in an assembly
(Williams and Kim, 2012). ESSM is similar to the subgroup method, in
which the effects of neighboring fuel pins, guide tubes, water rods, and
assembly structures are accounted for in the self-shielding calculations.
ESSM neglects resonance interference between resonance-absorbing
nuclides in the same material. Although Bondarenko iteration option is
111
Nuclear Engineering and Design 345 (2019) 110–124
I.C. Gauld and U. Mertyurek
Table 2
Summary of BWR spent fuel samples.
Reactor and Unit
Country
Assembly Design
Number of Samples
Enrichments (wt %
Dodewaard
Forsmark 3
Forsmark 3a
Fukushima Daini 1
Fukushima Daini 2
Fukushima Daini 2
Leibstadt 3b
Limerick 1c
Belgium
Sweden
Sweden
Japan
Japan
Japan
Switzerland
United States
6×6
10 × 10 (SVEA-96)
10 × 10 (GE14)
9×9 – 9
8×8 – 4
8×8 – 2
10 × 10 (SVEA-96)
9 × 9 (GE11)
1
1
8
13
25
18
3
8
4.94
3.97
3.95
2.1, 4.9, 3.0 (Gd)
3.4, 4.5, 3.4 (Gd)
3.9, 3.4 (Gd)
3.9
3.95, 3.6 (Gd)
a
b
c
235
U)
Burnup (GWd/MTU)
55
61
38–50
35–68
9–59
7–44
56–63
37–65
Spanish Nuclear Safety Council (CSN), proprietary data.
MALIBU International Program, proprietary data.
US DOE Yucca Mountain Project, proprietary data.
KENO V.a criticality calculations of the application model were
performed using the 252-group ENDF/B-VII.1 neutron transport cross
section library in SCALE in order to evaluate differences in isotope
concentrations accurately.
available to treat resonance interference in Polaris, its effect is minimal
for UO2 depletion calculations. Cross section self-shielding is performed
automatically to account for changes in the coolant void fraction and
other operating conditions during the depletion analysis. In previous
depletion studies of BWR fuel that were performed using TRITON,
Dancoff factors used for resonance cross section corrections for nonuniform lattices had to be calculated externally, usually with the
MCDANCOFF code in SCALE or an equivalent code, and then applied
manually as input to the model (Mertyurek et al., 2010). When the
Dancoff factors changed during irradiation due to variations in the
moderator void and burnup, updating the factors required halting the
calculation, saving the intermediate nuclide concentrations, entering
new Dancoff factors, and restarting the case. This procedure is performed internally in Polaris.
Polaris is coupled to the ORIGEN code (Gauld et al., 2011) to solve
the time-dependent transmutation equations and calculate nuclide
concentrations, activities, and radiation source terms for the many
isotopes simultaneously generated or depleted by neutron transmutation, fission, and radioactive decay.
Polaris has been validated for reactor physics lattice calculations.
Comparisons of Polaris and TRITON/CE KENO results show acceptable
accuracy for lattice physics calculations with less than 200 pcm difference in kinf (Mertyurek et al., 2018). The present study represents the
first application of Polaris for extensive BWR isotopic validation.
3. Experimental assay data
Measured BWR nuclide compositions were obtained from destructive RCA experiments of spent fuel rods from assemblies irradiated in
eight different reactors operated in five countries. These assemblies
include 6 × 6, 8 × 8, 9 × 9, and 10 × 10 lattice designs.
Many datasets were available from SFCOMPO 2.0 (Michel-Sendis
et al., 2017). All primary experimental reports on each dataset are
maintained and made available as part of the database.
Measurements from the Dodewaard, Forsmark 3, Fukushima Daini
1, and Fukushima Daini 2 reactors were used in this study since they
include relatively complete design and operating history data. More
than 80% of the samples analyzed were from Fukushima Daini Units 1
and 2 operated in Japan. Several experimental datasets analyzed in
previous studies (Hermann and DeHart, 1998; Wimmer, 2004) were not
used in the current study due to insufficient documentation on the reactors’ operating conditions, most notably the availability of axial void
fractions for the samples. Previous studies used semi empirical correlations of assembly power and core coolant inlet temperature to estimate the missing local void fraction data for measured assemblies. In
this study, only experimental datasets with reported axial void fractions
were considered.
Additional data used in this study were obtained from commercial
proprietary programs that measured fuel samples from the Forsmark 3,
Leibstadt 3, and Limerick 1 reactors. Descriptive data included in this
paper are therefore limited to information available from public
sources. Additional information required for modeling and simulation
of these fuel assemblies is only available through nondisclosure
agreements.
The measured data used herein are summarized in Table 2. A total
of 77 samples were analyzed. Measurements of all the major actinide
isotopes (Table 1) are available for most samples. Minor actinide and
fission product measurements are available for many of the samples.
A brief description of each experimental dataset used in the present
study is provided in the following sections. More detailed information is
available in the primary experimental reports cited in this paper.
2.2. Nuclear data libraries
Neutron transport calculations in Polaris were performed using the
56-group ENDF/B-VII.1 cross section library for all results presented in
this report. Fifty-six group cross section library is a subset of 252-group
library and is optimized for fast lattice physics calculations with less
than 150 pcm bias in kinf for UO2 fuel.
Following each transport calculation performed by Polaris, cross
sections are collapsed in energy using the neutron spectrum in each fuel
rod and applied directly to the ORIGEN calculation to determine reaction rates and the nuclide transmutation inventories. ENDF/B-VII.1
(Chadwick et al., 2011) provides cross sections for 388 individual isotopes. Cross sections for 386 isotopes not available in ENDF/B-VII.1 are
taken from a special-purpose MG activation library based on JEFF-3.1/
A (Sublet et al., 2003) and are collapsed using the same procedures.
Due to their negligible self-shielding and impact on transport calculations, cross sections obtained from the JEFF-3.1/A library are not
processed through the ESSM module and are applied as unshielded
(infinitely dilute) cross sections.
All decay data used by ORIGEN are adopted from ENDF/B-VII.1.
Independent fission product yields are developed from England and
Rider (1994), as included in ENDF/B-VII.0. The independent fission
yields used by ORIGEN have been adjusted to account for changes in
the decay data to provide greater consistency with the cumulative fission yields in the England and Rider evaluation (Pigni et al., 2015).
3.1. Dodewaard (6 × 6)
Dodewaard was a BWR nuclear power plant that operated in the
Netherlands until 1997. Destructive RCA measurements were performed on fuel samples as part of the Actinide Research in a Nuclear
Element (ARIANE) international project (Primm, 2002). Experimental
data from ARIANE were released publicly to the OECD/NEA, and the
measurement data and experimental reports are available through the
112
Nuclear Engineering and Design 345 (2019) 110–124
I.C. Gauld and U. Mertyurek
dependent operating data were applied in the Polaris model. An effective fuel temperature was calculated from the fuel center and surface
temperatures using Rowlands’s formulation (Rowlands, 1964). The
sample burnup was determined by matching the 148Nd concentration
predicted by Polaris with the measurement data, which were estimated
by the laboratories to have an accuracy of better than 1% (95% confidence).
3.2. Forsmark 3 SVEA-100 (10 × 10)
Measurements of fuel samples from SVEA-100 10 × 10 fuel assembly 14595, irradiated in the Forsmark Unit 3 reactor located in
Sweden, were performed at the Studsvik Nuclear Laboratory. Sample
F3F6 from the central part of the UO2 rod located at position F6 of
assembly 14,595 was dissolved at Studsvik and measurements performed in 2003 and 2006. Aliquots of the fuel solution were also
shipped to two other laboratories in 1996, Harwell in the United
Kingdom and Dimitrovgrad in Russia, for independent radiochemical
determination of the isotopic composition and burnup analysis. These
measurements and the experimental report were published in 2008 by
Zwicky (2008) and are available through the SFCOMPO database, and
computational analyses of this sample were reported by Hannstein and
Sommer (2017).
Sample F3F6 was obtained at an axial position 2004 mm from the
bottom of the fuel rod and experienced an average void fraction of 58%.
The fuel sample characteristics are listed in Table 4. The measurements
performed at Studsvik in 2006 were used in this study. The sample
burnup was estimated by Studsvik based on the measurements using
weighted burnup values based on measurements of neodymium, 235U,
and 239Pu isotopes.
The layout of the Forsmark-3 assembly 14,595 is shown in Fig. 3,
with the location of the measured rod F6 at the inner corner of the
assembly subchannel and the subchannel structure (water cross) shown.
The assembly used 10 different fuel rod enrichments, and five rods had
a Gd2O3 content of 3.15 wt%. Detailed time-dependent void fractions,
fuel temperature, and specific power for the measured sample are
provided in the report by Zwicky (2008).
Fig. 2. Polaris model of Dodewaard 6 × 6 assembly.
SFCOMPO database.
The Dodewaard UO2 sample, DU1, had an initial 235U enrichment of
4.94% and was irradiated for five cycles to ∼55 GWd/MTU in fuel
assembly Y013. The assembly was an early BWR 6 × 6 lattice design
containing one water rod and five gadolinium oxide (Gd2O3) rods. The
assembly layout is shown in the Polaris model in Fig. 2. The basic fuel
sample characteristics are listed in Table 3.
The other fuel rods in the assembly were standard, full-length UO2
rods with variable enrichments (3.2, 2.6, and 1.8 wt%) except for two
experimental rods located in positions D5 and E4 (see Fig. 2) that
contained mixed oxide (MOX) with 6.43 wt% plutonium content. The
MOX rods were positioned away from the measured sample. Two gadolinium rods with 2.7 wt% Gd2O3 content in fuel and 3.2% enriched in
235
U were adjacent to the measured rod.
Assembly Y013 is not highly representative of modern designs, and
it contained a segmented test rod from which sample DU1 was obtained. However, detailed design and operating history information was
available from the operator at the sample axial location, and extensive
nuclide measurements were reported. Applicability of the DU1 sample
for validation has been independently evaluated (Ortego and
Rodríguez, 2013), and it was concluded that these data are suitable for
validating isotopic depletion codes.
Independent measurements of the DU1 sample were performed at
laboratories of the Belgian Nuclear Research Center, Studiecentrum
voor Kernenergie (SCK·CEN), in 1996, and at the Paul Scherrer Institute
(PSI) in Switzerland in 1999 (Primm, 2002). Measurement data are
available for all 28 burnup credit isotopes listed in Table 1. In the
current study, calculated nuclide concentrations were compared to both
sets of measurements to provide an estimate of the impact of measurement uncertainties.
Detailed core follow data for the measured sample are included in
the ARIANE report. Time-dependent void fraction, burnup, center, and
surface fuel temperatures are provided for all five cycles. These time-
3.3. Forsmark 3 GE14 (10 × 10)
Under a proprietary Spanish experimental program (Conde et al.,
2006) coordinated by the Spanish fuel vendor ENUSA, isotopic measurements were made on a modern GE14 10 × 10 assembly from the
Forsmark Unit 3 reactor operated in Sweden. Fuel samples from rod J8
from assembly GN592 were measured at Studsvik Nuclear Laboratory
(Zwicky et al., 2010). A total of eight fuel samples from the fuel rod
were measured over the rod’s length to provide data for burnup and
void variations. Two pairs of samples—samples 1 and 2, and samples 3
and 7—from adjacent axial positions of the rod, were selected to verify
measurement repeatability and uncertainty. The measurements provided isotopic data at six unique axial positions and included more than
60 isotopes; this isotope set includes most of the burnup credit isotopes
listed in Table 1.
All samples from rod J8 were from the enriched zone of the rod with
an initial enrichment of 3.95 wt% 235U. The fuel rod attained an estimated rod average burnup of 41 GWd/MTU and a peak burnup of ∼56
GWd/MTU.
Table 5 summarizes sample identification names, the elevation of
each sample, and the void at the sample locations from the reactor
Table 3
Summary of Dodewaard 6 × 6 assembly fuel sample measurements.
Assembly ID
Rod ID
Sample ID
Fuel type
Axial height (mm)
Avg. Void (%)
Enrichment (wt %
Y013
B2
DU1
UO2
1111
50
4.941
113
235
U)
Gd content (wt % Gd2O3)
Burnup (GWd/MTU)
0
55.5
Nuclear Engineering and Design 345 (2019) 110–124
I.C. Gauld and U. Mertyurek
Table 4
Summary of Forsmark Unit 3 SVEA-100 10 × 10 assembly fuel sample measurements.
Assembly ID
Rod ID
Sample ID
Fuel type
Axial height (mm)
Avg. Void (%)
Enrichment (wt %
14595
F6
F3F6
UO2
2004
58
3.97
235
U)
Gd content (wt % Gd2O3)
Burnup (GWd/MTU)
0
55.8
Fig. 3. Polaris model of Forsmark Unit 3 SVEA-100 assembly.
Fig. 4. Polaris model of Forsmark Unit 3 GE14 10 × 10 assembly.
operating history data. Sample elevations were measured from the
lower end plug of the fuel rod. The distance from the lower end plug to
the start of the active fuel region is ∼40 mm.
The layout of GE14 assembly GN592 is shown in Fig. 4. This assembly has 92 fuel rods, including 12 part-length rods; nine of the rods
contain Gd2O3 in fuel. Seven different uranium enrichments are used in
the assembly.
Detailed, time-dependent reactor operating data, including void
fraction, fuel temperature, and power for the measured samples, are
documented in reference reports prepared by Vattenfall in Sweden
(Lindström, 2011).
irradiation. This assembly design is similar to the ATRIUM-9 design.
Measurements for isotopes of uranium, plutonium, and neodymium
were reported by Yamamoto and Kanayama (2008), Yamamoto (2012)
for eight samples selected from five different fuel rods of the two assemblies. Another five samples from the same rods were later reported
on by Suzuki et al. (2013), including measurements of additional fission
products. The supplementary design and operating information necessary to model the 9 × 9 – 9 assemblies were provided by Yamamoto
(2014) through the OECD/NEA-coordinated activity on spent fuel assay
data. These data and reports are currently available through the
SFCOMPO database. The supplemental data included the fuel rod enrichment layout, time-dependent void fractions, and accumulated
burnup for the assemblies at the axial locations (nodes) of all measured
samples.
The configuration of assemblies 2F1ZN2 and 2F1ZN3 is shown in
Fig. 5; the measured rod locations C2, C3, and A9 are highlighted. The
assemblies used five different 235U enrichments and contain 12 Gd2O3
fuel rods, as indicated by the different colored rods in the figure. The
measurements include both UO2 and UO2-Gd2O3 type fuel rods, with
initial enrichments of 2.1, 3.0, and 4.9 wt% 235U. The C2 fuel rods (see
Fig. 5) contained Gd2O3 with a content of 5 wt% in the fuel. The sample
3.4. Fukushima Daini 1 (9 × 9 – 9)
As part of a validation study of burnup calculations of BWR cores
conducted by Japan’s NRA (formerly the Japan Nuclear Energy Safety
[JNES] organization), physics and depletion analyses were performed
using post-irradiation measurements of burnup and isotopic inventories
of eight samples taken from two 9 × 9 – 9 BWR lead test fuel assemblies
irradiated in the Fukushima Daini Unit 1 reactor (2F1). Assemblies
2F1ZN2 and 2F1ZN3 were discharged after three and five cycles of
Table 5
Summary of Forsmark Unit 3 GE14 10 × 10 assembly fuel sample measurements.
Assembly ID
Rod ID
Sample ID
Fuel type
Axial height (mm)
Avg. Void (%)
Enrichment (wt %
GN592
J8
ENUSA-1
ENUSA-2
ENUSA-3
ENUSA-4
ENUSA-5
ENUSA-6
ENUSA-7
ENUSA-8
UO2
UO2
UO2
UO2
UO2
UO2
UO2
UO2
1847
1858
718
2508
3282
403
707
3389
51
51
13
61
67
2.2
13
67
3.95
3.95
3.95
3.95
3.95
3.95
3.95
3.95
114
235
U)
Gd content (wt % Gd2O3)
Burnup (GWd/MTU)
0
0
0
0
0
0
0
0
50.4
50.7
49.0
51.1
43.6
43.5
49.0
38.3
Nuclear Engineering and Design 345 (2019) 110–124
I.C. Gauld and U. Mertyurek
% 235U and contained 4.5 wt% Gd2O3, whereas the upper section was
enriched to 3.40 wt% 235U and contained 3.0 wt% Gd2O3.
Measurements were reported for 18 different samples obtained from
different axial positions of the two rods. Three samples were selected
from the natural uranium blanket regions near the ends of rods. The
sample characteristics are provided in Table 7. The sample axial locations in the fuel rods were measured from the bottom of the active fuel
length. The burnup values were estimated from the measured 148Nd
content in the fuel samples. Measurements were performed at the JAEA
laboratories.
The configuration of assembly 2F2DN23 is shown in Fig. 6. The
8 × 8 – 2 assembly is similar to the GE7 design. Time-dependent void
data were not available for this assembly. The average void fractions
are those provided by TEPCO and are standard values as written in the
Application for Permission for the Installation of a Nuclear Reactor
(Nakahara et al., 2002). The impact of using average void data compared to detailed void data is assessed in Section 5.3 of this paper.
3.6. Fukushima Daini 2 GE9 (8 × 8 – 4)
Isotopic measurements of four BWR 8 × 8 – 4 lead test assemblies,
irradiated in Unit 2 of the Fukushima Daini Power Station 2 (2F2), were
report by the Japan NRA (Yamamoto, 2012; Yamamoto and Yamamoto,
2008). The assemblies, identified as 2F2D1, 2F2D2, 2F2D3, and 2F2D8,
were discharged after one, two, three, and five cycles of irradiation,
respectively, providing a wide range of sample burnups. The measurements, design data, and reference reports are included in the
SFCOMPO database.
The configuration of the assembly is shown in Fig. 7. All assemblies
have the same layout and enrichment zoning and used five different
235
U enrichments and eight UO2-Gd2O3 rods with Gd2O3 contents of 3.0
and 4.5 wt% in the fuel. Measurements for each assembly include both
UO2 and UO2-Gd2O3 type fuel rods. The sample characteristics are
given in Table 8.
Time-dependent void distributions for the 8 × 8 – 4 assemblies were
not reported. However, the node average values of the channel void
fractions of the assemblies were available from the plant operator for all
axial nodes that included the measured fuel samples (Yamamoto and
Yamamoto, 2008).
Measurements were made at the laboratories of the Nippon Nuclear
Fuel Development (NFD) Company, including data for isotopes of U, Pu,
148
Nd, 241Am, and Cm. The sample burnups were estimated by the laboratory based on the 148Nd method with the inventory data of uranium, plutonium. The burnup values used in this study used the
measured 148Nd content in each sample.
Fig. 5. Polaris model of the Fukushima Daini-1 9 × 9 – 9 assemblies.
burnup was estimated using the measured 148Nd concentration. A
summary of the measured sample characteristics is given in Table 6.
The axial elevations of each sample are relative to the bottom of the
active region of the fuel rod.
3.5. Fukushima Daini 2 (8 × 8 – 2)
Under a burnup credit research project at the Japan Atomic Energy
Research Institute (JAERI), supported by the Science and Technology
Agency of Japan in cooperation with the utilities, experiments were
performed on spent fuel assemblies to obtain criticality data for burnup
credit. Under this program, destructive and nondestructive measurements were made to determine the nuclide compositions of the fuel
(Nakahara et al., 2000). Analyses of these data have been reported by
Nakahara et al. (2002) and Yamamoto and Yamamoto (2008). The
measurements and the reference reports are compiled as part of the
SFCOMPO database.
Measurements are reported for two fuel rods from lattice positions
B2 and C2 of an 8 × 8 – 2 assembly identified as 2F2DN23. This assembly was irradiated for three cycles in Unit 2 of the Fukushima Daini
Power Station 2 (2F2) reactor, which is operated by Tokyo Electric
Power Company (TEPCO). Rod C2 was a UO2-Gd2O3 rod with two axial
enrichment zones. The lower 2937 mm section was enriched to 3.40 wt
3.7. Leibstadt SVEA-96 (10 × 10)
Measurements from the MALIBU international experimental
Table 6
Summary of Fukushima Daini-1 9 × 9 – 9 assembly fuel sample measurements.
Assembly ID
Rod ID
Sample ID
Fuel type
Axial height (mm)
Avg. Void (%)
Enrichment (wt %
2F1ZN2
C2
GDB
GDT
UB
UT
UO2-Gd2O3
UO2-Gd2O3
UO2
UO2
757
2922
788
2922
18
74
18
74
UB
UM
UT
GDB
GDM
GDT
UB
UM
UT
UO2
UO2
UO2
UO2-Gd2O3
UO2-Gd2O3
UO2-Gd2O3
UO2
UO2
UO2
788
1654
2844
804
1654
2875
788
1639
2844
18
38
60
18
38
60
11
38
60
C3
2F1ZN3
A9
C2
C3
115
235
U)
Gd content (wt % Gd2O3)
Burnup (GWd/MTU)
3.0
3.0
4.9
4.9
5.0
5.0
0
0
35.6
29.0
46.5
38.9
2.1
2.1
2.1
3.0
3.0
3.0
4.9
4.9
4.9
0
0
0
5.0
5.0
5.0
0
0
0
61.2
68.0
55.7
55.6
57.7
46.8
68.3
68.4
58.0
Nuclear Engineering and Design 345 (2019) 110–124
I.C. Gauld and U. Mertyurek
Table 7
Summary of Fukushima Daini-1 8 × 8 – 2 assembly fuel sample measurements.
Assembly ID
Rod ID
Sample ID
Fuel type
Axial height (mm)a
Avg. Void (%)
Enrichment (wt %
2F2DN23
B2
SF98-1
SF98-2
SF98-3
SF98-4
SF98-5
SF98-6
SF98-7
SF98-8
SF99-1
SF99-2
SF99-3
SF99-4
SF99-5
SF99-6
SF99-7
SF99-8
SF99-9
SF99-10
UO2
UO2
UO2
UO2
UO2
UO2
UO2
UO2
UO2
UO2-Gd2O3
UO2-Gd2O3
UO2-Gd2O3
UO2-Gd2O3
UO2-Gd2O3
UO2-Gd2O3
UO2-Gd2O3
UO2-Gd2O3
UO2
39
167
423
692
1214
2050
2757
3397
134
286
502
686
1189
2061
2744
3388
3540
3676
0
0
3
11
32
54.5
68
73
0
1.4
5.8
10.8
27.7
54.7
66.5
71.7
72.9
74.3
0.71
3.91
3.91
3.91
3.91
3.91
3.91
3.91
0.71
3.40
3.40
3.40
3.40
3.40
3.40
3.40
3.40
0.71
C2
a
235
U)
Gd content (wt % Gd2O3)
Burnup (GWd/MTU)
0
0
0
0
0
0
0
0
0
4.5
4.5
4.5
4.5
4.5
4.5
3.0
3.0
0
4.2
26.5
36.9
42.4
44.0
39.9
39.4
27.2
7.5
22.6
32.4
35.4
37.4
32.4
32.1
21.8
16.7
7.2
Measured from the bottom of the active fuel length.
Fig. 6. Polaris model of the Fukushima Daini-2 8 × 8 – 2 assemblies.
Fig. 7. Polaris model of the Fukushima Daini-2 8 × 8 – 4 assemblies.
program (Boulanger et al., 2004) were analyzed in this study. MALIBU
is a commercial proprietary program managed by SCK·CEN. Independent measurements were performed at several radiochemical laboratories to serve as a measurement cross check and to assess and
reduce uncertainties. Isotopic measurements were made on BWR fuel
samples from a SVEA-96 Optima 10 × 10 assembly from the Kernkraftwerk Leibstadt reactor in Switzerland (MALIBU Program, 2015).
Three samples were taken at different axial positions of rod H6 of assembly AIA003 to assess different void conditions. All samples had an
initial enrichment of 3.90 wt% 235U. Characteristics of the measured
samples are given in Table 9.
The burnup values for samples KLU1 and KLU3 were determined
using the 148Nd concentration; this burnup was in good agreement with
burnup estimates based on other neodymium isotopes and 137Cs. The
KLU2 sample used 145+146Nd and 137Cs measurements to estimate the
sample burnup, which was about 8% different from the burnup obtained using 148Nd.
The assembly layout is shown in Fig. 8 for the configuration of the
dominant lattice (below the level of the part length rods). Detailed
operating data, including time-dependent specific power, void conditions, and fuel temperatures, were provided by the Vattenfall Nuclear
Fuel and Kernkraftwerk Leibstadt (MALIBU Program, 2010).
All samples were measured at Studsvik Nuclear Laboratory in
Sweden during 2010. The sample at the lowest elevation, KLU1, was
selected as a cross check sample and was also analyzed at the laboratories of SCK·CEN in Belgium and the PSI in Switzerland. Radiochemical
analysis techniques were used to analyze more than 50 actinides and
fission products.
3.8. Limerick 1 GE11 (9 × 9)
Measurements of a spent fuel assembly from the Limerick Unit 1
reactor were measured in laboratories at GE Vallecitos Nuclear Center.
These measurements have been analyzed in previous validation studies
performed under the Yucca Mountain Project (YMP) in 2004 under the
Office of Civilian Radioactive Waste Management (Radulescu, 2003).
116
Nuclear Engineering and Design 345 (2019) 110–124
I.C. Gauld and U. Mertyurek
Table 8
Summary of Fukushima Daini-2 8 × 8 – 4 assembly fuel sample measurements.
Assembly ID
Rod ID
Sample ID
Fuel type
Axial height (mm)a
Avg. Void (%)
Enrichment (wt %
2F2D1
F6
TU101
TU102
TU103
TU104
TU105
TU106
UO2
UO2
UO2-Gd2O3
UO2-Gd2O3
UO2-Gd2O3
UO2
3378
642
3343
2743
740
2689
64.0
12.9
64.0
60.2
17.3
59.8
TU201
TU202
TU203
TU204
TU205
UO2
UO2
UO2-Gd2O3
UO2-Gd2O3
UO2-Gd2O3
3178
478
3178
2592
578
TU301
TU302
TU304
TU306
TU308
TU309
TU311
UO2
UO2
UO2
UO2
UO2-Gd2O3
UO2-Gd2O3
UO2-Gd2O3
TU501
TU502
TU503
TU505
TU506
TU510
TU511
UO2
UO2
UO2
UO2
UO2
UO2-Gd2O3
UO2-Gd2O3
B3
F6
2F2D2
F6
B3
2F2D3
H5
A4
B3
2F2D8
H5
A4
B3
a
235
U)
Gd content (wt % Gd2O3)
Burnup (GWd/MTU)
4.5
4.5
3.4
3.4
3.4
4.5
0
0
4.5
4.5
4.5
0
14.0
18.2
10.0
9.4
12.3
16.1
63.1
7.0
63.1
58.5
10.4
4.5
4.5
3.4
3.4
3.4
0
0
4.5
4.5
4.5
29.1
32.9
24.5
23.5
22.8
2793
423
2856
447
3242
2780
543
60.6
5.2
61.0
6.0
63.5
60.5
9.1
3.4
3.4
3.4
3.4
3.4
3.4
3.4
0
0
0
0
4.5
4.5
4.5
34.6
31.4
37.8
32.3
30.2
34.8
33.5
3202
2453
803
2229
850
2952
670
63.2
58.0
20.6
54.9
23.0
62.2
14.0
3.4
3.4
3.4
3.4
3.4
3.4
3.4
0
0
0
0
0
4.5
4.5
53.2
58.9
55.6
59.1
57.5
53.1
48.1
Gd content (wt % Gd2O3)
Burnup (GWd/MTU)
0
0
0
60.5
65.0
58.4
Measured from the bottom of the active fuel length.
Table 9
Summary of Leibstadt SVEA-96 10 × 10 assembly fuel sample measurements.
Assembly ID
Rod ID
Sample ID
Fuel type
Axial height (mm)a
Avg. Void (%)
Enrichment (wt %
AIA003
H6
KLU1
KLU2
KLU3
UO2
UO2
UO2
588
1922
3302
8.4
51
70
3.90
3.90
3.90
a
235
U)
Measured from the bottom of the active fuel length.
Measurements were performed for eight samples selected from a highburnup assembly YJ1433 (Reager, 2003). The reported measurement
data include nuclide concentrations for 32 actinides and fission products. The measured nuclides include isotopes of U, Pu, Nd, Gd, Sm, Eu,
Am, Cm, Np, and Cs.
Assembly YJ1433 is a GE11 9 × 9 design with two large water rods.
There are five different 235U enrichments for the UO2 rods, eight partlength rods, and nine rods containing Gd2O3 at 5 wt% in the fuel. The
assembly configuration is shown in Fig. 9. The assembly was irradiated
for three cycles.
Three different fuel rods were measured, including a full length UO2
rod from lattice location D9, a UO2-Gd2O3 rod from location D8, and a
part-length UO2 rod from location H5. The characteristics of the measured samples are listed in Table 10.
The burnup values assigned to these samples are based on values
determined by GE Nuclear Energy (Reager, 2003) using uranium, plutonium, and neodymium isotope ratios. However, for some samples,
large deviations of up to 7% were observed between measured and
calculated 148Nd content, a common burnup indicator. Adjusting the
burnup in the calculations to match the measured 148Nd content resulted in large deviations in other burnup indicator nuclides. The inconsistencies in sample burnup have not been resolved. The impact of
uncertainties in the estimated sample burnup values is assessed in
Section 5.3 of this paper.
The reported void fraction distribution with the Limerick data are
not based on detailed core simulation codes but were instead developed
by using time-dependent core average axial void fraction and detailed
3-D power profile, potentially introducing additional uncertainty in the
Fig. 8. Polaris model of Leibstadt SVEA-96 10 × 10 assembly.
117
Nuclear Engineering and Design 345 (2019) 110–124
I.C. Gauld and U. Mertyurek
Fig. 9. Polaris model of Limerick-1 GE11 9 × 9 assembly.
void fraction values.
The Limerick measurements were previously evaluated under the
YMP project using depletion codes employing both 1D transport models
(Radulescu, 2003) and 2D models (Mays, 2004). The detailed design
information for the GE11 assembly and the operating history data for
assembly YJ1433 are currently not public, but they may be made
available in the future through nondisclosure agreements.
Fig. 10. Box plot of the major actinide isotopes.
4. Results and discussion
4.1. Isotopic bias and uncertainty
The calculated concentrations of all nuclides considered in the
burnup credit analysis methodology (Table 1) were compared to measured concentrations obtained by destructive radiochemical analysis of
the fuel samples. The calculated concentrations correspond to the time
of measurement of each isotope, with the exception of samples from
Fukushima Daini-2 assembly 2F2DN23, which were back calculated by
the laboratory to the time of discharge from the reactor.
One sample from the Fukushima Daini-2 assembly 2F2DN23,
sample SF99-10, was not included in the analysis due to its very close
proximity to the end of the active fuel column. The results for this
sample exhibited very large biases that are attributed to the spectral
change near the ends of the fuel rods which are not accounted for in 2D
models (DeHart et al., 2008).
The deviations between the Polaris calculations (C) of nuclide
content and measurements (M) are expressed as the relative percent
Fig. 11. Box plot of the minor actinides and fission products (Mo, Tc, Ru, Ag,
and Rh).
Table 10
Summary of Limerick GE11 9 × 9 assembly measurements.
Assembly ID
Rod ID
Sample ID
Fuel type
Axial height (mm)
Avg. Void (%)
Enrichment (wt %
YJ1433
D8
D8-3D2
D8-4G3
D9-1D2
D9-2D2
D9-4D4
D9-4G1E1
H5-3A1C
H5-3A1G
UO2-Gd2O3
UO2-Gd2O3
UO2
UO2
UO2
UO2
UO2
UO2
823
1301
308
623
823
1305
308
623
54.8
68.8
12.1
44.1
65.4
69.1
54.8
57.7
3.60
3.60
3.95
3.95
3.95
3.95
3.95
3.95
D9
H5
118
235
U)
Gd content (wt % Gd2O3)
Burnup (GWd/MTU)
5.0
5.0
0
0
0
0
0
0
54.4
37.0
62.1
65.5
64.9
56.5
57.9
57.8
Nuclear Engineering and Design 345 (2019) 110–124
I.C. Gauld and U. Mertyurek
The statistical summary of the results for each nuclide are listed in
Table 11, which includes the total number of measured samples available for each nuclide, the mean deviation, the standard deviation, the
median value, minimum and maximum deviations, the 1st and 3rd
quartiles (range contains 50% of the data points), and the P10 and P90
percentiles (range contains 80% of the data points).
A similar analysis of PWR samples using the 2D TRITON sequence
SCALE was performed by Ilas et al. (2012). The present results for the
BWR samples show similar trends with PWR analysis results. However,
for most nuclides, the standard deviation is larger for the BWR samples.
5. Applications to burnup credit
The most widely used approach for burnup credit validation involves validating the separate components of the criticality safety
analysis (Burnup Credit for LWR Fuel, 2008): components related to the
prediction of spent fuel nuclide compositions and components associated with the criticality calculation. Validation of the code prediction
of nuclide compositions is routinely performed using experimental data
from destructive radiochemical analysis of spent fuel samples. Validation of the criticality calculation is frequently performed using applicable critical experiments.
Several different approaches have been developed and used to assess the effects of bias and uncertainty in predicted nuclide compositions on the keff of a criticality application model (Gauld, 2003). In the
present study, the direct application of measured nuclide compositions
and calculation compositions are used to assess uncertainties in criticality due to the nuclide composition (Wimmer, 2004).
Fig. 12. Box plot of the fission products (Nd, Cs, Sm, Eu, and Gd).
difference (C/M – 1)%. The distributions for these deviations are presented as box plots in Figs. 10–12, showing the mean, median, quartiles, and box whiskers that represent the 10th (P10) and 90th (P90)
percentiles of the data (this range contains 80% of the data points) and
the min/max values (marked with asterisks) of the distributions. The
individual values for each sample are also shown. Maximum values in
234
U, 238Pu, 242Pu, 241Am, 243Am and 109Ag percent differences are
above 60% and are not shown in the plots in order to display distribution details. These nonparametric plots are based on the actual
deviations and make no assumptions about the statistical isotopic distributions (e.g., normality). An outlier analysis of these distributions
could be performed; however, in this study, no data were rejected based
on outlier analysis.
5.1. Nuclide concentration model
Criticality calculations were performed using the measured nuclide
concentrations for each fuel sample using the application model.
Separately, criticality calculations were also performed using the same
model, with nuclide concentrations calculated by Polaris for the same
samples. The nuclide concentrations were calculated using Polaris with
best-estimate values of the irradiation parameters that were not
Table 11
Statistical analysis of predicted isotopic concentrations (C/M-1) (%).
Data
No. of Samples
Mean
Standard Deviation
Median
Minimum
Maximum
1st Quartile (Q1)
3rd Quartile (Q3)
10th Percentile (P10)
90th Percentile (P90)
234
76
76
76
76
76
76
76
76
76
62
62
29
50
50
23
16
14
15
16
35
32
34
35
35
15
25
25
15
6.8%
4.3%
1.6%
−0.1%
9.5%
−0.9%
−3.1%
−3.3%
1.2%
2.8%
1.3%
−2.4%
4.5%
2.5%
2.0%
25.5%
5.5%
31.0%
−3.2%
0.2%
−6.6%
2.6%
−0.5%
4.7%
−9.2%
6.3%
13.9%
5.2%
13.4%
11.2%
4.8%
0.3%
21.1%
8.7%
8.4%
11.6%
17.2%
17.4%
33.5%
11.9%
4.0%
3.2%
7.7%
15.5%
13.4%
38.1%
7.2%
8.2%
12.2%
6.6%
11.9%
6.5%
21.8%
3.7%
12.8%
9.0%
5.5%
2.8%
1.2%
−0.1%
6.7%
−1.0%
−2.4%
−2.4%
1.2%
3.6%
−7.5%
−5.7%
3.9%
1.4%
−0.4%
23.3%
4.2%
20.2%
−2.9%
1.6%
−6.7%
3.3%
−0.2%
6.0%
3.2%
6.0%
10.0%
2.5%
−37.0%
−15.1%
−6.0%
−0.8%
−38.8%
−22.8%
−28.3%
−34.5%
−42.6%
−50.3%
−44.5%
−19.8%
−4.1%
−2.5%
−11.5%
−4.3%
−4.7%
−17.8%
−24.0%
−17.0%
−34.0%
−10.4%
−18.2%
−8.5%
−48.4%
−3.2%
−8.5%
−6.2%
66.6%
36.5%
15.7%
0.5%
93.6%
22.7%
31.4%
40.1%
87.9%
69.1%
122.8%
46.4%
13.1%
11.8%
17.6%
49.5%
48.8%
147.2%
7.7%
17.0%
20.2%
15.8%
37.9%
13.6%
11.7%
14.0%
6.0%
31.1%
1.4%
−2.8%
−1.5%
−0.2%
−1.9%
−6.6%
−6.9%
−8.8%
−4.5%
−5.0%
−16.6%
−7.7%
2.1%
0.7%
−3.1%
14.6%
−2.2%
12.7%
−5.0%
−4.8%
−16.6%
−4.2%
−10.0%
0.7%
−32.7%
4.7%
10.0%
1.1%
9.9%
9.1%
3.2%
0.1%
20.1%
4.4%
−0.5%
2.9%
9.6%
10.5%
4.9%
−1.1%
7.0%
3.6%
5.0%
38.7%
7.4%
46.4%
1.7%
6.0%
1.6%
7.5%
4.9%
10.2%
7.7%
9.2%
19.9%
5.0%
−5.4%
−8.1%
−3.4%
−0.6%
−18.1%
−11.6%
−12.6%
−17.6%
−19.8%
−15.2%
−26.7%
−11.3%
0.0%
−0.8%
−4.8%
6.0%
−3.3%
−4.5%
−11.9%
−10.8%
−20.2%
−8.1%
−12.7%
−7.1%
−39.3%
0.6%
50.4%
−0.3%
20.6%
22.0%
7.7%
0.2%
33.2%
10.2%
6.5%
9.2%
15.1%
15.6%
49.9%
6.1%
10.8%
8.0%
14.5%
45.3%
9.5%
54.5%
3.6%
7.7%
5.6%
9.6%
14.4%
12.2%
9.3%
10.3%
4.0%
20.2%
U
U
U
238
U
238
Pu
239
Pu
240
Pu
241
Pu
242
Pu
241
Am
243
Am
237
Np
143
Nd
145
Nd
95
Mo
99
Tc
101
Ru
109
Ag
133
Cs
147
Sm
149
Sm
150
Sm
151
Sm
152
Sm
151
Eu
153
Eu
155
Gd
103
Rh
235
236
119
Nuclear Engineering and Design 345 (2019) 110–124
I.C. Gauld and U. Mertyurek
Detailed Irradiation
History Information
for Radiochemical
Assay Sample
Measured Isotopic
Concentrations for
Radiochemical Assay
Sample
Stainless steel
Water
Calculate Isotopic
Concentrations with
Polaris
Calculate
for KENO
Criticality Model
Fig. 14. Radial view of the KENO V.a GBC-68 cask model (elevation of vanished lattice).
Calculate
for KENO
Criticality Model
bias value for each sample, this procedure generated minimum and
maximum bounding keff values (since the missing fission products are
all neutron absorbers) that reflect the potential uncertainty due to the
use of surrogate concentrations in the keff calculations.
Measurements of all major actinides were available for most samples considered in this report, with the exception of 14 samples that did
not measure 241Am. Measurements for minor actinides and fission
products were available for a reduced number of samples. The number
of sample measurements available for each nuclide is given in Table 11.
Calculate Difference
Values
Between
-
If
If
5.2. Cask application model
> 0.0 calculation overpredicts
< 0.0 calculation underpredicts
The GE14 fuel assembly is used as the reference design for these
studies. It is a common assembly design used in US BWRs, and it includes advanced geometry features seen in modern BWR fuel assemblies (e.g., large water rods, partial length rods, relatively high enrichment, and use of gadolinium-bearing fuel rods).
The computational benchmark model developed by Mueller et al.
(2013) as a generic burnup credit (GBC) cask containing 68 BWR assemblies (GBC-68 cask) was used to quantify the impact of isotopic bias
and uncertainty in the criticality analysis. The cask was modeled using
the KENO V.a Monte Carlo criticality code (Fig. 14). The GBC-68 cask
model assumes that all fuel rods contain the same nuclide compositions
both axially and radially. Axial variations (i.e., the natural uranium
blanket regions) or enrichment zoning of the fuel rods in the assembly
were not modeled. These modeling assumptions that were used in the
present study have been used previously in BWR criticality studies
(Marshall et al., 2016).
Fig. 13. Uncertainty analysis methodology for nuclide compositions (adapted
from (Wells, 2004)).
adjusted for conservatism in the calculations. The difference between
the keff obtained using measurements (k m
eff ) and the keff from calculations (k ceff ) provides a direct measure of the net impact (Δkeff bias) associated with the spent fuel nuclide calculations. The calculational
procedure is illustrated in Fig. 13. Statistical analysis of a sufficient set
of representative fuel samples can then be used to develop appropriate
estimates of uncertainty and margins for criticality safety.
By applying nuclide measurements in the application model, the
validation method relies directly on experimental measurements. This
method also inherently addresses potential correlations in the measured
nuclide concentrations. However, the results will also include a component of uncertainty that is associated with the measurements and is
not easily separated from other components of uncertainty. The impact
of measurement uncertainties is estimated in Section 5.3 of this paper.
A common set of major actinides and actinides plus fission products
(Table 1) were used in all criticality calculations. Fuel compositions also
included oxygen in the UO2 fuel matrix. For the application of measurement data to the criticality model, measured nuclide concentrations
in units of mg/gUi were converted to atom number densities using a
fuel density of 10.42 g/cm3.
To account for nuclides that were not measured in some samples,
calculated concentrations were used as surrogate data for missing
measurements. The calculated nuclide concentrations used for surrogate data were adjusted to account for bias using the median bias derived from other samples with measured data (Table 11). The median
provides a better statistical measure of population centrality for nonnormal distributions and in the presence of outliers. To account for
uncertainty in these estimated concentrations, additional keff calculations were performed using surrogate nuclide concentrations that were
adjusted for uncertainty using the P10 and the P90 percentiles of the
deviations obtained between calculated and measured nuclide concentrations listed in Table 11. Therefore, in addition to obtaining a keff
5.3. Criticality calculations
Criticality calculations were performed using the KENO V.a Monte
Carlo neutron transport code with 252-group MG cross sections. The
KENO V.a calculations are accessed through the criticality safety analysis sequence (CSAS) in SCALE. This sequence performs automated,
problem-dependent cross section processing, followed by the KENO V.a
calculation to solve the keff eigenvalue problem.
The measured nuclide concentrations were applied in the GBC-68
application model, and the keff values were calculated with KENO V.a
using data from each of the 76 spent fuel sample measurements. As
discussed previously, three separate criticality calculations were performed using the measured data for each sample:
1. Measured isotopic data plus calculated surrogate data for isotopes
not measured in the sample, with surrogate data calculated based on
the median isotopic bias
2. Measured isotopic data with surrogate data calculated based on the
P10 percentile values
3. Measured isotopic data with surrogate data calculated based on the
120
Nuclear Engineering and Design 345 (2019) 110–124
I.C. Gauld and U. Mertyurek
Fig. 15. keff bias for actinide-only and actinide-plus-fission products results.
fuel (NEA/NSC/WPNCS/DOC, 2011). Reported uncertainties can vary
significantly between different laboratories depending on the uncertainty assessment methods and rigor, the degree of reliance on past
experience, and the components of the measurement uncertainty that
are included in the assessment. For example, uncertainties can vary
based on whether they include all steps of the analysis, starting with
cutting and dissolution of fuel samples. Due to the inconsistency of
uncertainty estimates, measurement uncertainties were not used to
weight the individual sample results in this study.
One sample from the Dodewaard reactor, DU1, was measured at
independent laboratories at SCK·CEN and PSI. A comparison of the keff
results using these two measurement sets shows a difference of about
550 pcm that is attributed to the measurements alone.
P90 percentile values.
The calculated surrogate data were adjusted by simultaneously increasing (when the P90 values are applied) or simultaneously decreasing
(when the P10 values are applied) all surrogate nuclide concentrations
to provide a conservative estimate of this uncertainty component.
Fig. 15 plots the Δkeff (bias) results for each sample as pcm
(1 pcm = 10−5). Uncertainties associated with the use of surrogate data
are shown as error bars. Each sample data point is color coded to
identify the associated reactor and assembly design. In general, the
actinide-only results are similar to the actinide-plus-fission product
results.
These results can be statically analyzed to quantify the uncertainty
associated with the isotopic calculations used in the spent fuel criticality model. Trending on major fuel parameters—including fuel
burnup, void fraction, or other parameters—can be performed, but this
is not shown here.
No statistically significant trends were observed in the results shown
in this paper. Using a simplified statistical analysis of the data that pools
the results without trending, the mean keff bias was determined to be
262 pcm for the actinide-only products and 120 pcm for the actinide
plus-fission products. The standard deviations were determined to be
1380 pcm for the actinide-only products and 1431 pcm for the actinideplus-fission products. The corresponding 95/95 lower one-sided tolerance limit above which 95% of the population lies is −2453 pcm for
actinides only and −2695 pcm for actinides plus fission products. These
values may be applied in developing margins for BWR isotopic uncertainty in burnup credit criticality calculations.
5.4.2. Void fraction
Void fraction information is calculated by the operator with time
steps shorter than the cycle length. The uncertainty in the void fraction
has been estimated by comparing calculated to measured average void
fractions. Measurements analyzed by Morooka et al. (1989) suggest a
relative standard deviation of 5.3% and 6.3% for the predictive codes
COBRA/BWR and THERMIT. These values apply to the average void
fraction within an axial segment of an assembly (node).
The void distribution within the assembly flow channel is not uniform, and the uncertainty in local void in the vicinity of any single fuel
rod can be larger than the uncertainty in the average node void level.
Studies suggest that the void fraction distribution in regions near the
channel wall or corner and water rods can be 25% less than the average
void fraction under some conditions (Inoue et al., 1995). However, the
radial variability can depend significantly on the axial location within
the assembly.
The impact of void fraction uncertainty during depletion on the kinf
of the fuel in out-of-reactor conditions was previously estimated by
Wagner et al. (1999). For core average void fractions of typically 40%, a
10% uncertainty in the void fraction was shown to have a corresponding uncertainty in kinf of ∼ ± 300 pcm. Studies performed in the
present work investigated void uncertainties for fuel rod C3 of Fukushima Daini 1, assembly 2F1ZN3. Three samples, UB (bottom), UM
(middle), and UT (top) were irradiated with void fractions of nominally
10%, 40%, and 70%. Reanalysis of these samples using a ± 10% change
on void fraction uncertainty resulted in a keff uncertainty up to ± 30,
± 600, and ± 300 pcm for these samples, with the largest sensitivity
observed for the middle sample (40% void).
Larger uncertainties may be present in the local void fraction for
5.4. Isotopic model uncertainties
The deviations seen in Fig. 15 include bias from the model and
nuclear data library used in the depletion and criticality calculations, as
well as uncertainties associated with the measurements and input data
used in the depletion calculations. These uncertainties are assessed in
more detail in the following sections.
5.4.1. Measurements
Uncertainties in the measured nuclide concentrations are reported
by the laboratories for all samples used in this study. The uncertainty
depends to a large extent on the measurement method, the type of instrument used for mass spectrometry, the type and accuracy of reference standards, and the isotopic concentration of the isotope in the
121
Nuclear Engineering and Design 345 (2019) 110–124
I.C. Gauld and U. Mertyurek
(Devida et al., 2004), and also from using uranium and plutonium in
limited cases (Reager, 2003). Consequently, the sample burnup is not
known precisely due to uncertainties in the nuclide measurements, the
methods, and nuclear data used in the burnup derivation. Uncertainty
in the burnup, which is an input parameter in the depletion calculations, will affect the nuclide concentrations and the keff of the application model.
The impact of burnup uncertainty on keff was estimated using a
sample UM (mid-axial height) from rod C3 of Fukushima Daini 1 assembly 2F1ZN3 with an average void of 38%. The uncertainty was
evaluated at the end of each cycle of irradiation for five cycles to cover
a range of sample burnups. An uncertainty in burnup of nominally 2%
was found to have a 200 pcm effect at low burnup and up to 600 pcm at
high burnup for the GBC-68 criticality application model.
In the case of the Fukushima Daini 2 data, for cases in which uncertainties in the sample burnup values of up to 6.5% were reported,
the potential impact of keff can be as large as 2000 pcm. The Fukushima
Daini 2 samples exhibit some of the larger variations in the analyzed
data (Fig. 15).
Table 12
Summary of uncertainties.
Parameter
Parameter uncertainty
keff uncertainty (pcm)
RCA measurements
Fuel temperature
1%–5%
50 K
100 K
10%
25%
2%
6%
—
550
100
200
300–600
1500
200–600
600–1800
∼450–590
< 2100
Void fraction
Sample burnup
Nuclear data
Total
some fuel rods in an assembly. In the case of 25% uncertainty, the
impact on the calculated keff of up to 1500 pcm would be expected. Two
of the larger sample deviations are observed for Limerick 1 samples
from rod D8. This rod contained Gd2O3 and had a lower average power,
so it may have experienced a lower local void fraction compared to
other rods in the assembly. While these deviations cannot be definitely
associated with void uncertainty, the calculations significantly overestimate the keff for these samples. This is consistent with an overestimate of the local void conditions for this rod.
5.4.6. Nuclear data uncertainty
A common source of uncertainty in all depletion calculations is the
evaluated nuclear data. Uncertainties for cross sections, fission yields
and decay ratios are captured in covariance libraries. These uncertainties can be propagated to depletion calculations using stochastic
sampling. Recent work by Williams et al. (2013) shows that due to
nuclear data uncertainties, 2–4% uncertainty can be observed in the
predicted major actinide concentrations, and Wieselquist et al. (2013)
have shown that the uncertainty in keff from nuclear data alone can
exceed 500 pcm.
5.4.3. Void history
Time-dependent nodal averaged void fraction information is generally provided with power and fuel temperature history. However, as
in the case of the Fukushima Daini-1 8 × 8 – 2 samples, some experiments only include void fraction distributions that are averaged over
the lifetime of the fuel assembly. Also, even when time-dependent data
are available, some depletion codes may require cycle-averaged void
fractions due to modeling limitations.
The impact of the effect of void fraction history on keff was analyzed
using samples at the bottom (UB), middle (UM), and top (UT) elevations from Fukushima Daini-1 9 × 9 – 9 assembly 2F1ZN3. The samples
were modeled with void fractions averaged over five cycles, and the
calculated keff values were compared to those from the detailed timedependent void models. While the changes in keff values were as large as
1500 pcm for the bottom (at 11% void fraction) and the top (at 60%
void fraction) samples, keff only changed 150 pcm for the middle sample
(at 40% void fraction). The small change in keff for the middle sample is
expected, since the middle nodes exhibit the smallest variation in void
fraction with respect to burnup averaged void fractions.
The uncertainty in keff due to lack of detailed void fraction history
can be significant, but this is dependent on the sample’s location and
the void fraction variations experienced during depletion.
5.4.7. Summary of model uncertainties
Uncertainties in both the measurements and the calculations contribute to the total uncertainty in the criticality model and the variations seen in Fig. 15. The impact of the uncertainty for several main
parameters on the calculated keff of the cask model are summarized in
Table 12. The different parameter values reflect typical uncertainty and
maximum uncertainty values. The range of keff uncertainty values
shown for some parameters reflects different sample burnup and void
values. When these uncertainties are combined, assuming they are independent and combined quadratically, the result is total uncertainty in
the application model up to about 2100. The measurements represent a
large source of the overall uncertainty in terms of the nuclide concentration values and the estimation of the sample burnup that is also
derived from the measurements.
6. Summary and conclusions
5.4.4. Fuel temperature
The fuel temperature is generally reported with the operating history data as obtained by core code calculations. The uncertainty in
these values has been estimated to be ± 50 °C when data are provided
by the operator and ± 100 °C when values are estimated from other
sources of information (OECD Nuclear Energy Agency, 2016). An analysis of Forsmark 3 GE14 assembly GN592 samples was performed by
increasing the average fuel temperature from 792 K to 950 K during the
depletion analysis. The impact on all axial sample positions was nominally 2 pcm/°C in the criticality application model. Therefore, even
when assuming large uncertainties of 100 °C in the fuel temperature,
the uncertainty in keff is no greater than 200 pcm. This indicates that
while fuel temperature is important, the impact is likely to be less than
that from many other sources of uncertainty present in BWR depletion
models.
Experimental RCA data from 76 BWR spent fuel samples were
evaluated to estimate uncertainties in the predicted nuclide concentrations using the Polaris lattice physics code in SCALE. In addition,
these isotopic uncertainties were applied to calculate margins for uncertainty in burnup credit criticality calculations for a dry cask application model.
Isotopic measurements cover a wide range of modern assemblies,
including 8 × 8 – 2, 8 × 8 – 4, 9 × 9 – 7, ATRIUM-9, GE11, and
10 × 10 designs, including GE14 SVEA-96, and SVEA-100. The measured data cover void conditions ranging up to 74% void and a burnup
range from 7 to 68 GWd/MTU. Most of the measurement data used in
this report were obtained from public references and information
compiled and documented as part of the OECD/NEA SFCOMPO spent
nuclear fuel measurement database. Several datasets used in this study
were obtained from proprietary programs. These data may be made
available in the future to support licensing applications through nondisclosure agreements.
The uncertainty analysis methodology used in this study can be
5.4.5. Sample burnup
The reported burnup of each sample is usually derived from measurements of 148Nd (ASTM, 2012); 148Nd plus other fission products
122
Nuclear Engineering and Design 345 (2019) 110–124
I.C. Gauld and U. Mertyurek
readily applied to other computational methods and data and to other
criticality application models. The methodology directly applies measurement and calculated nuclide concentrations to the application
model to calculate the system keff. Margins for isotopic uncertainty can
be derived from a statistical analysis of the results. This procedure, as
applied to the major actinide-only calculations, requires only minimal
analysis of the isotopic distributions of individual nuclides since most
samples include measurements for all major actinide isotopes. For
minor actinide and fission product burnup credit, analysis of individual
isotopic bias and uncertainty was used to develop surrogate isotope
concentration data with uncertainties for isotopes not measured in a
fuel sample. By directly applying measurement data in the application
model, the method inherently considers potential covariances in the
measured nuclide concentrations.
The uncertainty analysis approach has been demonstrated in this
report using SCALE 6.2.2 calculations with ENDF/B-VII.1 cross section
data. Specifically, depletion calculations were performed using the
Polaris code, and criticality calculations were performed using the
KENO V.a code for the GBC-68 dry storage cask model. Therefore, while
the results presented in this paper are specific to this code system and
application model, the results are expected to be similar for other dry
storage and transportation cask designs when using the same computer
codes and cross section data.
The results obtained show a small mean bias of less than 300 pcm
and a standard deviation of about 1400 pcm. The lower one-sided 95/
95 tolerance limits for the population of data are −2453 pcm for actinides only and −2695 pcm for actinides plus fission products. The
analysis presented in this paper suggests that a large component of the
keff uncertainty is likely attributable to measurement and modeling
uncertainties. Further reduction of the keff uncertainties would likely
require access to higher quality measurements with lower uncertainty
and better operating history information for the measured samples.
determination: a comparison of different experimental methods, pp. 106–113.
Norway. HOTLAB: European Hot Laboratories Research Capacities and Needs,
HOTLAB Plenary Meeting,.
England, T.R., Rider, B.F., 1994. Evaluation and Compilation of Fission Product Yields
1993, LA-UR-94-3106 (ENDF–349). Los Alamos National Laboratory.
Gauld, I.C., Radulescu, G., Ilas, G., Murphy, B.D., Williams, M.L., Wiarda, D., 2011.
Isotopic depletion and decay methods and analysis capabilities in SCALE. Nucl.
Technol. 174 (2), 169. />Gauld, I.C., 2003. Strategies for Application of Isotopic Uncertainties in Burnup Credit,
NUREG/CR-6811, prepared for the US Nuclear Regulatory Commission by Oak Ridge
National Laboratory, Oak Ridge, Tennessee.
Guenther, R.J., et al., 1991. Characterization of Spent Fuel Approved Testing Material
ATM-105, PNL-5109-105/UC-802. December. Pacific Northwest Laboratory.
Hannstein, V., Sommer, F., 2017. In: Statistical Analyses of Post Irradiation Experiments
of the BWR Forsmark. Transactions of the American Nuclear Society, San Francisco,
California, pp. 621.
Hermann, O.W., DeHart, M.D., 1998. In: Validation of Scale (SAS2H) Isotopic Predictions
for BWR Spent Fuel. Oak Ridge National Laboratory. />814258.
Ilas, G., Gauld, I.C., Radulescu, G., 2012. Validation of new depletion capabilities and
ENDF/B-VII data libraries in SCALE. Ann. Nucl. Energy 46, 43–55. />10.1016/j.anucene.2012.03.012.
Inoue, A., Kurosu, T., Aoki, T., Yagi, M., Mitsutake, T., Morooka, S., 1995. Void fraction
distribution in BWR fuel assembly and evaluation of subchannel code. J. Nucl. Sci.
Technol. 32 (7), 629–640.
Interim Staff Guidance 8, 2012, Revision 3, “Burnup Credit in the Criticality Safety
Analyses of PWR Spent Fuel in Transportation and Storage Casks.” US Nuclear
Regulatory Commission. < />pdf > .
Jessee, M.A., Wieselquist, W.A., et al., 2014. Polaris: a new two-dimensional lattice
physics analysis capability for the SCALE code system. Proceedings of the
International Conference on Physics of Reactors, PHYSOR 2014. Kyoto Japan.
Lindström, F., 2011. Forsmark 3 – Characteristic Data of Fuel Rod J8 in Bundle GN592,
VNF-1002152744/02, Vattenfall Nuclear Fuel AB report.
MALIBU Program, 2010. Irradiation Data Report of the MALIBU Extension Program,
SCK•CEN report MA 2010/05.
MALIBU Program, 2015. Final Report on the Extension Scope, SCK·CEN report MA
2015/20.
Marshall, W.J., Ade, B. J., Bowman, S., Martinez-Gonzalez, J.S., 2016. Axial Moderator
Density Distributions, Control Blade Usage, and Axial Burnup Distributions for
Extended BWR Burnup Credit, NUREG/CR-7224 (ORNL/TM-2015/544). In: prepared
for the US Nuclear Regulatory Commission by Oak Ridge National Laboratory, Oak
Ridge, Tenn.
Mays, C.W., 2004. Code to Code Comparison of One- and Two-Dimensional Methods,
AREVA document 32-5048840-00, DOC.20041015.0003.
Mertyurek, U., Francis, M.W., Gauld, I.C., 2010. In: SCALE 5 Analysis of BWR Spent
Nuclear Fuel Isotopic Compositions for Safety Studies. Oak Ridge National
Laboratory. report ORNL/TM-2010/286.
Mertyurek, U., Betzler, B.R., Jessee, M.A., Bowman, S.M., 2018. SCALE 6.2 Lattice Physics
Code Accuracy for Light Water Reactor Fuel, PHYSOR 2018: Reactor Physics: Paving
the Way Towards More Efficient Systems. Cancun, Mexico.
Michel-Sendis, F., Gauld, I., Martinez, J.S., et al., 2017. SFCOMPO-2.0: An OECD/NEA
database of spent nuclear fuel isotopic assays, reactor design specifications, and
operating data. Ann. Nucl. Energy 110, 779–788. />2017.07.022.
Morooka, S., Ishizuka, T., Iizuka, M., Yoshimura, K., 1989. Experimental study on void
fraction in a simulated BWR fuel assembly (evaluation of cross-sectional averaged
void fraction). Nucl. Eng. Des. 114, 91–98.
Mueller, D.E., Scaglione, J.M., Wagner, J.C., Bowman, S.M., 2013. Computational
Benchmark for Estimated Reactivity Margin from Fission Products and Minor
Actinides in BWR Burnup Credit, NUREG/CR-7157, prepared for the US Nuclear
Regulatory Commission by Oak Ridge National Laboratory, Oak Ridge, Tenn.
Nakahara, Y., Suyama, K., Suzaki, T., 2000. Technical Development on Burn-up Credit for
Spent LWR Fuels, JAERI-Tech 2000-071. Japan Atomic Energy Research Institute (in
Japanese). English translation published as report ORNL/TR-2001/01.
Nakahara, Y., Suyama, K., Inagawa, J., Nagaishi, R., Kurosawa, S., Kohno, N., Onuki, M.,
Mochizuki, H., 2002. Nuclide composition benchmark data set for verifying burnup
codes on spent light water reactor fuels. Nucl. Technol. 137, 111–126. https://doi.
org/10.13182/NT02-2.
Spent Fuel Assay Data for Isotopic Validation: State of the Art Report, NEA/NSC/WPNCS/
DOC (2011) 5, OECD Nuclear Energy Agency, 2011.
OECD Nuclear Energy Agency, 2016. Evaluation Guide for the Evaluated Spent Nuclear
Fuel Assay Database (SFCOMPO), NEA/NSC/R 2015, 8.
OECD/NEA Working Party on Nuclear Criticality Safety, Expert Group on Assay Data for
Spent Nuclear Fuel. < />html > .
Ortego, P., Rodríguez, A., 2013. Evaluation of Dodewaard DU1 Sample, report prepared
for the OECD/NEA Expert Group on Assay Data for Spent Nuclear Fuel. SEA
Ingeniería y Análisis de Blindajes S.L. Report number SEA-39.
Parks, C.V., DeHart, M.D., Wagner, J.C., 2000. Review and Prioritization of Technical
Issues Related to Burnup Credit for LWR Fuel, NUREG/CR-6665. Nuclear Regulatory
Commission.
Pigni, M.T., Francis, M.W., Gauld, I.C., 2015. Investigation of inconsistent ENDF/B-VII.1
independent and cumulative fission product yields with proposed revisions. Nucl.
Data Sheets 123, 231–236.
Primm III, R.T., 2002. ARIANE International Programme Final Report. Oak Ridge
Acknowledgments
This work was supported by the US Nuclear Regulatory Commission
Office of Nuclear Regulatory Research and DOE Office of Nuclear
Energy Spent Fuel and Waste Disposition Program. The significant
contributions of the Japan Atomic Energy Agency and the Japan
Nuclear Regulation Authority to make BWR assay measurement data
available to the international community are gratefully acknowledged.
This paper is dedicated to the memory of Stephen Bowman (19562018), SCALE project leader from 1995-2009, and manager of the BWR
burnup credit project, for his leadership, guidance, and friendship.
References
Standard Test Method for Atom Percent Fission in Uranium and Plutonium Fuel
(Neodymium-148 Method), ASTM Standard, ASTM E321 – 96, 2012.
Barbero, P., et al., 1979. Post-irradiation Analysis of the Gundremmingen BWR Spent
Fuel, EUR6301en. Joint Research Center Ispra and Karlsruhe Establishments.
Boulanger, D., Lippens, M., Mertens, L., Basselier, J., Lance, B., 2004. High burnup PWR
and BWR MOX fuel performance: a review of belgonucleaire recent experimental
programs. Proceedings of the 2004 International Topical meeting on LWR Fuel
Performance. American Nuclear Society.
Burnup Credit for LWR Fuel, 2008. ANS-8.27-2008, American National Standard,
American Nuclear Society, Lagrange Park, Illinois.
Chadwick, M.B., Herman, M., Obložinský, P., et al., 2011. ENDF/B-VII.1 nuclear data for
science and technology cross sections, covariances, fission product yields and decay
data. Nucl. Data Sheets 112 (12), 2887–2996. />11.002.
Conde, J., Alejano, C., Rey, J.M., 2006. Nuclear Fuel Research Activities of the Consejo De
Seguridad Nuclear. In: Transactions of the 2006 International Meeting on LWR Fuel
Performance, TopFuel 2006, Salamanca, Spain.
DeHart, M.D., Bowman, S.M., 2011. Reactor physics methods and analysis capabilities in
SCALE. Nucl. Technol. 174 (2), 196.
DeHart, M.D., Gauld, I.C., Suyama, K., 2008. Three-dimensional Depletion Analysis of the
Axial End of a Takahama Fuel Rod, International Conference on Reactor Physics
(PHYSOR 2008), Nuclear Power: A Sustainable Resource. Casino-Kursaal Conference
Center, Interlaken, Switzerland.
Devida, C., Betti, M., Peerani, P., Toscano, E.H., Goll, W., 2004. A quantitative burn-up
123
Nuclear Engineering and Design 345 (2019) 110–124
I.C. Gauld and U. Mertyurek
Wieselquist, W.A., et al., 2013. Comparison of burnup credit uncertainty quantification
methods. NCSD 2013: Criticality Safety in the Modern Era: Raising the Bar.
Wilmington, NC.
Williams, M.L., et al., 2013. A statistical sampling method for uncertainty analysis with
SCALE and XSUSA. Nucl. Technol. 183 (3), 515.
Williams, M.L., Kim, K.-S., 2012. The embedded self-shielding method. PHYSOR 2012:
Advances in Reactor Physics. Knoxville, TN.
Wimmer, L., 2004. Isotopic Generation and Confirmation of the BWR Application Model,
AREVA Framatome ANP, Document 32-5035847-01 Yucca Mountain Site
Characterization Office, DOC 20040630.0007. < />ML0923/ML092310719.pdf > .
Yamamoto, T., Kanayama, Y., 2008. Lattice physics analysis of burnups and isotope inventories of U, Pu, and Nd of irradiated BWR 9×9-9 UO2 fuel assemblies. J. Nucl.
Sci. Technol. 45 (6), 547–566. />Yamamoto, T., Yamamoto, M., 2008. Nuclear analysis of PIE data of irradiated BWR 8×82 and 8×8-4 UO2 fuel assemblies. J. Nucl. Sci. Technol. 45 (11), 1193–1214. https://
doi.org/10.1080/18811248.2008.9711908.
Yamamoto, T., 2012. Compilation of Measurement and Analysis Results of Isotopic
Inventories of Spent BWR Fuels, report contributed to the OECD/NEA and included as
part of the SFCOMPO spent fuel database.
Yamamoto, T., 2014. Irradiation Report of Fuel Samples of BWR 9 × 9-9 Fuel, report
prepared for the OECD NEA Data Bank contribution to SFCOMPO.
Zwicky, H.-U., Low, J., Granfors, M., 2010. Fuel Pellet Isotopic Analyses of Samples from
a GE14 Fuel Rod Irradiated in Forsmark 3—Final Report, STUDSVIK/N-10/007,
Studsvik Nuclear AB report.
Zwicky, H.U., 2008. Isotopic Data of Sample F3F6 from a Rod Irradiated in the Swedish
Boling Water Reactor FORSMARK 3, ZC-08/001. ≤ />science/wpncs/ADSNF/ reports/Forsmark3/F3F6.pdf≥.
National Laboratory report ORNL/SUB/97-XSV750-1.
Radulescu, H.R., 2003. Limerick Unit 1 Radiochemical Assay Comparisons to SAS2H
Calculations, CAL-DSU-NU-000002 Rev 00A. Office of Civilian Radioactive Waste
Management.
Radulescu, G., Gauld, I.C., Ilas, G., Wagner, J.C., 2014. Approach for validating actinide
and fission product compositions for burnup credit criticality safety analyses. Nucl.
Technol. 188 (2), 154–171. />Reager, R., 2003. BWR Spent Fuel Isotopic Characterization, NEDO-33094, Revision 0. GE
Nuclear Energy MOL.20030528.0184.2003.
Rearden, B.T., Jessee, M.A. (Eds.), 2017. SCALE Code System, ORNL/TM-2005/39,
Version 6.2.2, Oak Ridge National Laboratory, Oak Ridge, Tennessee. Available from
Radiation Safety Information Computational Center as CCC-834. < https://www.
ornl.gov/sites/default/ files/SCALE_6.2.3.pdf > .
Rowlands, G., 1964. Resonance absorption and nonuniform temperature distributions. J.
Nucl. Energy Parts A/B Reactor Sci. Technol. 16, 235–236.
Sublet, J.-Ch, Koning, A.J., Forrest, R.A., Kopecky, J., 2003. The JEFF-3.0/A Neutron
Activation File—EAF-2003 into ENDF-6 Format, JEFDOC-982. Commissariat à
l’Energie Atomique, France.
Suzuki, M., Yamamoto, T., Fukaya, H., Suyama, K., Uchiyama, G., 2013. Lattice physics
analysis of measured isotopic compositions of irradiated BWR 9 × 9 UO2 fuel. J.
Nucl. Sci. Technol. 50 (12), 1161–1176. />837845.
Wagner, J.C., DeHart, M.D., Broadhead, B.L., 1999. Investigation of Burnup Credit
Modeling Issues Associated with BWR Fuel. ORNL/TM-1999/193. Oak Ridge
National Laboratory.
Wells, A.H., 2004. Isotopic Model for Commercial SNF Burnup Credit, US Department of
Energy, Office of Civilian Radioactive Waste Management report CAL-DSU-NU000007 REV 00B. < > .
124