Performance of a radiophotoluminescence (RPL) system in environmental and area monitoring
Bạn đang xem bản rút gọn của tài liệu. Xem và tải ngay bản đầy đủ của tài liệu tại đây (927.1 KB, 8 trang )
Radiation Measurements 140 (2021) 106514
Contents lists available at ScienceDirect
Radiation Measurements
journal homepage: />
Performance of a radiophotoluminescence (RPL) system in environmental
and area monitoring
E.G. Yukihara *, F. Assenmacher
Department of Radiation Safety and Security, Paul Scherrer Institute, 5232, Villigen, PSI, Switzerland
A B S T R A C T
The objective of this work was to perform an extensive side-by-side comparison between a radiophotoluminescence (RPL) dosimetry system and thermoluminescent
dosimeters (TLDs) or EDIS-1™ Environmental Direct Ion Storage Dosimeters during environmental and area monitoring. The measurement locations include points
around and within the perimeter of the Paul Scherrer Institute (PSI) and nearby facilities. These data are complemented by a study on the RPL detection limit,
uncertainty and dose linearity, as well as two intercomparisons of environmental dosimeters, a Swiss intercomparison organized by PSI and an international
intercomparison organized by the German National Metrology Institute (Physikalisch-Technische Bundesanstalt, PTB, Germany). The laboratory irradiations show that
the detection limit of the RPL dosimeters is < 50 μSv if the time between pre-dose measurement and readout is < 200 days, and the response is linear up to at least
100 mSv with less than 15% deviation from linearity, satisfying the requirements of the Swiss dosimetry ordinance. The RPL doses were more consistent than the TLD
doses over time. The RPL system shows slightly lower doses (12–14%) in comparison with EDIS-1 dosimeters. The intercomparisons for passive environmental
dosimeters in terms of H*(10) showed a good agreement between the RPL dose values and the conventional true values. Altogether, the results demonstrate the
equivalence between RPL and the other dosimetry systems, providing support for the RPL adoption for environmental dosimetry.
1. Introduction
Radiophotoluminescence (RPL) dosimeters based on Ag+-doped
phosphate glasses are now commercially used for dosimetry worldwide
(Miyamoto et al., 2011), having been adopted in Europe by the Institute
for Radiological Protection and Nuclear Safety (Institut de radioprotection
et de Sûret´e Nucl´eaire, IRSN, France) and the International Atomic Energy
Agency (IAEA). The system is used for individual monitoring since 2016
by the accredited Dosimetry Laboratory of the Paul Scherrer Institute
(PSI). Assenmacher et al. (2017) presented the commissioning data of
the system in terms of the operational personal dose equivalent Hp(10),
showing that it satisfies the requirements of the Swiss Ordinance of the
Federal Department of Home Affairs (EDI) on Personal and Environ
mental Dosimetry (hereafter called “Swiss dosimetry ordinance”) (Swiss
Federal Council, 2017).
The RPL is based on the UV-induced photoluminescence signal due to
luminescence centers (Ag0 and Ag++) created in Ag+-doped phosphate
glass upon exposure to ionizing radiation (Miyamoto et al., 2011). The
badge design used at PSI, IRSN and IAEA (GBFJ-01) consists of a holder
containing five different filter types, which defines five areas in the glass
detector with different photon energy responses read out by an auto
mated reader (Hocine et al., 2011; Hocine, 2012; Assenmacher et al.,
2017). These five signals are combined using a proprietary linear
algorithm to calculate the operational quantities Hp(10), Hp(0.07), and
H*(10).
For environmental dosimetry, however, the GBFJ-01 badge design is
not necessarily appropriate because of the non-isotropic response.
Assenmacher et al. (2017) showed that the Hp(10) angle dependence for
S–Cs (Cs-137) and N-80 radiation qualities (ISO, 1999) does not deviate
by more than 20% for angles up to 60◦ . For environmental dosimetry,
however, the angle dependence needs to be verified for the operational
quantity ambient dose equivalent H*(10). Furthermore, environmental
dosimeters are required to be tested up to larger angles than personal
dosimeters, both according to the Swiss dosimetry ordinance and the
international standard IEC 62387 (IEC, 2020).
Limited information is available on the applicability of the RPL
system for environmental and area monitoring. A previous study on a
different environmental RPL dosimetry system reports on characteristics
such as batch homogeneity, reproducibility, linearity, detection limit,
energy dependence and UV sensitivity (Ranogajec-Komor et al., 2008),
but the applicability of those results is limited: firstly, it does not
necessarily apply to the dosimetry system used at PSI, IRSN and IAEA;
secondly, the results are not presented in terms of H*(10) and the angle
dependence was not investigated.
To fill this knowledge gap, the energy and angle dependence of the
H*(10) for the dosimetry system consisting of the glass type FD-7, GBFJ-
* Corresponding author. Department of Radiation Safety and Security, Paul Scherrer Institute, 111 Forschungsstrasse, 5232, Villigen, Switzerland.
E-mail address: (E.G. Yukihara).
/>Received 25 September 2020; Received in revised form 23 November 2020; Accepted 21 December 2020
Available online 29 December 2020
1350-4487/© 2021 The Authors.
Published by Elsevier Ltd.
This is an open access
( />
article
under
the
CC
BY-NC-ND
license
E.G. Yukihara and F. Assenmacher
Radiation Measurements 140 (2021) 106514
01 badge, FGD-660 reader and CDEC-Easy software (Chiyoda Technol
Corp.) was investigated (Assenmacher et al., 2020). Although the energy
dependence was shown to satisfy both the Swiss dosimetry ordinance
and the IEC 62387, the response for angles close to 90◦ exceed the limits
of the Swiss dosimetry ordinance (±20%) for the N-80 radiation quality.
Regarding the IEC 62387 standard, the response at 90◦ shall be deter
mined by rotating the dosimeter 360◦ around the reference direction of
the dosimeter or by eight irradiations rotated by 45◦ each. In this “full
rotation” scenario, the response of the RPL dosimeters was within the
limits of the IEC 62387. At 75◦ irradiation for the N-80, however, the
response was still outside the requirements of the IEC 62387.
Nevertheless, the environmental radiation is typically nondirectional and characterized by a broad photon energy spectrum
(Tereda et al., 1980). Therefore, the angle dependence investigated in
laboratory with directional irradiation at low energies may not be
relevant for practical environmental and area monitoring, except in the
case of an unexpected low energy irradiation at angles close to 90◦ . For
this reason, it is important to carry out a side-by-side comparison be
tween the RPL dosimetry system and other dosimetry systems used for
environmental and area monitoring, to demonstrate the equivalence of
RPL in realistic conditions.
PSI’s Dosimetry Laboratory performs routine environmental and
area monitoring within and outside PSI’s perimeter and in the vicinity of
various other facilities, including at the fence of the Beznau nuclear
power plant and the central interim storage facility Zwilag (Zwilag
Zwischenlager Würenlingen AG). Because of the diversity of dose rates
and energy spectra in the various measurement points, this monitoring
network offers a perfect opportunity to perform this comparison be
tween RPL and other techniques. Outside PSI’s perimeter the radiation
field is dominated by cosmic and terrestrial natural radiation (typically
~0.6 mSv/year). Inside PSI’s perimeter, the radiation field can be
increased due to radiation from the various accelerator facilities,
generated by bremsstrahlung with energies up to hundreds of MeV or a
few GeV, depending on the accelerator, as well as prompt gamma ra
diation due to nuclear reactions and activation of the shielding com
ponents. In monitored points within sealed off areas the photon dose can
reach values >10 mSv/year.
To demonstrate the feasibility of using RPL for environmental
dosimetry for the direct applications at PSI, since 2017 we have carried
out a side-by-side comparison between the RPL dosimetry system and
other dosimetry systems, including Al2O3:C, TLDs and EDIS-1™ Envi
ronmental Direct Ion Storage Dosimeters. In addition, we participated in
two intercomparison for environmental dosimeters, a Swiss intercom
parison organized by PSI, and an international intercomparison orga
nized by the Physikalisch-Technische Bundesanstalt (PTB, Germany)
(Dombrowski, 2019).
In this paper we report representative results of this extensive sideby-side comparison between the RPL system and the TLD or EDIS-1
dosimeters during environmental and area monitoring. These data are
complemented by a study on the detection limit (ISO, 2019), un
certainties and dose linearity, as well as the two intercomparisons for
passive environmental dosimeters organized by PSI and PTB.
Table 1
Luminescence dosimetry systems used in this study.
Parameter
RPL
TLD (Al2O3:C)
TLD (7LiF:Mg,Ti)
Detector
FG-7 Ag-doped
phosphate glass
detectors (35 mm ×
7 mm × 1.5 mm)
GBFJ-01
Al2O3:C single
crystal (~5 mm
diameter × 0.9
mm thickness)
ALNOR-type with
2 detectors
310 ◦ C for 15 s in
reader
7
LiF:Mg,Ti pellet
(~4.5 mm
diameter × 0.9 mm
thickness)
ALNOR-type with
3 detectors
305 ◦ C for 10 s in
reader
265 ◦ C for 12 s
ALNOR
(DOSACUS)
Average of two
detectors,
corrected for
individual detector
sensitivity
305 ◦ C for 10 s
ALNOR
(DOSACUS)
Average of three
detectors,
corrected for
individual detector
sensitivity
Dosimeter
Annealing
Readout
Readers
Dose
calculation
software/
method
370 ◦ C/10 min for
regeneration
(complete cycle: 2
h);
100 ◦ C/1 h before
readout
–
FGD-660 (two
identical readers)
CDEC-Easy
The TLD dosimetry system used in this study is part of the ISO/IEC
17025 (ISO/IEC, 2017) accredited system from the Paul Scherrer Insti
tute (accreditation number STS 0491, Swiss Accreditation Service SAS)
and is described in Table 1. Because of their high sensitivity, Al2O3:C
detectors are used in the environmental dosimeters and in area dosim
eters outside controlled areas, whereas 7LiF:Mg,Ti detectors are used
inside controlled areas, where the dose limits are higher. The TLDs were
regenerated approximately 14 days before deployment. For each data
point, the same TLD is used in alternating quarters (e.g., 2018Q01,
2018Q03, 2019Q01, 2019Q3, etc.). The glow curves and integral values
are stored in a database to be processed later. Auxiliary TLDs (AUSD)
were used to estimate the dose accumulated while in storage after the
reset and before deployment. The TLD readout is performed typically the
day after return of the dosimeters.
The EDIS-1™ Environmental Direct Ion Storage Dosimeters are
commercialized by Mirion Technologies, Inc.
2.2. Dose calculation algorithm
The RPL dose calculation was performed using one of the dose
calculation algorithms included in the software CDEC-EASY. The
selected algorithm calculates H*(10) without background subtraction,
only subtraction of the pre-dose (PD) value read after regeneration. The
dose is, therefore, the total dose since the PD measurement.
For the environmental and area monitoring, the ambient dose
equivalent rate during storage in the laboratory, estimated as 1.9 μSv/
day at PSI based on historical data and confirmed here (see Section 3.1),
was subtracted from the measured values using:
M = H 10X − 1.9
2. Materials and methods
μSv
day
× (Td − d)
(1)
where M is the final (background subtracted) estimate for the dose
equivalent H*(10), H_10X is the RPL indicated value in terms of H*(10)
calculated by CDEC-EASY, Td is the total number of days between the
pre-dose measurement and the detector readout, d is the number of days
the detector was deployed. For the intercomparisons no subtraction was
done, since the dose transport and storage doses were evaluated using
transport detectors.
For the study of the detection limit, uncertainties and dose response,
the detectors were evaluated in terms of Hp(10) without subtraction of
the background. This study was performed in terms of Hp(10) because it
was part of a characterization of the RPL system for personal dosimetry.
Nevertheless, the difference between the Hp(10) and H*(10) calculation
algorithm is only ~12% and, therefore, the results are approximately
2.1. Dosimetry systems
The RPL dosimetry system used in this study is described in Table 1.
Before use, the RPL glass detectors were regenerated and the pre-dose
(PD) signal of the detector (intrinsic background signal) was read and
automatically stored in the database. The RPL glass detectors were then
assembled in the badges and stored in the laboratory until deployment.
After deployment, the RPL dosimeters were disassembled and the RPL
glass detectors were pre-heated for 1 h at 100 ◦ C to accelerate the buildup process of the RPL signal and then read out. Two identical RPL
readers were available for these studies.
2
E.G. Yukihara and F. Assenmacher
Radiation Measurements 140 (2021) 106514
valid for H*(10) as well.
The TLD doses are calculated as the average dose of two or three
detector elements (see Table 1), corrected by the individual element
sensitivity. The calibration factor is determined using calibration de
tectors irradiated using Cs-137 with H*(10) = 1.25 mSv in case of Al2O3:
C TLDs and H*(10) = 2.5 mSv in case of 7LiF:Mg,Ti TLDs. The dose due
to the period between the dosimeter’s regeneration and start of the
deployment is subtracted using the AUSD dosimeters, prepared together
with the routine dosimeters, but read when the deployment begins.
Here the indicated values of the systems are also referred to as “RPL
doses”, “TLD doses” or “EDIS-1 doses”.
participant in the intercomparison and was not involved in its organi
zation. The intercomparison included passive detectors (TLD, RPL) from
three institutions, as well as active detectors and spectrometers (ioni
zation chambers, Geiger-Müller counters and high-purity germanium
detectors) from a total of nine institutions.
The passive dosimeters were exposed in a reference location at PSI
for a period of six months in 2016. Irradiations were also carried out in
laboratory with Cs-137 at two dose levels, one typical for environmental
dosimeters (0.3 mSv) and a higher dose to check the calibration of the
dosimeters (1.7 mSv). Transport detectors were also used and stored in a
lead shielding for the period the other dosimeters were exposed in the
field. The dose in the lead shielding was provided by the organizers and
subtracted from the measured values.
The dose for the field irradiation was estimated using a pressurized
ionization chamber. RSDetection (model RS-131-S131-200) from the
PSI’s Calibration Laboratory, calibrated in the PTB reference fields for
the ambient dose equivalent rate dH*(10)/dt for photon energies be
tween 65 keV and 6700 keV.
2.3. Calibration and laboratory irradiations
The RPL and TLD systems used in this study are calibrated at PSI’s
Calibration Laboratory using a Cs-137 source. The source calibration is
traceable to the primary standards at the PTB (Germany) and has a
relative uncertainty (coverage factor k = 2) of the irradiated dose values
in the range from 3.4% to 3.9%. The EDIS-1 detectors are calibrated by
the manufacturer (Mirion Technologies). In the case of the RPL, the
entire system is calibrated every quarter using calibration dosimeters. In
the case of TLDs, calibration detectors are irradiated in the middle of the
monitoring interval to account for the possible fading.
Additional laboratory irradiations were carried out at PSI’s Cali
bration Laboratory to characterize the dose response, uncertainties
involved, and detection limits. Various RPL glasses were used for each
dose as specified in the text and the dosimeters were read various times
after irradiation. As mentioned in Section 2.2, in these studies the do
simeters were irradiated on phantom with Cs-137 in terms of Hp(10) (on
phantom) with 2 mm PMMA build-up and with doses values ranging
from 0.010 mSv to 100 mSv. Unirradiated detectors were also used. The
readouts (after pre-heating) were carried out at various times after the
irradiation.
2.5.2. IC2017prep intercomparison
The objective of the IC2017prep intercomparison, which took place
between October 2017 and April 2018, was to evaluate passive H*(10)
dosimeters that could be used in the aftermath of a radiological or nu
clear event. The dosimeters were exposed in two reference sites of the
PTB: a free field (terrestrial and secondary cosmic radiation) and a freefloating platform (secondary cosmic radiation). In addition, irradiations
were performed with Cs-137 at 0◦ and 90◦ . Transport detectors were
stored in a lead shielding at an underground facility, where the accu
mulated dose for a 6-month period is ~0.5 μSv only. For a complete
detail of the intercomparison, please see Dombrowski (2019).
3. Results
3.1. Dose response and detection limit
2.4. Environmental and area monitoring network
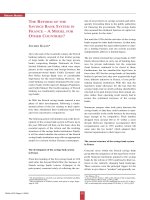
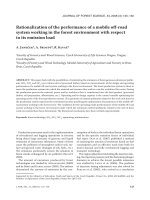
To demonstrate the ability of the RPL detectors to measure the low
doses involved in environmental dosimetry and their uncertainties, we
first analyzed twenty RPL detectors that were annealed and stored in the
laboratory for a period of up to ~270 days. The same detectors were
read repeatedly at different periods (pre-heated only the first time), in
some cases with two identical readers, here called reader 1 and reader 2,
in the same day.
Fig. 1a shows the indicated value of the dosimeters as a function of
the time interval since the PD measurement. The indicated value follows
essentially the line corresponding to a dose rate of 1.9 μSv/day, which
corresponds to the estimated background radiation level at PSI. A
broadening of the response with time within the dosimeters was
observed, but the reason for this broadening is unclear. Previous data
has shown that the coefficient of variation for glasses is below 2.0% for
doses >0.5 mSv (Assenmacher et al., 2017), whereas the coefficient of
variation in Fig. 1a is ~4.0% for the highest doses. Therefore, this
broadening can only be partially explained by difference in glass
sensitivities.
Subtracting the fixed dose of 1.9 μSv/day from the data, we obtain
the background subtracted doses shown in Fig. 1b, where the black data
points are for the measurements obtained using reader 1 and the red
data points are for the measurements obtained using reader 2. The
readouts with two identical RPL readers were performed to demonstrate
the equivalence of the readers. For short periods the intra-day variation
(detector-to-detector variability) is small, but there is a large inter-day
variation. This suggests that for short intervals the uncertainties are
mostly due to reader sensitivity fluctuations. As the time interval in
creases, however, the detector-to-detector variability starts to dominate.
One can also see that the increase in the indicated value is not linear, but
the background-subtracted dose deviates by not more than ±10 μSv up
to 200 days since the PD measurement.
The environmental monitoring network of PSI includes ~35 mea
surement points outside PSI’s perimeter, up to almost 10 km distant
from PSI. These are complemented by ~42 points immediate outside
PSI’s perimeter or at the fence, as well as ~22 points at the fence of
nearby facilities (Beznau nuclear power plant and Zwilag). These were
measured using Al2O3:C TLDs and RPL dosimeters.
Area dosimeters (inside PSI’s perimeter) outside controlled areas
consisted of Al2O3:C TLDs and RPL dosimeters. Because of the low doses
in these points, the results are similar to the environmental monitoring
network described above and will not be presented. Area dosimeters
inside controlled areas were carried out using 7LiF:Mg,Ti TLDs and RPL
dosimeters installed in wooden boxes with a transparent plastic cover
affixed to the wall inside the buildings. The reference levels are 80 mSv/
year for permanent workplaces, 200 mSv/year for temporary work
places; locked-off areas have no reference levels. These reference levels
were established considering the occupancy of the areas and the occu
pational dose limits for radiation workers of 20 mSv/year.
In addition to the environmental and area monitoring of PSI, mea
surements were also carried out using Al2O3:C TLDs from PSI in parallel
with the EDIS-1 dosimeters used routinely by the Leibstadt nuclear
power plant (Kernkraftwerk Leibstadt, KKL) in their environmental
monitoring program.
2.5. Intercomparisons
2.5.1. Swiss intercomparison 2016
The Swiss intercomparison was organized by PSI’s Calibration Lab
oratory under commission of the Swiss Federal Nuclear Safety Inspec
torate (ENSI) in agreement with the Swiss Federal Office of Public
Health (FOPH). PSI’s Dosimetry Laboratory was an independent
3
E.G. Yukihara and F. Assenmacher
Radiation Measurements 140 (2021) 106514
The background-subtracted doses in Fig. 1b can then be used to es
timate the detection limit of the system. The detection limit (DL) was
defined in a first approximation as DL ≅ 3.3 × σ0, where σ0 is the
standard deviation of the background (standard deviation of the net
indicated value), assuming the standard deviation of the signal as being
approximately the same as the standard deviation of the background
(Currie, 1968; ISO, 2019). If the detection limit is plotted for each time
interval, we obtain the black (reader 1) and red lines (reader 2) shown in
Fig. 1c. The detection limit increases with time, mainly because of the
increase in the detector-to-detector variability with time.
For short periods of time, however, the detection limit is underestimated when using only the readouts in a single day, because the
uncertainty is dominated by the day-to-day reader variation. Therefore,
to improve this detection limit estimate we took all the detector readouts
up to 90 days and obtained the mean net indicated value of (2.9 ± 5.0)
μSv, which leads to the detection limit of ~16.5 μSv indicated in Fig. 1c.
This value is well below the lower dose measurement range of 50 μSv
required by the Swiss dosimetry ordinance.
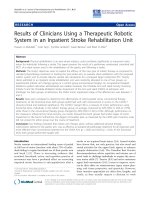
For completeness, Fig. 2 presents the dose response for the set of
dosimeters irradiated with doses from 0.010 mSv to 100 mSv. The de
viation from linearity remains within 15% for the entire range, also
satisfying the Swiss dosimetry ordinance.
3.2. Comparison between RPL and TL dosimeters
3.2.1. Environmental monitoring
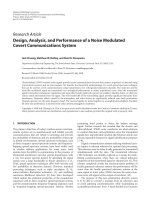
Fig. 3 shows the RPL doses plotted versus the TLD (Al2O3:C) doses for
all environmental dosimeters around PSI. The solid line indicates the 1:1
relationship and the dashed lines indicate the ±10% deviation.
The data in Fig. 3 shows an overall good agreement between the RPL
and TL dosimetry systems, with an average daily dose of approximately
1.9 μSv. Deviations outside the ±10% are observed in a few quarters (e.
g. 2019Q01, 2019Q03). Nevertheless, this is more likely an underesti
mation from the TLDs. As mentioned before (Section 2.1), the same TLDs
are used in alternating quarters, e.g. in 2019Q01, 2019Q03, which in
dicates that the same sets of TLDs are affected.
Fig. 4 shows a box-and-whisker plot of the average RPL and TLD
values for all quarters. The box indicate approximately the first and third
quartiles, the black dot in the center represents the median, the whiskers
represent the largest and smallest data points within 1.5 times the size of
the box from the quartiles, and the points outside are considered as
Fig. 1. (a) Indicated values from unirradiated detectors as a function of time
since pre-dose (PD) measurement, (b) background subtracted dose for the same
detectors and (c) detection limit based on the standard deviation of the de
tectors for reader 1 (black) and reader 2 (red), as well as the detection limit
based on all measurements within the first 90 days (16.5 μSv line). The red
dashed line in (a) represents the expected dose assuming a dose of 1.9 μSv/day.
The error bars represent the standard deviation of the data, i.e., the range of
variation from detector-to-detector and, therefore, provide an estimate of the
uncertainty of each detector. See text for details. (For interpretation of the
references to color in this figure legend, the reader is referred to the Web
version of this article.)
Fig. 2. Dose response of detectors irradiated with various doses read out 16–17
days after the PD measurement. The solid line represents the 1:1 relationship
and the dashed lines the ±15% deviations. The error bars are barely visible in
this graph.
4
E.G. Yukihara and F. Assenmacher
Radiation Measurements 140 (2021) 106514
Fig. 3. Comparison between doses per day estimated using RPL dosimeters and Al2O3:C TLDs for environmental measurements around PSI. The solid line indicates
the 1:1 relation, whereas the dashed lines indicate a ±10% deviation.
Fig. 4. Comparison between the average dose per day estimated using RPL and TLD dosimeters in the environmental monitoring network of PSI’s Dosimetry
Laboratory, presented as box-and-whisker plots (see text for details).
5
E.G. Yukihara and F. Assenmacher
Radiation Measurements 140 (2021) 106514
“outliers” and are used to indicate when the distributions are skewed
(Dalgaard, 2008). In this graph it is possible to see that the median RPL
value stays constant over time, whereas the TLD system occasionally
shows lower values than the RPL system (e.g. 2019Q01).
The actual mean dose in these measured points is not known and,
therefore, one cannot affirm that one system is more correct than the
other. Nevertheless, one can state that the RPL system showed a more
constant mean dose per day over the period investigated.
The results show an overall agreement of the TLDs and RPL dosim
eters in reference conditions (Cs-137) for both doses, with deviations <
5% from the reference value. For the field irradiation, both TLD and RPL
showed an under-response of ~8% in comparison with the dose esti
mated using the RSDetection pressurized ionization chamber, but both
TLD and RPL systems showed the same dose.
3.4.2. IC2019prep intercomparison
IC2019prep results for the RPL dosimetry system are shown in
Table 3. The initial objective was to compare the TL and the RPL
dosimetry systems, but the light-sensitive Al2O3:C TLDs were exposed to
light by mistake and could not be evaluated.
The results for the reference irradiation with Cs-137 at 0◦ showed a
good agreement with the conventional true value. The irradiation with
Cs-137 at 90◦ showed an under-response, as also reported by Assen
macher et al. (2020). The results for both free field exposure (terrestrial
plus secondary cosmic radiation) and floating platform exposure (sec
ondary cosmic radiation) were in good agreement with the conventional
true values, with an over-response of the RPLs between 8 and 14%.
3.2.2. Area monitoring at PSI inside controlled areas
Fig. 5 compares the doses measured using RPL with those measured
using 7LiF:Mg,Ti TLDs inside controlled areas at PSI. The doses are again
below the reference levels per quarter (80 mSv/year or 20 mSv/
quarter), even though the data points include locked-off areas.
Furthermore, the RPL doses correlate with the TLD doses, with a few
exceptions.
3.3. Comparison between RPL and EDIS-1 dosimeters
Fig. 6 compares the RPL data with the EDIS-1 dosimeters exposed
during two quarters at various measurement points at KKL (see Section
2.4). The figure shows that the points with higher dose rate are correctly
tracked by both RPL and EDIS-1 dosimeters. The data again shows an
overall good agreement between the two dosimetry systems, with the
EDIS-1 showing a higher dose than the RPL dosimeters, ~14% in
2019Q04 and ~12% in 2020Q01. This difference is not surprising, given
the different construction of the RPL dosimeters and the EDIS-1 do
simeters and their expected different photon energy response.
4. Conclusions
The results reported here provide further supporting data for the
application of RPL in environmental and area dosimetry.
The laboratory irradiations show that the detection limit of the RPL
dosimeters is below the 50 μSv up to ~200 total days of use (time be
tween pre-dose measurement and readout). Moreover, the response is
linear up to 100 mSv, with less than 15% deviation. Both characteristics
satisfy the requirements of the Swiss dosimetry ordinance for passive
environmental dosimeters.
The comprehensive comparison between the RPL, TLD and EDIS-1
dosimetry systems for the environmental and area measurement
points in various locations (outside the PSI perimeter, inside PSI
perimeter inside controlled areas, environmental measurements at KKL)
showed a good agreement between the techniques. In general the
environmental doses obtained using the RPL system were more constant
3.4. Intercomparisons
3.4.1. Swiss intercomparison
The results of the Swiss intercomparison are presented in Table 2 for
both Al2O3:C TLDs and RPL dosimeters. Because of the small number of
detectors used, all values are presented and only the mean of the relative
response was calculated.
Fig. 5. RPL versus 7LiF:Mg,Ti TLD doses measured inside controlled areas at PSI. The solid line indicates the 1:1 relation, whereas the dashed lines indicate a
±10% deviation.
6
E.G. Yukihara and F. Assenmacher
Radiation Measurements 140 (2021) 106514
Fig. 6. Comparison between EDIS-1 and RPL dosimeters at KKL for various measurement points and two quarters.
Table 2
Conventional true value Ht and indicated value Hm for Al2O3:C TLDs and the RPL dosimetry systems for the 2016 Swiss intercomparison for environmental dosimeters.
The uncertainties correspond to the standard deviation of the mean multiplied by the corresponding tp(ν) value for a 95.45% level of confidence (k = 2) from the tdistribution for degrees of freedom ν, as in Table G.2 from the ISO/IEC Guide 99–3:2008 (ISO/IEC, 2008).
Radiation field
Ht [mSv]
Hm [mSv] (TLD)
Hm/Ht(TLD)
Hm [mSv] (RPL)
Hm/Ht(RPL)
Cs-137
0.300
0.97 ± 0.05
1.7
Combined terrestrial/secondary cosmic
0.182
0.311
0.295
1.636
1.635
0.170
0.176
0.162
0.164
1.0 ± 0.4
Cs-137
0.291
0.294
1.692
1.694
0.164
0.175
0.164
0.163
0.996 ± 0.008
0.92 ± 0.05
Ht [mSv]
Hm [mSv]
Hm/Ht
Cs-137, 0◦
Cs-137, 90◦
Free field
Floating platform
30.0
30.0
0.294
0.137
30.37 ± 0.23
19 ± 3
0.318 ± 0.018
0.156 ± 0.005
1.012 ± 0.008
0.64 ± 0.10
1.08 ± 0.06
1.14 ± 0.03
0.92 ± 0.06
conventional true values. In the Swiss intercomparison, both TLD and
RPL results under-estimated the conventional true value by ~8%,
whereas in the IC2019prep intercomparison the RPL over-estimated the
conventional true value by ~8–14%, depending on the radiation field.
These discrepancies are not related to the calibration of the dosimeters,
which was independently checked using Cs-137 irradiations.
The results presented here, combined with the characterization of
the RPL dosimetry system for personal and environmental applications
(Assenmacher et al., 2017, 2020), support the adoption of the RPL
dosimetry system for environmental dosimetry.
Table 3
Conventional true value and indicated value for the RPL system for the
IC2019prep intercomparison. The uncertainties correspond to the standard de
viation of the mean multiplied by the corresponding tp(ν) value for a 95.45%
level of confidence (k = 2) from the t-distribution for degrees of freedom ν, as in
Table G.2 from the ISO/IEC Guide 99–3:2008 (ISO/IEC, 2008).
Radiation field
0.962 ± 0.004
Declaration of competing interest
over time, the dose per day remaining around 1.9 μSv, whereas the TLD
system shows larger deviations from this value. In locations where
higher dose rates are expected, the RPLs also showed reliable perfor
mance, tracking the TLD or EDIS-1 doses.
In the case of the comparison with EDIS-1 dosimeters, slightly lower
doses (12–14%) were observed using RPL. Because of the very different
construction of the EDIS-1 dosimeters, a large difference in the energy
dependence between the two types of dosimeters is expected and,
therefore, such discrepancies are not unusual.
The intercomparisons for passive dosimeters in terms of H*(10)
showed a good agreement between the RPL dose values and the
The authors declare that they have no known competing financial
interests or personal relationships that could have appeared to influence
the work reported in this paper.
Acknowledgements
We thank the dosimetry service of the Leibstadt Nuclear Power Plant
(Kernkraftwerk Leibstadt, KKL) for providing the data on the EDIS-1
detectors and Sabine Mayer (PSI) for comments on the manuscript.
This work was funded by the Swiss Federal Nuclear Safety Inspectorate
ENSI, contracts no. CTR00491.
7
E.G. Yukihara and F. Assenmacher
Radiation Measurements 140 (2021) 106514
References
a Function of Photon Energy - Part 3: Calibration of Area and Personal Dosemeters
and the Measurement of Their Response as a Function of Energy and Angle of
Incidence. International Organization for Standardization, Geneva.
ISO, 2019. International Standard ISO 11929:2019: determination of the characteristic
limits (decision threshold, detection limit and limits of the confidence interval) for
measurements of ionizing radiation – fundamentals and application - Part 1:
elementary applications. In: International Organisation for Standardisation.
ISO/IEC, 2008. ISO/IEC Guide 98-3: Guide to the Expression of Uncertainty in
Measurement (GUM:1995). International Organization for Standardization, Geneva.
ISO/IEC, 2017. ISO/IEC 17025:2017: General Requirements for the Competence of
Testing and Calibration Laboratories. International Organization for
Standardization, Geneva.
Miyamoto, Y., Takei, Y., Nanto, H., Kurobori, T., Konnai, A., Yanagida, T., Yoshikawa, A.,
Shimotsuma, Y., Sakakura, M., Miura, K., Hirao, K., Nagashima, Y., Yamamoto, T.,
2011. Radiophotoluminescence from silver-doped phosphate glass. Radiat. Meas. 46,
1480–1483.
Ranogajec-Komor, M., Knezevic, Z., Miljanic, S., Vekic, B., 2008. Characterisation of
radiophotoluminescent dosimeters for environmental monitoring. Radiat. Meas. 43,
392–396.
Swiss Federal Council, 2017. Verordnung des EDI über die Personen- und
Umgebungsdosimetrie (Dosimetrieverordnung).
Tereda, H., Sakai, E., Katagiri, M., 1980. Environmental gamma-ray exposure rates
measured by in-situ Ge(Li) spectrometer. J. Nucl. Sci. Technol. 17, 281–290.
Assenmacher, F., Boschung, M., Hohmann, E., Mayer, S., 2017. Dosimetric properties of a
personal dosimetry system based on radiophotoluminescence of silver doped
phosphate glass. Radiat. Meas. 106, 235–241.
Assenmacher, F., Musto, E., Yukihara, E.G., 2020. Dosimetric properties of an
environmental H*(10) dosemeter based on radiophotoluminescence of silver doped
phosphate glass. Radiat. Meas. 138, 106468.
Currie, L.A., 1968. Limits for qualitative detection and quantitative determination application to radiochemistry. Anal. Chem. 40, 586–593.
Dalgaard, P., 2008. Introductory Statistics with R. Springer, New York.
Dombrowski, H., 2019. Preparedness intercomparison of passive H*(10) area photon
dosemeters in 2017/2018 (IC2017prep). J. Instrum. 14, P10008.
Hocine, N., Donadille, L., Huet, C., Iti´
e, C., Clairand, I., 2011. Personal monitor glass
badge: theoretical dosimeter response calculated with the Monte Carlo transport
code MCNPX. Radiat. Protect. Dosim. 144, 231–233.
Hocine, N., 2012. Calculated angular responses of an RPL dosimeter to photon and beta
radiation. Radiat. Protect. Dosim. 151, 374–378.
IEC, 2020. International Standard IEC 62387:2020-01: radiation protection
instrumentation – dosimetry systems with integrating passive detectors for
individual, workplace and environmental monitoring of photon and beta radiation.
In: International Electrotechnical Commission, Geneva.
ISO, 1999. International Standard ISO 4037-3: X and Gamma Reference Radiation for
Calibrating Dosemeters and Doserate Meters and for Determining Their Response as
8