Translation of the absorbed dose in the mobile phone to organ doses of an ICRP voxel phantom using MCNPX simulation of an Ir-192 point source
Bạn đang xem bản rút gọn của tài liệu. Xem và tải ngay bản đầy đủ của tài liệu tại đây (1.79 MB, 8 trang )
Radiation Measurements 146 (2021) 106603
Contents lists available at ScienceDirect
Radiation Measurements
journal homepage: www.elsevier.com/locate/radmeas
Translation of the absorbed dose in the mobile phone to organ doses of an
ICRP voxel phantom using MCNPX simulation of an Ir-192 point source
M. Discher a, b, *, J. Eakins c, C. Woda a, R. Tanner c
a
Helmholtz Zentrum München, Institute of Radiation Protection, 85764, Neuherberg, Germany
Paris-Lodron-University of Salzburg, Department of Geography and Geology, 5020, Salzburg, Austria
c
Public Health England, CRCE, Chilton, Didcot, Oxon, OX11 0RQ, United Kingdom
b
A R T I C L E I N F O
A B S T R A C T
Keywords:
ICRP voxel Phantom
Mobile phone
Organ dose
Conversion factor
Retrospective dosimetry
Monte Carlo modelling has been performed to simulate aspects of the CATO exercise, which recreated the
exposure of individuals on a bus to an Ir-192 point source. The modelling allowed a comparison and check of the
measured data provided in (Rojas-Palma et al., 2020; Discher et al., 2021), and an investigation into the dose
conversion coefficients that are required in order to use fortuitous dosemeters as indicators of absorbed doses to
individuals; a conversion factor of 0.22 ± 0.01 was found to be appropriate to relate the phone dose to the
average organ dose. The modelling also allowed some of the parameters of the experiment to be varied, and their
impacts explored. In general, measured and modelled data agreed acceptably, with similar average doses and
broadly similar variations in the results as a function of organ type.
1. Introduction
In the past decade there has been considerable interest in identifying
and developing fortuitous personal dosemeters: items carried by the
general population that may be used for individual dose reconstruction
in the case of a radiological accident (Ainsbury et al., 2011). Some
constituents of a mobile phone, like display glass (Discher and Woda,
2013) or electronic components on the circuit board, such as the
aluminium oxide substrate of resistors (e.g. Inrig et al., 2008; Beerten
et al., 2009; Ekendhal and Judus, 2012; Pascu et al., 2013), have been
found to be sensitive to ionizing radiation, and have hence been
considered as potential emergency dosemeters. Their dosimetric prop
erties were subsequently tested and characterized by several labora
tories using optically and/or thermally stimulated luminescence
methods (OSL/TL). The usability and feasibility of these materials, and
the dosimetry protocols that were developed to exploit them, have been
demonstrated in several controlled inter-laboratory comparison exer
cises carried out within the EURADOS network (Bassinet et al., 2014;
Fattibene et al., 2014).
With the aim of providing a field test of the use of mobile phones as
emergency dosemeters, an exposure of a realistic irradiation scenario
was performed at a military test site in 2014. This field test, named
CATO (CBRN Architecture, Technologies and Operational procedures),
served as a reconstruction of an accident that happened in Cochabamba,
Bolivia, in 2002 involving an Ir-192 gamma source carried in the cargo
hold of a bus, to which the passengers were exposed for the duration of
their journey (IAEA, 2004). The reconstruction used anthropomorphic
phantoms positioned in various seats of a bus to simulate the exposure of
the individuals on-board. Mobile phones were placed on the phantoms
in realistic locations. Routine physical dosimetry methods, such as
electronic personal dosemeters (EPDs) and thermoluminescence dose
meters (TLDs), were also used on the anthropomorphic phantoms
alongside the mobile phones: the results from these TLD and EPD
measurements were compared against the dose assessments made using
fortuitous dosemeters as a control (see details in Rojas-Palma et al., 2020
and Discher et al., 2021).
Despite the successes of the above, there exists a fundamental
problem with the use of mobile phones as fortuitous dosemeters: the
absorbed dose in the material of the fortuitous dosemeter represents a
single measurement point that cannot automatically be associated with
the transferred dose to the individual. Conversely, the desired endpoint
of dose reconstruction is the absorbed dose in the body of the human,
and not the absorbed dose in the mobile phone. Indeed, this problem
may be common to fortuitous dosemeters in general, and contrasts
strongly with the use of standard-issue dosemeters in routine radiolog
ical protection applications: the latter are designed and worn specifically
* Corresponding author. Paris-Lodron-University of Salzburg, Department of Geography and Geology, 5020, Salzburg, Austria.
E-mail address: (M. Discher).
/>Received 27 January 2021; Received in revised form 21 May 2021; Accepted 25 May 2021
Available online 29 May 2021
1350-4487/© 2021 The Authors. Published by Elsevier Ltd. This is an open access article under the CC BY license ( />
M. Discher et al.
Radiation Measurements 146 (2021) 106603
to optimize the accuracy with which they can assess the personal dose
equivalent to the individual. This tenet is not the case for fortuitous
dosemeters, however, which could be located anywhere about the body
and are neither tissue-equivalent nor originally intended to be used for
dose measurements. As a consequence, in order for a fortuitous dose
meter to be of use in the triage process for medical treatment of those
with high doses, it is necessary to correct the doses measured and
convert them to the doses received by the individual.
The above correction may be achieved by performing radiation
transport calculations to derive dose conversion factors that relate the
measured dose in the fortuitous dosemeter to the dose to the individual
(Van Hoey et al., 2021; Kim et al., 2019; Eakins and Ainsbury, 2018a,b).
Eakins and Kouroukla (2015) performed such calculations for some
generalized exposure scenarios, and investigated the effect of approxi
mated locations of a mobile phone on a voxel phantom exposed in
different geometries and to various source energies; their work was
supported by measured data obtained using a Rando-Alderson phantom
(Kouroukla, 2015). However, although conversion factors have been
calculated for some general cases, they do not currently exist for all
exposure scenarios, for example point sources located close to the body.
Moreover, in the present case, the focus was on the dose to the display
screen of the phone, rather than to the aluminium oxide substrate of
resistors that was considered previously. There was hence a need to
calculate new data that are relevant to the recent field-test reconstruc
tion of the Cochabamba incident.
A joint research endeavour between EURADOS WG6 (‘Computa
tional dosimetry’) and WG10 (‘Retrospective dosimetry’) addressed the
question of how the absorbed dose measured in the fortuitous dosemeter
can be linked to the absorbed doses to the organs in the body. The goal of
the work was to perform a Monte Carlo simulation of the Cochabamba
incident to derive dose conversion factors that are appropriate for the
CATO reconstruction exercise. Similar to earlier work, the factors were
determined using the combination of an anthropomorphic voxel phan
tom and a model of a mobile phone, to simulate the absorbed organ
doses in the body and the absorbed dose in the fortuitous dosemeter,
respectively. Using such calculated dose conversion factors, the absor
bed dose in the mobile phone can be translated to appropriate dose
quantities (organ doses) for the specific irradiation scenario. Moreover,
the technique could be experimentally verified for a specific exposure
scenario by comparing modelled and measured display glass dose
results.
In addition to the wearing of routine and fortuitous dosemeters, the
anthropomorphic phantoms of the CATO experiment also incorporated
TLD elements throughout their volumes to estimate the dose distribu
tions as a function of position in the body, and in turn assess the overall
doses to its various organs. Together with the results for the mobile
phones, these organ dose measurements are therefore supported by a
second important use of the Monte Carlo simulations: to verify the
experimental data by comparing modelled and measured results, and
accordingly confirm the mapping of dose throughout the body. Confir
mation of the measured data is important: although from one perspec
tive TLD results might be considered reference data, as they are the most
well-characterized, they still have significant limitations, such as the
intrinsic TL-efficiency and non-tissue equivalence of their sensitive
materials relative to the various organ materials, which are included
correctly in the voxel models. Additionally, the modelling is beneficial in
verifying the data from the phone experiments, which by their nature
are inevitably less dosimetrically reliable. Overall, however, all of the
measurements and models used within this CATO experiment are
associated with significant uncertainties, so investigating agreements
(or otherwise) across datasets provides essential insight into both en
deavours. Moreover, the anthropomorphic phantom used for the mea
surements did not have limbs; the Monte Carlo modelling therefore also
allowed an investigation into the likely impact of the absences of the
arms and legs on the various organ doses within the body, giving insight
into this potential limitation of the CATO approach.
2. Overview of materials and methods
The current section summarizes the measurements, noting that a
fuller description is available in (Rojas-Palma et al., 2020; Discher et al.,
2021). An overview of the general approach to modelling that was taken
is also provided, noting that fuller details are provided in the subsequent
section, where each modelling campaign is detailed along with the re
sults that were obtained.
2.1. Simulation and calculation methods
The calculations were carried-out using the general-purpose Monte
Carlo radiation transport code MCNPX (X-5 Monte Carlo Team, 2003;
Shultis and Faw, 2011), which is widely used in radiation physics
research for a variety of applications. The MCNPX model consisted of the
ICRP 110 male voxel phantom (ICRP, 2009) as implemented at PHE
(Jansen and Shrimpton, 2011) surrounded by an air-filled cylinder with
a diameter of 50 m and a height of 4 m. The voxel phantom was com
bined with a model of a modern touchscreen mobile phone. The phone
model included all of the major parts of the device, most of which were
simplified as simple rectangular cells; the geometry and material spec
ifications of the phone are detailed elsewhere (Discher et al., 2015). In
order to replicate the experimental conditions of the CATO exercise, the
mobile phone was fixed centrally on the front face of the voxel phantom
at approximately the height of the pelvis. The phone was orientated such
that its glass display screen faced away from the body and the entire
display cell serves the detector.
Only photon transport was considered in the simulation (MCNP
‘mode p’), with the kerma approximation reasonably assumed. This
improved the computational efficiency of the calculations, and hence
statistical uncertainties on the results, and was justified on the grounds
that secondary charged particle equilibrium would be anticipated in the
real scenario: the materials of the phone, chair and surrounding air
would likely provide sufficient build-up (ICRU, 1994) to the Ir-192
photons, which have a mean energy of ~0.3 MeV. Along with the
dose absorbed by the glass screen of the phone, dose depositions were
also tallied in a number of regions of interest within the body, including
all organs identified as key to radiological protection by ICRP (ICRP,
2007). In general, these doses were recorded using photon track-length
kerma tallies (MCNP ‘f6:p’). The exceptions to this were the doses to the
red bone marrow (RBM) and endosteal tissue, which were estimated
using fluence tallies (MCNP ‘f4:p’) weighted by kerma factor multipliers
(King et al., 1985; Cristy et al., 1987) in order to overcome problems
associated with secondary charged particle inequilibria occurring on the
scale of their microstructures. In addition to the doses to the various
individual organs, and in accordance to the scheme adopted previously
(Eakins and Kouroukla, 2015) the average dose to the whole body, DB,
was also assessed by simply averaging the absorbed doses to the 27
organs identified by ICRP 103 as being particularly radio-sensitive for
stochastic effects and used in the definition of effective dose, without
any additional weighting or processing.
2.2. Photon source and determination of the absorbed dose
The Ir-192 gamma source of the CATO reconstruction exercise was
represented in the model by an ideal point source, with photons emitted
isotropically with an energy distribution taken from a tabulated photon
energy spectrum (Browne, 2003). The simplified form of the source is
justified by its small dimensions, with the radioactive capsule having a
diameter of only 2 mm. In principle, the encapsulation of a physical
Ir-192 source would affect the energy spectrum, but precise information
on this was not known at the time of modelling. In practice, however, the
impact of this is likely to be low: any encapsulation would most strongly
affect low-energy photons, but <8% of the fluence from the raw Ir-192
source has an energy <200 keV. The location of the source relative to the
phantom was adjusted in accordance with the field experiment, and was
2
M. Discher et al.
Radiation Measurements 146 (2021) 106603
at a position that was 38 cm in front, 86 cm below, and 9 cm towards the
right side (when viewed from face-on) relative to the approximate centre
of the voxel phantom. The dose-per-source-particle tally results from the
MCNP simulations were converted to absolute absorbed dose data using
the decay-corrected activity of the source used in the CATO experiment
(1.5 TBq), the exposure time (8 h), and the emission probability per
decay (i.e. photon yield, Y = 2.168) for Ir-192 (Browne, 2003), allowing
simulated and experimental results to be directly comparable to each
other.
3. Models, results and discussion
In general, the statistical uncertainties on all of the MCNP results are
of the order of ~1%; for clarity, they have therefore been omitted from
the plots shown later. However, these values only reflect the variances
within the inherently stochastic Monte Carlo process, and do not take
into account the concurrent systematic or other uncertainties that might
be associated with the modelling, which are much harder to quantify
and are likely to be significantly greater. The uncertainties on the
measured data are around 20%.
2.3. Experimental results from the anthropomorphic phantom
3.1. Modelled results of various exposure geometries
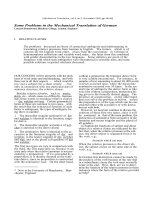
Equivalent doses in organs of the phantom were measured during the
CATO experiment using many small thermoluminescence dosemeters
(TLDs), which were placed throughout each slice of the phantom. MCPN TLDs (LiF:Mg, Cu, P) calibrated in air and converted to dose (incl.
energy dependence correction using the initial Ir-192 spectrum) in ICRU
40 tissue or bone were used to measure the equivalent organ doses in the
phantom. Some parts of the phantom (e.g. legs, arms) were neglected
and some organs (e.g. breast, heart, gall bladder and prostate) were not
measured in the experiment. The absorbed dose in the mobile phone was
measured using the “pre-bleached with blue LEDs” protocol (Discher
and Woda, 2013). Full details of the experiment are available elsewhere
(Rojas-Palma et al., 2020). The set-up used in the measurements is
shown in Fig. 1.
To confirm the initial set-up of the Monte Carlo model, the first step
was to derive absorbed dose data for the organs when the phantom was
exposed to Ir-192 from various exposure geometries: anterior-posterior
(AP), posterior-anterior (PA), left-lateral (LLAT) and right-lateral
(RLAT). The results of these simulations were then compared and
cross-checked against the data given in Eakins and Kouroukla (2015),
which were reported as the absorbed organ doses per fluence relative to
the average organ dose, and were themselves benchmarked against data
from ICRP Publication 116 (ICRP, 2010). The comparison showed good
agreement between the two sets of calculated results: when like-for-like
organ doses were compared, the average difference was only 0.1%, with
the individual differences between the like-for-like organ doses distrib
uted around this mean with a standard deviation of 1.5%. This cross
check indicated the correct compilation of the current model including
the mobile phone and the unmodified voxel phantom model.
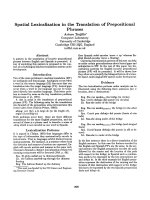
Next, the ICRP 110 adult male phantom was adapted in the simu
lation according to the exposure conditions of the Cochabamba incident
(see Fig. 2). Specifically, the legs of the phantom were removed in order
to provide a better representation of both an individual seated directly
over a source and the limbless anthropomorphic phantom used in the
CATO measurement (see Fig. 1). The environment surrounding the
phantom was also modified by inserting a simplified model of a bus seat
and a bus floor into the geometry, made of wood, PVC, aluminium and
Fig. 2. Cross-sectional views in xz- (left) and yz- (right) planes through the
ICRP Publication 110 adult male phantom used in the simulation, which was
adapted to better match a seated individual; the bus seat and its floor were also
included in the simulation. The mobile phone was fixed centrally on the front
face of the phantom at the height of its pelvis (marked in the right-hand figure).
The position of the point source relative to the phantom was adjusted in
accordance with the field experiment and is marked in both views.
Fig. 1. The anthropomorphic phantom used in the CATO experiment. The
phantom is equipped with thermoluminescence dosemeters (TLDs).
3
M. Discher et al.
Radiation Measurements 146 (2021) 106603
steel. This truncated model was used in the subsequent analysis of the
dose to an individual on the bus, and hence for the determination of the
conversion coefficient data presented later. In the real exposure, a sec
ond anthropomorphic phantom was located adjacently (Fig. 1), but this
was not included in the simulations. The calculated results will therefore
lack the small cross-scatter component to dose deposition, which would
likely most impact those on the left side of the phantom, which is the
side closest to where that second phantom would have been. Given the
overall uncertainty budgets, however, the potential effects of this were
assumed not to be noticeable during comparisons with measured data.
To test the suitability of the truncated geometry, the phantom was
exposed to Ir-192 from AP, PA, LLAT and RLAT geometries. The results
were then cross-checked against analogous data for the limbed phan
tom. The comparison showed a good agreement: there was an average
difference of 0.7%, with individual differences between like-for-like
organ doses distributed around this mean with a standard deviation of
2.2%. This demonstrates that the average organ doses are not greatly
affected by the removal of the legs, as expected given that most organs
are located deep within the body. However, the relatively small standard
deviation does not highlight the few outliers.
within 10%, whilst over half of the simulation and experiment results
are in agreement with each other to within a few 10s of %. The two
greatest discrepancies are for the lymph nodes and oral mucosa. This
might be due to their small sizes and precise locations relative to many
of the other organs, which may in turn perhaps have led to some of the
largest uncertainties; these systematic variations would not be apparent
just from the errors otherwise quoted here, which are only based on
statistics for Monte Carlo and calibrations for measurements. Otherwise,
there are no obvious strong correlations in the discrepancies between
the experimental and modelled data. This might perhaps support the
suggestion that the divergencies are caused more by inaccuracies in the
measurements than in the Monte Carlo simulation: if instead there were
a systematic fault in the geometry defined within the model, a stronger
correlation with divergence and organ location might potentially have
been expected. For example, the simulation was seen to over-estimate
the measured dose to the stomach by more than it over-estimated the
dose to the liver, even though those organs are located on the left and
right sides of the body respectively, which indicates that the lack of
cross-scatter in the model from the absent second phantom (Fig. 1) did
not significantly impact the results.
The mean of all the simulated results (i.e. all organs and phone
components) is 358 mGy, which is ~25% higher than the analogous
mean experimental result (i.e. 287 mGy). Moreover, the measured and
modelled average organ doses, DB, as defined in Eakins and Kouroukla
(2015), exhibited a similar difference, with the former 26.7% lower. If
each dataset is normalized to its mean, then two thirds of the normalized
simulated results agree with the normalized experimental results to
within ±30%. This reinforces the observation that the distributions of
doses within the measured and modelled datasets are broadly similar in
shape, excluding a few outliers. However, a systematic difference clearly
exists, with the simulated doses generally being higher than the
measured ones; in fact, none may be resolved as being smaller when
3.2. Modelled results of point source
With the modelled set-up confirmed, the truncated phantom on its
seat was exposed to the simulated Ir-192 point source. The absorbed
doses to the organs that resulted from the calculation are shown in
Fig. 3, along with the associated average organ dose and the dose to the
phone glass. Also shown in Fig. 3 are the measured results obtained from
the CATO experiment. The data are additionally summarized in the
supplement.
In general, the results matched quite well: over a quarter of the
simulation and experiment results are in agreement with each other to
Fig. 3. Simulated dose results (red circles) in comparison with the experimental data (blue squares). (For interpretation of the references to colour in this figure
legend, the reader is referred to the Web version of this article.)
4
M. Discher et al.
Radiation Measurements 146 (2021) 106603
uncertainties are taken into account. The exact cause of these discrep
ancy is not clear, but might suggest a source normalization issue, or the
effects of not including sufficient shielding or encapsulation in the
modelling. A further factor might be from missing shielding effects from
other mobile phones that were used in the experiment but were not
included in the simulation. Such systematic errors may be partially
mitigable for practical dosimetry purposes, however, as discussed later.
Nevertheless, given the many assumptions, approximations and un
certainties inherent in both the simulation and measurement campaigns,
including the ~20% standard error quoted on the measured data,
agreement in their results to within a few 10s of % may be considered a
success, especially within the context of the limited degree of accuracy
that is required for emergency dosimetry. Paraphrasing, given that
calibration exposures may still be associated with quoted uncertainties
of ~10% or so even when performed under the highly-controlled con
ditions of a metrology laboratory, anticipating agreement to within a
few 10s of percent might be the best that could be hoped for in the re
sults from irradiations performed as a field test, considering un
certainties resulting from factors such as ignorance of the precise
positions of the phones and sources, the precise compositions of the
phones and source (e.g. encapsulations), and the effects of surroundings
and scatter etc. On the other hand, the measured and modelled display
glass results agreed to 0.9%. This latter observation is arguably more
important than the discrepancies found for the separate organs: the
excellent agreement exhibited between the measured and modelled
phone doses raises significant confidence in the reliability of this method
of emergency dosimetry.
Simulated conversion factors from display glass doses to organ or
average organ doses may be calculated by normalizing the data in Fig. 3
to the absorbed dose to the phone. These factors are presented in Fig. 4
and additionally in the supplement.
It is remarked that the derivation of conversion coefficients in this
way potentially lessens the impacts of any systematic or absolute dif
ferences between modelled and measured datasets, at least for practical
retrospective dosimetry purposes. Instead, interest here is mainly in
relative relationships between one dose and another from within the
same dataset, rather than from one of those datasets to the other.
Specifically, because the process for obtaining coefficients entails
dividing one simulated dose by another simulated dose, with that ratio
then used to convert the measured doses, the existence of systematic
differences between simulated and measured datasets will have less
impact, because they may be partially cancelled when this quotient is
taken.
In general, large differences in absorbed doses were found between
mobile phone and body/organ doses, being up to a factor of more than
10 in some cases. Moreover, considerable variation across the dataset is
apparent from Fig. 4. These observations are as expected from previous
work (Eakins and Kouroukla, 2015), and are explainable by factors such
as the location of the phone on the phantom, and the differing positions
and depths of the organs within the phantom relative the point source,
leading to differing levels of attenuation and shielding as a function of
position, and hence differing dose depositions. Of course, these differ
ences lead to the requirement for conversion coefficients to be generated
and applied in order for the dosimetry system to be useful.
From the data of Fig. 4, a conversion factor of 0.22 ± 0.01 is seen to
be appropriate to convert the absorbed dose measured in the phone glass
to the concurrent average organ absorbed dose; the uncertainty quoted
reflects just the statistical uncertainty from the Monte Carlo process, and
not the systematic or other uncertainties arising from the conversion
process (Eakins and Kouroukla, 2015). Thus, it is apparent that if the
phone dose were assumed simply to equal the biological dose without
this correction applied, the dose estimate for the individual would be
over-estimated by a factor of nearly 5.
3.3. Uncertainty of the point source position
Repetitions of the simulations were carried out to investigate the
effect of the source position on the modelled results. The position of the
source was shifted ±10 cm in the x, y and z directions relative to its
primary location, where x is the left-right, y is the front-back, and z is the
vertical position of the source relative to the body (see Fig. 2). This is
relevant because although the measurements were performed under
nominally controlled conditions, the nature of the field test implied that
those conditions were known only approximately (in comparison to the
Fig. 4. Simulated conversion factors calculated by normalizing the organ and average organ data to the dose in the mobile phone.
5
Radiation Measurements 146 (2021) 106603
M. Discher et al.
‘proper’ calibration conditions typically enforced by metrology labora
tories, for example), so factors such as the precise location of the source
relative to the phantom may be known only with limited accuracy. The
perturbations of ±10 cm therefore serve to provide a handle on the
maximum plausible uncertainty from this ignorance.
For each perturbation of the source position, ratios were calculated
of each new organ dose relative to that obtained when the source was at
its original location; the average of these ratios was then calculated. The
standard deviation in the set of ratios around this mean was also
calculated, to demonstrate the magnitude of the induced divergences in
the results for the individual organs. The results from the systematic
variations of the source are shown in Table 1.
Changes of ±10 cm in the x direction did not significantly affect most
of the modelled results, due to the symmetries of most organs within the
body about its left-right axis. The most affected organ in Table 1 was the
stomach, as expected due to the asymmetric location of that organ about
the body’s centre line. However, changes in the y and z direction had a
bigger impact on the averages of the organ doses: a shift of the source
position of just ±10 cm can lead to changes of more than 20% in the
results. Moreover, relocations in the y direction also caused large vari
ations in the magnitudes of the changes to the individual organ doses, as
seen from the larger standard deviations of those two datasets. These
observations are explainable primarily by the inverse-square divergence
of the isotropic point-source, but also by additional factors such as
differing shielding contributions from different parts of the body as the
source is moved relative to it. For example, moving the source further
from the body in the negative y direction increases inverse square sep
aration from the brain, but also increases the line-of-sight solid angle
between that organ and the source. There is therefore less attenuation of
the field, and hence an enhanced dose. For the z shift, generally, organ
doses vary in the expected way with movement in the height of the
source: those organ doses closest to the source (e.g. kidneys, small in
testine) are most affected, whilst those further away (e.g. brain) are less
impacted. This is as anticipated, with a 10 cm shift representing a
greater fractional change in distance at smaller separations, and hence
proportionally greater impact from inverse square.
It is possible that the results of Table 1 might help to explain one of
the trends exhibited in the data of Fig. 3. In particular, it was observed
that almost all of the modelled organ doses were higher than their
corresponding measured doses, with an average difference of ~30%.
These systematic differences could be due to uncertainty on the precise
location of the source in the experiment: if the source in the CATO
experiment was actually positioned slightly lower than has been
assumed in the model, for example, the impact on the results could be
similar to that exhibited in Fig. 3. Uncertainties in the y and z locations
could easily generate the systematic differences between modelling and
measurement that have been observed. Note that the above explanation
might also imply that similar source location effects should be observed
between the calculated and measured doses to the glass screen. How
ever, whilst these might have occurred, they are not possible to resolve
within the uncertainties on the results: the 20% variation from the 10 cm
displacements is comparable to the 20% error bars on the TL measure
ment of the phone. Generalizing these observations, it is suggested that
when determining and then applying phone to organ dose conversion
coefficients for isotropic point sources, the precise location of the source
may be critical to the results that are obtained.
Of course, other factors will also be very important, such as the
precise location of the phone. The impacts of large differences in phone
location have been considered elsewhere (Eakins and Kouroukla, 2015),
which provided exploratory investigations of this parameter: four phone
positions about the body and seven exposure geometries were system
atically simulated and investigated, and conversion coefficient data
produced. However, the actual values of the conversion coefficients will
also be impacted by the effects of smaller differences, such as small
perturbations about those ‘reference’ conditions, for example for a
phone displaced by a few centimetres in some direction or from igno
rance of its exact location in a real exposure. Again, this emphasizes the
value of endeavours such as the CATO experiment and the current
simulations, with the measurements and modelling seen to complement
each other: a comparison of their nominally identical but practically
different set-ups leads to results that help to inform the uncertainty
budget for retrospective dosimetry in realistic and non-standard expo
sure conditions.
3.4. The effect of arms on the anthropomorphic phantom
As a final test, an additional geometry was defined in which the arms
of the phantom were removed as well as the legs, thereby providing a
better match to the anthropomorphic phantom actually used in the
CATO reconstruction experiment. This limbless phantom was then
exposed to the Ir-192 point source located at the same position as before.
The results of the simulation were then compared against the data
derived previously for the legless phantom (Fig. 3). The comparison
showed good agreement between the calculated results for the two
phantoms: the pairs of datasets exhibited an average difference of only
4.1%, with the individual differences between like-for-like organ doses
distributed around this mean with a standard deviation of 4.2%. How
ever, although like-for-like organ doses generally agreed to better than
14%, doses in the limbless phantom were consistently lower, perhaps
due to the lack of cross-scatter of photons into the target regions by the
arms. Nevertheless, this comparison demonstrates that although for
some organs the impact may be sizeable, overall the organ doses are
unlikely to have been greatly affected by the removal of the arms in the
CATO reconstruction, as expected given the position of the source below
the body. Moreover, in both cases the calculated dose absorbed by the
mobile phone was the same, leading to a phone to average organ dose
conversion factor for the limbless phantom that was only a few per cent
lower than that for the truncated phantom with arms.
Table 1
Average ratios between simulated organ doses for different locations of the point source relative to its primary position. Differences for selected organs are additionally
shown.
New position
Average ratio
Standard deviation
around mean ratio
Selected organ dose ratios to primary source location
RBM (weighted absorbed dose)
Stomach
S.Intestine
Brain
Heart
Kidneys
Lungs
Skin
x minus 10 cm
x plus 10 cm
y minus 10 cm
y plus 10 cm
z minus 10 cm
z plus 10 cm
1.00
0.99
1.16
0.81
0.82
1.24
0.04
0.05
0.23
0.12
0.03
0.04
1.00
1.00
1.09
0.91
0.82
1.26
0.94
1.01
1.08
0.82
0.81
1.21
1.00
0.99
1.10
0.78
0.79
1.27
1.02
1.00
1.35
0.64
0.84
1.22
0.98
1.05
1.18
0.78
0.82
1.23
0.98
0.97
1.21
0.73
0.77
1.29
0.96
1.05
1.19
0.76
0.83
1.21
1.01
0.97
0.98
0.99
0.84
1.21
6
M. Discher et al.
Radiation Measurements 146 (2021) 106603
4. Summary and conclusions
Acknowledgements
Monte Carlo modelling has been performed to simulate the CATO
exercise, which recreated the exposure of individuals on a bus to an Ir192 point source. The modelling allowed a comparison and check of the
measured data, and an investigation into the dose conversion co
efficients that are required to use fortuitous dosemeters as indicators of
absorbed doses to individuals. Moreover, the modelling allowed some of
the parameters of the experiment to be varied, and their impacts
explored. For example, the results were found (Table 1) to depend on the
position of the point source relative to the individual: even small re
locations (±10 cm) of the Ir-192 led to significant variations in the
doses. This observation is important, because it implies that the precise
location of the point source will be critical to the values of any phone to
organ dose conversion coefficients that are calculated. In general,
however, measured and modelled data agreed acceptably (Fig. 3), with
similar average doses and similar variations in the results as a function of
organ type.
One potential limitation of the anthropomorphic phantom used in
the CATO exercise was the absence of limbs. In response to this, the
Monte Carlo model was used to investigate the impact of the limbs on
the resulting organ doses. The cross-scatter of photons by the limbs was
seen to contribute small but significant components of absorbed dose to
the visceral organs, which will be absent in the CATO measurements and
hence impact upon the results reported from it (Rojas-Palma et al.,
2020).
In principle, the conversion factor data shown in Fig. 4 could be used
to translate the absorbed dose in the mobile phone into the individual
organ doses and/or associated average organ dose for the simulated
exposure scenario. In this case, a factor of 0.22 ± 0.01 should be applied
to the measured dose to reconstruct the whole body dose to the indi
vidual. Indeed, this conversion process is vital in retrospective dosimetry
in order for the measured physical dose to be related to the biological
dose, as required for medical triage.
During a real radiological emergency, the choice of conversion co
efficient to apply would be specific to the precise exposure conditions
that exist for each individual, also taking into account other factors such
as the location of the phone relative to them. Ideally, then, the optimum
approach under such circumstances would be to repeat the type of
process described in this paper, with realistic models created that
faithfully replicate the specific geometries of interest and that can be run
to generate bespoke conversion data on a case-by-case basis. In practice,
however, such an approach would be feasible only in a very small-scale
incident, in which only very few individuals were exposed. Moreover,
even then the results would likely only find application in subsequent
‘forensic’ analyses, with a lack of available resources and complexity in
producing the data inevitably preventing their generation in time for
earlier triage purposes (Eakins and Ainsbury, 2018a, 2018b). In a larger
scale event, therefore, generic conversion data would need to be applied,
which are less accurate but may be pre-calculated and tabulated in
advance. This need reinforces the usefulness of studies such as the cur
rent one in contributing to understanding of overall uncertainty budgets,
which are shown to be relatively large (~few 10s of percent) even when
the geometry is comparatively well-known and the exposure
well-controlled. A larger study into generic versus bespoke conversion
coefficient data, and their impact on dose uncertainty within a practical
exposure scenario (Waldner et al., 2021), is currently an active area of
research within EURADOS WG10.
The authors want to thank Jan Jansen (PHE) for providing the voxel
phantom code in MCNPX format, and J´er´emie Dabin (SCK-CEN) for
providing the experimental results (TL dosemeters) of the anthropo
morphic phantom in the CATO field experiment. The visit of Michael
Discher to Public Health England was gratefully supported by the
EURADOS e.V. Research Grant (2014).
Appendix A. Supplementary data
Supplementary data to this article can be found online at https://doi.
org/10.1016/j.radmeas.2021.106603.
References
Ainsbury, E.A., et al., 2011. Review of retrospective dosimetry techniques for external
ionising radiation exposures. Radiat. Protect. Dosim. 147, 573–592.
Bassinet, C., et al., 2014. Retrospective radiation dosimetry using OSL of electronic
components: results of an inter-laboratory comparison. Radiat. Meas. 71, 475–479.
Beerten, K., Woda, C., Vanhavere, F., 2009. Thermoluminescence dosimetry of electronic
components from personal objects. Radiat. Meas. 44, 620–625.
Browne, E., 2003. NM - CEA/LNHB - table de Radionucl´
eides, laboratoire national henri
becquerel. Available from: />ables.pdf. (Accessed 28 September 2019).
Cristy, M., Eckerman, K.F., 1987. Specific Absorbed Fractions of Energy at Various Ages
from Internal Photon Sources. ORNL Report: ORNL/TM-8381/vol. 1.
Discher, M., Woda, C., 2013. Thermoluminescence of glass display from mobile phones
for retrospective and accident dosimetry. Radiat. Meas. 53–54, 12–21.
Discher, M., Hiller, M., Woda, C., 2015. MCNP simulations of a glass display used in a
mobile phone as an accident dosimeter. Radiat. Meas. 75, 21–28.
Discher, M., Woda, C., Ekendahl, D., Rojas-Palma, C., Steinhă
ausler, F., 2021. Evaluation
of physical retrospective dosimetry methods in a realistic accident scenario: results
of the CATO field test. Radiat. Meas. 142, 106544.
Eakins, J.S., Kouroukla, E., 2015. Luminescence-based retrospective dosimetry using
Al2O3 from mobile phones: a simulation approach to determine the effects of
position. J. Radiol. Prot. 35, 343–381.
Eakins, J.S., Ainsbury, E.A., 2018a. Quantities for assessing high doses to the body: a
short review of the current status. J. Radiol. Prot. 38, 731–742.
Eakins, J.S., Ainsbury, E.A., 2018b. Quantities for assessing high photon doses to the
body: a calculational approach. J. Radiol. Prot. 38, 743–762.
Ekendhal, D., Judas, L., 2012. Retrospective dosimetry with alumina substrate from
electronic components. Radiat. Protect. Dosim. 150, 134–141.
Fattibene, P., et al., 2014. EPR dosimetry intercomparison using smart phone touch
screen glass. Radiat. Environ. Biophys. 53, 311–320.
IAEA - International Atomic Energy Agency, 2004. The Radiological Accident in
Cochabamba, ISBN 92-0-107604-5. Vienna.
ICRP - International Commission on Radiological Protection, 2007. The 2007
recommendations of the International Commission on radiological protection. ICRP
Publication 103 ann. ICRP 37 (2–4).
ICRP - International Commission on Radiological Protection, 2009. Adult reference
computational phantoms. ICRP Publication 110. Ann. ICRP 39 (2), 1–165.
ICRP - International Commission on Radiological Protection, 2010. Conversion
coefficients for radiological protection quantities for external radiation exposures.
ICRP (Int. Comm. Radiol. Prot.) Publ. 116.
ICRU - International Commission on Radiation Units and Measurements, 1994. Stopping
Powers for electrons and positions. ICRU (Int. Comm. Radiat. Units Meas.) Rep. 37.
Inrig, E.L., Godfrey-Smith, D.I., Khanna, S., 2008. Optically stimulated luminescence of
electronic components for forensic, retrospective and accident dosimetry. Radiat.
Meas. 44, 726–730.
Jansen, J.T.M., Shrimpton, C., 2011. Calculation of normalised organ and effective doses
to adult reference computational phantoms from contemporary computed
tomography scanners. Prog. Nucl. Sci. Technol. 2, 165–171.
Kim, M.C., Kim, H., Han, H., Lee, J., Lee, S.K., Chang, I., Kim, J.-L., Kim, C.H., 2019.
A study on dose conversion from a material to human body using mesh phantom for
retrospective dosimetry. Radiat. Meas. 126, 106126.
King, S.D., Spiers, F.W., 1985. Photoelectron enhancement of the absorbed dose from Xrays to human bone marrow: experimental and theoretical studies. Br. J. Radiol. 58,
345–356.
Kouroukla, E., 2015. Luminescence Dosimetry with Ceramic Materials for Application to
Radiological Emergencies and Other Incidents. Doctoral thesis. Durham University.
Pascu, A., Vasiliniuc, S., Zeciu-Dolha, M., Timar-Gabor, A., 2013. The potential of
luminescence signals from electronic components for accident dosimetry. Radiat.
Meas. 56, 384–388.
Rojas-Palma, C., Woda, C., Discher, M., Steinhă
ausler, F., 2020. On the use of
retrospective dosimetry to assist in the radiological triage of mass casualties exposed
to ionizing radiation. J. Radiol. Prot. 40, 1286–1298.
Shultis, J.K., Faw, R.E., 2011. An MCNP primer. Available from: leonica.
net/wiki/images/6/6b/MCNPprimer.pdf. (Accessed 10 September 2016).
Van Hoey, O., Ră
omkens, D., Eakins, J., Kouroukla, E., Discher, M., Vanhavere, F., 2021.
Uncertainty evaluation for organ dose assessment with optically stimulated
Declaration of competing interest
The authors declare that they have no known competing financial
interests or personal relationships that could have appeared to influence
the work reported in this paper.
7
M. Discher et al.
Radiation Measurements 146 (2021) 106603
luminescence measurements on mobile phone resistors after a radiological incident.
Radiat. Meas. 141, 106520.
Waldner, L., Bernhardsson, C., Woda, C., Trompier, F., Van Hoey, O., Kulka, U.,
ăf, C., Discher, M., Endesfelder, D., Eakins, J.,
Oestreicher, U., Bassinet, C., Ră
aa
Gregoire, E., Wojcik, A., Ristic, Y., Kim, H., Lee, J., Yu, H., Kim, M.C., Abend, M.,
Ainsbury, E., 2021. The 2019-2020 EURADOS WG10 and RENEB field test of
retrospective dosimetry methods in a small-scale incident involving ionizing
radiation. Radiat. Res. 195 (3), 253–264. />X-5 Monte Carlo Team, 2003. MCNP: A General Monte Carlo N-Particle Transport Code,
Version 5, Vol. II. User’s Guide, Los Alamos National Laboratory Report LACP-030245.
8