Consistency checks of results from a Monte Carlo code intercomparison for emitted electron spectra and energy deposition around a single gold nanoparticle irradiated by X-rays
Bạn đang xem bản rút gọn của tài liệu. Xem và tải ngay bản đầy đủ của tài liệu tại đây (6.21 MB, 9 trang )
Radiation Measurements 147 (2021) 106637
Contents lists available at ScienceDirect
Radiation Measurements
journal homepage: www.elsevier.com/locate/radmeas
Consistency checks of results from a Monte Carlo code intercomparison for
emitted electron spectra and energy deposition around a single gold
nanoparticle irradiated by X-rays
H. Rabus a, j, *, W.B. Li b, j, H. Nettelbeck a, j, J. Schuemann d, j, C. Villagrasa c, j, M. Beuve e, j,
S. Di Maria f, j, B. Heide g, j, A.P. Klapproth b, h, F. Poignant e, 1, R. Qiu i, j, B. Rudek d, 2
a
Physikalisch-Technische Bundesanstalt, Braunschweig and Berlin, Germany
Institute of Radiation Medicine, Helmholtz Zentrum München - German Research Center for Environmental Health, Neuherberg, Germany
c
Institut de Radioprotection et de Sûret´e Nucl´eaire, Fontenay-Aux-Roses, France
d
Massachusetts General Hospital & Harvard Medical School, Department of Radiation Oncology, Boston, MA, USA
e
Institut de Physique des 2 Infinis, Universit´e Claude Bernard Lyon 1, Villeurbanne, France
f
Centro de Ciˆencias e Tecnologias Nucleares, Instituto Superior T´ecnico, Universidade de Lisboa, Bobadela LRS, Portugal
g
Karlsruhe Institute of Technology, Karlsruhe, Germany
h
TranslaTUM, Klinikum rechts der Isar, Technische Universită
at München, Munich, Germany
i
Department of Engineering Physics, Tsinghua University, Beijing, China
j
European Radiation Dosimetry Group (EURADOS) e.V., Neuherberg, Germany
b
A R T I C L E I N F O
A B S T R A C T
Keywords:
Gold nanoparticles
Dose enhancement
X-rays
Targeted radiotherapy
Organized by the European Radiation Dosimetry Group (EURADOS), a Monte Carlo code intercomparison ex
ercise was conducted where participants simulated the emitted electron spectra and energy deposition around a
single gold nanoparticle (GNP) irradiated by X-rays. In the exercise, the participants scored energy imparted in
concentric spherical shells around a spherical volume filled with gold or water as well as the spectral distribution
of electrons leaving the GNP. Initially, only the ratio of energy deposition with and without GNP was to be
reported. During the evaluation of the exercise, however, the data for energy deposition in the presence and
absence of the GNP were also requested. A GNP size of 50 nm and 100 nm diameter was considered as well as two
different X-ray spectra (50 kVp and 100 kVp). This introduced a redundancy that can be used to cross-validate
the internal consistency of the simulation results. In this work, evaluation of the reported results is presented in
terms of integral quantities that can be benchmarked against values obtained from physical properties of the
radiation spectra and materials involved. The impact of different interaction cross-section datasets and their
implementation in the different Monte Carlo codes is also discussed.
1. Introduction
Gold nanoparticles (GNPs) have been shown to enhance the biolog
ical effectiveness of ionizing radiation in-vitro and in-vivo (Hainfeld
et al., 2004; Her et al., 2017; Cui et al., 2017; Kuncic and Lacombe,
2018; Bromma et al., 2020). This effect is often attributed to a dose
enhancement due to the higher absorption of radiation by the high-Z
material gold as compared to other elemental components of tissue.
For example, the ratio of the mass-energy absorption coefficients of gold
and soft tissue is between 10 and 150 for photons in the energy range
between 5 keV and 200 keV (Butterworth et al., 2012). Due to Auger
cascades following the creation of inner shell holes, a larger number of
low-energy secondary electrons may lead to additional energy deposi
tion in the vicinity of a GNP (McMahon et al., 2011). This results in an
additional local enhancement of absorbed dose around a GNP, compared
to the case when the GNP volume is filled with water. Since this local
dose enhancement is limited to microscopic dimensions, Monte Carlo
(MC) simulations are needed to determine its value.
* Corresponding author. Physikalisch-Technische Bundesanstalt, Braunschweig and Berlin, Germany.
E-mail address: (H. Rabus).
1
Present address: National Institute of Aerospace, Hampton, VA, USA.
2
Present address: Perlmutter Cancer Center, NYU Langone Health, New York City, NY, USA.
/>Received 12 May 2021; Received in revised form 29 June 2021; Accepted 19 July 2021
Available online 30 July 2021
1350-4487/© 2021 The Authors. Published by Elsevier Ltd. This is an open access article under the CC BY license ( />
H. Rabus et al.
Radiation Measurements 147 (2021) 106637
Prompted by the large variety of results reported in literature
regarding this dose enhancement (Mesbahi, 2010; Vlastou et al., 2020;
Moradi et al., 2021), a code intercomparison exercise was organized as a
joint activity of the Working Groups 6 “Computational Dosimetry”
(Rabus et al., 2021a) and 7 “Internal Dosimetry” (Breustedt et al., 2018)
of the European Radiation Dosimetry Group (Rühm et al., 2018, 2020).
The exercise was an intercomparison of Monte Carlo simulations for the
electron spectra emitted and the dose enhancement around a single GNP
in water subject to X-ray irradiation. Two sizes (50 nm and 100 nm
diameter) of spherical GNPs were irradiated by two different X-ray
spectra (50 kVp and 100 kVp, for details see (Li et al., 2020a)).
To emphasize the impact of differences between codes with respect
to electron transport simulation and associated electron interaction
cross sections, an artificial simple irradiation geometry was used: A
parallel beam of photons emitted perpendicularly from a circular source
area in the direction of the GNP. The diameter of the source was 10 nm
larger than the GNP diameter, and it was located at 100 μm distance
from the GNP center.
Participants in the exercise were to implement this geometry and the
given photon energy spectra into their simulation and then report the
following results for each combination of GNP size and X-ray spectrum:
(a) the spectral distribution of electrons emitted from the GNP per pri
mary photon emitted from the source, (b) the dose enhancement ratio
(DER) in spherical shells around the GNP, i.e. the ratio of the energy
deposited per primary photon in the presence and absence of the GNP.
At a later stage of the exercise evaluation, participants were asked to
report the energy deposition per primary photon for the simulations
with and without the GNP.
The spherical shells used for scoring energy deposition had a thick
ness (difference between outer and inner radius) of 10 nm up to an outer
radius equal to rg + 1 μm, where rg is the GNP radius. Beyond this dis
tance, 1 μm increments were used up to an outer radius of rg + 50 μm.
First results from the exercise have been reported by Li et al. (2020a,
2020b) and the relation of the DER values with those relevant for real
istic irradiation scenarios with extended photon beams have been dis
cussed by Rabus et al. (2019, 2021b). This work focusses on the
methodology used in the assessment of the reported results for consis
tency between the different cases (GNP sizes, X-ray spectra) and for
consistency with the principle of energy conservation. These consistency
checks allowed cases of improper implementation of the exercise to be
detected. The influence of electron transport in the various MC codes is
also discussed.
∑[
]
(1)
εg (ri ) − εw (ri )
ΔEg,w =
i
where εg (ri ) and εw (ri ) are the average imparted energies (Booz et al.,
1983) per primary photon in the i-th radial shell (with outer radius ri )
obtained in the simulations with and without the GNP, respectively.
∑
( )
Ee =
Tj × NE(e) Tj × ΔTj
(2)
j
In eq. (2), Tj and ΔTj are the center and the width of the j-th energy
bin of the electron spectra. NE is the distribution of particle number
with respect to energy (Seltzer et al., 2011) of electrons leaving the GNP
(i.e. number of electrons per energy interval, hereafter called spectral
frequency).
From energy conservation, if all deposited energy is scored (i.e. for
infinitely large outer radius of the scoring region), then ΔEg,w should be
almost the same as Ee. The ratio ΔEg,w/Ee should be slightly smaller than
unity since the spectrum of emitted electrons also includes those pro
duced outside the GNP that subsequently traverse it. Furthermore,
emitted electrons can be backscattered into the GNP where they sub
sequently deposit part of their energy.
(e)
2.2. Criteria for consistency between the data for different GNP sizes and
photon energy spectra
The criteria outlined in the preceding section can be used to check
the consistency between the electron spectra and energy deposition re
sults for each combination of GNP size and photon spectrum. Consis
tency between results for different combinations of GNP size and photon
spectrum can subsequently be achieved by using a different normali
zation of the results.
In the exercise, normalization was requested per primary photon.
However, only a small fraction of the primary photons interacts in the
GNP. The emitted electrons and extra energy deposition scored in the
simulations is mainly due to cases where a photon interaction in the GNP
occurs.
The expected number ng of photon interactions in the GNP is
approximately given by eq. (3).
∫
4π 3
ng =
μg (E)Φ(p) (E)e− μw (E)ds dE
(3)
rg
3
2. Materials and methods
and depends on the GNP size and photon energy spectrum.
In eq. (3), μg (E) and μw (E) are the total linear attenuation co
efficients of gold and water (Berger et al., 2010), respectively. E is the
photon energy, rg is the GNP radius, and ds is the distance of the GNP
center from the photon source.
Φ(p) (E) is the spectral fluence (particles per area and energy interval)
of primary photons emitted from the source, which fulfills the normal
ization condition
∫
1
Φ(p) (E)dE = 2
(4)
rb π
2.1. Criterion for consistency between integrals of the emitted electron
spectra and deposited energy
The results from the two subtasks of the exercise, i.e. energy
deposited around and emitted electron spectra from the GNP are com
plementary, as the extra energy deposited in the presence of the GNP is
mainly imparted by interactions of electrons emitted from the GNP. For
a quantitative comparison, this extra energy deposition around the GNP
can be approximated by the difference between the energies imparted in
the presence and absence of the GNP.
The first plausibility check was whether the difference of the re
ported energy deposition with and without the presence of the GNP (in
spherical shells around the GNP) was compatible with the energy
spectra of electrons emitted from the GNP.
To test this, one needs to consider (a) the total additional energy ΔEg,
w deposited in the presence of the GNP in the total scoring volume (i.e. a
spherical shell of inner radius rg and outer radius rg+50 μm) per photon
interaction and (b) the total energy Ee transported out of the GNP by
electrons. These two quantities were calculated from eqs. (1) and (2).
where rb is the radius of the circular photon source used in the
Table 1
Mean number of photon interactions in a GNP (ng ) for the two GNP diameters
and X-ray radiation qualities used in the exercise. The values apply to the flu
ences used for normalization of the results in the exercise (Li et al., 2020a). (1
photon per area of the photon source, i.e. per 2.8 × 10³ nm2 and 9.5 × 10³ nm2
for the 50 nm and 100 nm-diameter GNPs, respectively.)
50 kVp
50 nm GNP
100 nm GNP
2
100 kVp
− 3
1.1 × 10
2.6 × 10−
3
5.4 × 10−
1.3 × 10−
4
3
H. Rabus et al.
Radiation Measurements 147 (2021) 106637
simulations. The values of ng for the primary fluences used in the exer
cise are shown in Table 1.
Normalizing the quantities ΔEg,w and Ee by ng
*
ΔEg,w
=
ΔEg,w
ng
Ee* =
Ee
ng
photon source.
The deposited energy Edep,w(R) for R = rj, where rj is the outer radius
of the j-th spherical shell in the simulations, is approximately given by
j
(
) ∑
Edep,w R = rj =
εw (ri )
(5)
With increasing R, the condition of longitudinal secondary electron
equilibrium (i.e. along the direction of the primary photon beam) will be
fulfilled, such that the ratio Edep,w(R)/Etr,w(R) should converge with
increasing R to a value close to unity. The asymptotic value will not be
unity as the simulation results also include energy deposited by electrons
produced in interactions of photons that have been previously scattered
out of the photon beam as well as any descendant photons. This effect
leads to the value of Edep,w(R) being larger than Etr,w(R).
As the volume corresponding to the GNP was not used for scoring in
the simulations, the value obtained by eq. (9) slightly underestimates
the true value of Ed,w(R). However, as this volume is less that 10− 9 of the
total volume, this can be considered negligible. Similarly, the fact that a
sphere is used for scoring rather than a plane parallel slab will also lead
to a slight reduction of Edep,w that should depend on the value of R. In
fact, the deviation of the ratio Edep,w(R)/Etr,w(R) from the saturation
value followed an approximate 1/R dependence for R ≥ 30 μm, such that
the saturation value could be determined by linear regression of the
ratio as a function of 1/R.
approximately gives the total energy ΔEg,w* deposited around a GNP in
which a photon interaction occurred, and the total energy Ee* trans
ported out of such a GNP by electrons.
The resulting second plausibility check was to test whether these two
quantities were compatible with the average energy Etr,g transferred to
electrons when a photon interacts with a gold atom. Etr,g depends on the
photon energy spectrum and was calculated according to eq. (6).
∫
Eμtr,g (E)Φ(p) (E)e− μw (E)ds dE
Etr,g = ∫
(6)
μg (E)Φ(p) (E)e− μw (E)ds dE
In eq. (6), E is the photon energy, μtr,g, is the energy transfer coeffi
cient of gold, Φ(p) is the particle fluence of primary photons emitted from
the X-ray source, and ds is the distance of the GNP center from the
photon source. For evaluation of Etr,g, μtr,g was approximated by the
energy absorption coefficient μen,g taken from Hubbell and Seltzer
(2004). Strictly speaking, eq. (6) therefore gives a lower bound to the
energy transferred to electrons, as they will lose some of their energy by
bremsstrahlung collisions.
As the electrons released in photon interactions with gold atoms lose
part of their energy within the GNP before leaving it, the ratios ΔEg,w*/
Etr,g and Ee ∗ /Etr,g must be less than unity. Furthermore, the ratio should
be smaller for the 100 nm GNP than for the 50 nm GNP (for the same
photon spectrum), as the average path travelled by electrons before
leaving the GNP is less for the smaller GNP.
For the same GNP size, the ratio for the 100 kVp spectrum should be
smaller than for the 50 kVp spectrum, since the electrons produced by
photo-absorption in the L, M, and outer shells as well as by Compton
scattering have higher energies. The 100 kVp photon spectrum also
contains photon energies where K shell absorption is possible. The
fraction of such photons is, however, small and the photo-absorption
coefficient around the K shell of gold is lower than in the photon en
ergy range below 50 keV, where the majority of photons in the spectrum
appear (Berger et al., 2010).
2.4. Final results of the exercise
For the sets of results where the consistency tests indicated specific
normalization issues, the respective participants were requested to
check and confirm whether their simulations were compromised by the
respective problem. Examples include improper implementation of the
simulation geometry, such as using a source where the radius was larger
than the GNP radius by 10 nm rather than the source diameter being 10
nm larger than the GNP diameter. If the participant confirmed that the
simulations were biased as suggested by the outcomes of the consistency
checks, the results were corrected accordingly.
As the energy binning of the electron spectra was not specified in the
exercise definition, participants reported the spectra in different linear
binning with bin widths ranging between 5 eV and 100 eV. Two par
ticipants used logarithmic binning with 100 intervals per decade.
Consequently, the comparison of the spectra as reported by the partic
ipants in Fig. 7 of (Li et al., 2020a, 2020b) was compromised by the
statistical fluctuations of the spectra reported with narrow energy bins.
All electron spectra reported with linear binning were therefore
resampled such that a bin size of 100 eV was used up electron energies of
10 keV and a bin size of 500 eV beyond. As all linear bin widths were
factors of 100 eV, a grouping of adjacent bins was possible. In addition,
the distribution with respect to energy of the radiant energy (Seltzer
et al., 2011) transported by the electrons (hereafter called spectral
radiant energy) was also determined by calculating the ratio of the in
tegral kinetic energy within each of the new kinetic energy bins to the
width of the energy bin. The electron spectra reported in logarithmic
binning have not been changed. The spectral radiant energy was
determined in this case by multiplying the frequency per bin width by
the arithmetic mean of the bin boundaries.
2.3. Criterion for correct normalization
A third plausibility check was based on the ratio of the total energy
Edep,w(R) deposited in a water sphere of radius R in the absence of GNPs
to the average energy Etr,w(R) transferred by photon interactions in
water (in the section of the sphere traversed by the primary photon
beam). The latter is given by
2
Etr,w (R) = D(p)
w ρw rb π × 2R
(9)
i=1
(7)
where the volume traversed by the beam is approximated by a cylin
drical volume, ρw is the density of water, rb is the radius of the photon
beam, and Dw is the average collision kerma. Owing to the small
attenuation of the photon beam over the microscopic dimensions of the
geometry, the mean collision kerma can be approximated by its value at
the location of the GNP, which is calculated with eq. (8) using a primary
photon spectral fluence Φ(p) that satisfies eq. (4).
∫
μen,w (E)
D(p)
=
E×
× Φ(p) (E)e− μw ds dE
(8)
w
(p)
2.5. Participant identification and codes used
In this article, the participants of the exercise are identified by a
letter (first letter in the name of the code used) and a number (if several
participants used codes starting with the same letter). The rationale is
that the discrepancies found in the evaluation of the exercise results
cannot be attributed to the codes used but rather originate in most cases
from incorrect implementation of the exercise definition in the simula
tions. To facilitate comparison with the reports of the preliminary results
ρw
In eq. (8), E is the photon energy, μen,w (E)/ρw is the mass energy
absorption coefficient of water, Φ(p) (E) is the spectral fluence of primary
photons emitted from the source, μw (E) is the total linear attenuation
coefficient of water and ds is the distance of the GNP’s center from the
3
H. Rabus et al.
Radiation Measurements 147 (2021) 106637
of the exercise in Li et al. (2020a, 2020b), a brief summary of the
meaning of these labels is given below.
Participants G1, G2, and G3 all used GEANT4 with its low energy
extensions and the track structure capabilities of GEANT4-DNA (Incerti
et al., 2010, 2018; Bernal et al., 2015) for simulating particle transport
in water. Participants G1 and G3 used version 10.4.2, participant G2
version 10.0.5. The respective labels used in Li et al. (2020a, 2020b)
were G4/DNA#1, G4/DNA#2, and G4/DNA#3.
Participant M1 used the 2013 release of MCNP6 (Goorley et al.,
2012) version 6.1, participant M2 used MDM (Gervais et al., 2006),
participant N used NASIC (Li et al., 2015) version 2018 and participant
P1 used PARTRAC (Friedland et al., 2011) version 2015. In the work
from Li et al. (2020a, 2020b), these participants were identified by the
respective code names.
Participants P2 and P3, who both used PENELOPE (Salvat et al.,
2011; Salvat, 2015), were identified as PENELOPE#1 and
PENELOPE#2. Participant P2 originally used version 2011 for the sim
ulations, while updated results were produced with the 2018 release.
Participant P3, on the other hand, used the 2014 release of PENELOPE.
Participant T, who used TOPAS-nBio version 1.0-beta with TOPAS
version 3.1p3 (Schuemann et al., 2019), was identified as TOPAS.
3. Results and discussion
3.1. Integrals of radial energy deposition around a GNP and energy
spectra of ejected electrons
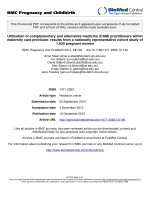
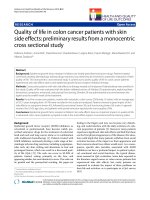
Fig. 1 shows a summary of all results reported by participants that
have been evaluated in terms of the ratio Ee*/Etr,g (ratio of the average
energy transported by electrons leaving a GNP per photon interaction in
the GNP to the mean energy released by a photon interaction in gold).
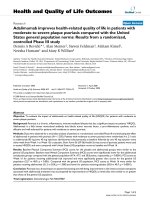
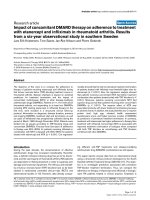
The corresponding outcome of the evaluation in terms of ΔEg,w*/Etr,g
(ratio of the excess energy imparted around a GNP in which a photon
interacts to the mean energy released by a photon interaction in gold) is
shown in Fig. 2.
Preliminary results are indicated by superscripts on the participant
identifier and have been withdrawn (&,#) or replaced by data obtained
by correcting the normalization to the requested primary photon fluence
(of one photon per source area). Participant G2 withdrew the electron
spectrum results for the 100 nm GNP irradiated by the 50 kVp photon
spectrum (for lack of explanation in failing the consistency checks) and
provided new simulation results for the case of a 50 nm GNP and 50 kVp
spectrum.
Participants P2 and P3 withdrew their results after realizing that in
their simulations, the cumulative distribution had been mistakenly used
for the probability distribution of the photon spectrum. Participant P2
repeated the simulations with the correct photon spectrum and, thus,
provided revised solutions (Li et al., 2020b). Owing to limitations of the
code used, the simulations had to be performed for a square-shaped
photon source, but the respective fluence correction was applied to
obtain the final results shown in Fig. 1 (and also in Fig. 2).
The ensembles of results shown in Figs. 1 and 2 are different for
several reasons: First, participant G2 only submitted results for electron
spectra but not for energy deposition, while participant P3 only reported
energy deposition but not electron spectra. Second, participant M1 used
the wrong tally for scoring electrons leaving the GNP, but the correct one
for scoring energy deposition so that these latter data were not updated.
Third, at the time of the first report on the exercise (Li et al., 2020a) the
bias of the results of participant M2 was only noticed for the electron
spectra, since only the ratio of energy deposition with and without the
GNP was requested. As the integral energy deposition in the absence of
the GNP is insensitive to the chosen beam diameter (as long as it is small
Fig. 1. Ratio of the total energy transported by electrons leaving a GNP that
experienced a photon interaction to the mean energy transferred to electrons
when a photon interacts in gold. The grey shaded area indicates the expected
range for this ratio. The superscripts next to the participant identifiers indicate
results where deviations from the exercise definition were revealed by the
consistency checks and have been confirmed: § variation in simulation geometry
(final results have been corrected); # variation in photon energy spectrum
(results withdrawn); * variation in the normalization to primary particle fluence
(final results have been corrected). The other superscripts indicate results that:
%
were obtained by using an incorrect tally for the angular range (and could be
approximately corrected using a constant scaling factor); ^ were multiplied with
incorrect factors to correct for particle fluence; & failed the consistency checks
for unknown reasons and have been withdrawn; $ have been tentatively cor
rected for a suspected variation in simulation geometry (not confirmed by the
participant).
Fig. 2. Ratio of the total excess energy deposited around a GNP undergoing a
photon interaction to the mean energy transfer to electrons when a photon
interacts in gold. The grey shaded area indicates the expected range for this
ratio. See Fig. 1 for the meaning of the superscripts.
4
H. Rabus et al.
Radiation Measurements 147 (2021) 106637
particle per cm2 instead of per source area (Li et al., 2020b). Addition
ally, the code used by participant M2 only scored energy deposition by
ionizations and electronic excitations, which account for about 82% of
the total imparted energy (Gervais et al., 2006). The data of participant
M2 shown in Figs. 2 and 3 have been corrected accordingly.
The final data for M2 in Fig. 1 are based on electron spectra that
deviate slightly from those shown in (Li et al., 2020b). This is due to
inconsistencies in the data extraction from the results of participant M2
for the figures in (Li et al., 2020a). The results calculated from the
correct data of participant M2 for emitted electrons, however, show a
variation with photon spectrum and GNP size (Fig. 1) that disagrees with
expected values (section 2.2): For the 50 kVp spectrum, the ratio Ee*/Etr,
g increases with GNP size, where for both GNP sizes this ratio is smaller
than ΔEg,w*/Etr,g. Furthermore, the data of participant M2 shown in
Fig. 3 are about 20% higher than the values that would be expected from
the fact that this participant did not simulate photon transport. Since
only electrons produced by photon interactions in the volume traversed
by the primary photon beam were simulated, the data shown in Fig. 3
should be smaller than unity. This suggests further potential issues with
the simulations of participant M2.
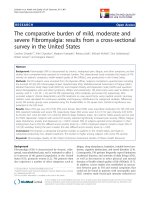
The results of the consistency checks also reveal a problem with the
energy deposition results of participant P1: The values for energy
deposition in the absence of the GNP are consistently a factor of about
0.8 too low (Fig. 3). This factor seems to be responsible for the sys
tematic deviation of the DER values of participant P1 at large radial
distances (50 μm) from the GNP shown in (Li et al., 2020a, 2020b). This
deviation is approximately equal to the percentage of energy deposited
in ionizations and electronic excitations.
However, this factor cannot be explained by such a partial scoring of
deposited energy, since the ratio ΔEg,w*/Etr,g in Fig. 2 is about 1.2 for the
50 nm GNP and about 1 for the 100 nm GNP. The participant could not
find an explanation for these observations.
For participants P2 and P3 a larger discrepancy can be seen for the
initially reported results indicated by a hashtag superscript in Fig. 3 as
well as in Figs. 1 and 2. The origin of these discrepancies was the use of a
different photon energy spectrum (Li et al., 2020b).
compared to the cross-section of the scoring volume), fewer results are
shown in Fig. 3 compared to Figs. 1 and 2.
For all participants, the final results are those without superscript.
With the exception of participants G2 and G3, these final results are all
within the range expected from the principle of energy conservation that
requires the values shown in Fig. 1 to be slightly smaller than unity, as a
part of the energy transferred to electrons is absorbed in the GNP when a
photon interacts there. This energy loss should be larger in the larger
GNP and smaller for the higher-energetic X-ray spectrum. This expected
behavior is observed for all results that fall in the expected range
(indicated by the grey shaded area) with the exception of the results for
participant M2. The reason for this exception could not be identified.
The expected range was estimated based on the results reported by
Koger and Kirkby (2016) and the uncertainties of the photon interaction
coefficients (Andreo et al., 2012).
For participant G3, whose results failed the consistency checks,
tentative results (G3$) are shown in Figs. 1 and 2 that would be obtained
if (a) the reported data originated from simulations with a photon beam
of equal diameter as the GNP and (b) the electron spectra from the 50
kVp X-ray spectrum are multiplied by a factor of 2 (as suggested by a
comparison of the data for G3 in Figs. 1 and 2.)
As can be seen in both figures, these hypothetical corrections would
make the results of participant G3 congruent with those of the other
participants. However, as the participant could not confirm the sus
pected problems with the simulations, the reasons for the deviations
remain unclear.
For the results of participant M2 in Fig. 1, a deviation of almost eight
orders of magnitude from the results of other participants had been
noticed in an early stage of the exercise and a potential reason and
ensuing correction was suggested by the participant. Participant M2 did
not simulate photon transport, but rather sampled from a uniformly
distributed electron source (of energy distribution corresponding to the
photon spectrum). The proposed correction was intended to correct the
number of primary photons considered in the simulations. The data
labelled as M2^ corresponds to the application of this proposed correc
tion, which does not represent the data for M2 presented in (Li et al.,
2020a) as such a correction was not correctly applied at that stage.
This bias of eight orders of magnitude also existed in the original
results of M2 for energy deposition (see Figs. 2 and 3), but was not
evident in the early stage of the exercise as only the DER was considered.
The reason for this discrepancy was the use of a photon fluence of one
3.2. Internal consistency of simulation results
The energy transported by the electrons leaving the GNP and the
additional energy deposited around it could also have been compared
for each combination of photon spectrum and GNP size without prior
normalization to the photon event frequency and without comparison
with the expected energy transferred in a photon interaction.
This would have revealed inconsistencies between the simulations
for energy deposition and for electron spectra such as observed for the
50 kVp results of participant G3.
Detecting deviations from the defined geometry, however, requires
at least a normalization to the GNP volume or the expected number of
photon interactions in a GNP (eq. (3)). This is illustrated in Fig. 4 for the
results of participant T, for which a comparison of Figs. 1 and 2 suggests
consistency between the setups for electron spectra and energy deposi
tion simulations. However, in both figures it can be seen that the data
labelled by T§ are significantly lower than the expected values (grey
filled area). These data were obtained from the simulation results of
participant T by normalizing to the expected number ng of photon in
teractions (for the beam size of the exercise definition) and dividing by
Etr,g.
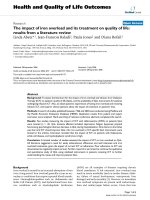
Fig. 4(a) shows the corresponding electron spectra of participant T
rebinned and normalized to the expected number of photon interactions
in the GNP for a photon fluence of one particle per circular source area
(as per the exercise definition). In the Supplementary Fig. S1, these data
are compared with the originally reported finely binned results for the
50 nm GNP irradiated with the 100 kVp spectrum. It is evident from
Fig. S1 that for energies above 10 keV the differences between the
electron spectra for the same photon spectrum and different GNP size
Fig. 3. Ratio of the energy deposited in the absence of the GNP summed over
all spherical shells to the total energy transferred to electrons. This is for the
case when a photon interacts in water within the section of the largest sphere
that is traversed by the primary photon beam. A hashtag sign indicates data sets
that were withdrawn by the participants, an asterisk indicates data compro
mised by a variation in the normalization to primary particle fluence.
5
H. Rabus et al.
Radiation Measurements 147 (2021) 106637
could not be detected with the narrow-binned spectra. As the energy loss
due to interactions in the GNP is not significant for these high-energetic
electrons, significant differences between the two GNP sizes are not
plausible.
Fig. 4(b) shows the same data normalized to the expected number of
photon interactions in the GNP for the source size used in the simula
tions of participant T. In this case, the expected agreement between data
for the same photon spectra at high electron energies is observed.
Furthermore, the difference between the spectra for different GNP sizes
in the energy range of the M-shell Auger electrons (mostly between 1
keV and 2 keV) is also more pronounced. Here, the spectra for the
different GNP sizes differ by roughly a factor of two as expected.
It should be noted that the quantity plotted on the y-axis in Fig. 4 is
the spectral radiant energy transported by the emitted electrons, i.e. the
frequency in the respective energy bin multiplied by the energy of the
bin center. As the x-axis is logarithmic, the area under the plotted curve
represents the contribution of different energy ranges to the integral
over all energies, i.e. the total number of electrons emitted from the
GNP. In addition, the spectral shapes are more apparent than in Fig. 7 of
(Li et al., 2020a, 2020b), where the details are hidden by the variation of
frequencies over several orders of magnitude (and the fluctuations in the
narrow-binned spectra).
The final results of all participants for the electron spectra are also
presented in this way in Fig. 5. The data of participants G2 and G3 that
failed the consistency checks have also been included. (The data of the
former have been divided by a factor of 5 to fit the frame. For better
visibility, they are shown here as shaded area rather than a dot-dashed
line.) The results of all participants except these two are in good
agreement at energies higher than 10 keV. For the regions of the Auger
lines (below 2.2 keV and between 6 keV and 10 keV) significant dif
ferences are seen with the results deviating by factors of as much as two.
The largest discrepancies can be seen in the energy range below 100 eV.
Electrons in this energy range contribute negligibly to the total energy
Fig. 4. Electron spectra reported by participant T for all combinations of GNP
size and photon spectra (see legend). Data have been normalized to the number
of photon interactions in the GNP expected for (a) beam diameter as defined in
the exercise (GNP diameter plus 10 nm); (b) a beam radius equal to GNP radius
plus 10 nm.
Fig. 5. Synopsis of the final spectral radiant energy of the electrons emitted from a GNP in which a photon interacts for the four cases studied in the exercise: (a) 50
kVp spectrum, 50 nm GNP, (b) 50 kVp spectrum, 100 nm GNP, (c) 100 kVp spectrum, 50 nm GNP; (d) 100 kVp spectrum, 100 nm GNP. The dot-dashed line and the
shaded area represent datasets that failed the consistency checks. (Note that the data of participant G2 have been divided by a factor of 5.)
6
H. Rabus et al.
Radiation Measurements 147 (2021) 106637
transported out of the GNP (see Supplementary Fig. S2), but are relevant
for the local dose increase in the proximity of the GNP (Rabus et al.,
2021b).
simulating the de-excitation of ionized gold atoms. Furthermore, a
newly developed electron cross-section dataset for gold (Poignant et al.,
2020) was used in the code and the existence of a potential barrier at the
GNP-water interface was also taken into account.
Comparison of Fig. 6(a) and (c) with Fig. 6(b) and (d), respectively,
shows that the total number of electrons emitted is decreasing with
increasing GNP diameter. Comparison of Fig. 6(a) and (b) with Fig. 6(c)
and (d), respectively, reveals the number of emitted electrons is slightly
smaller for the 100 kVp spectrum. Both observations are in agreement
with the trends observed for the energy transported by leaving electrons.
A common observation in all four panels of Fig. 6 is that the results
(apart from those of participants M2 and T) seem to fall into two groups
that differ by about 10% with respect to the total number of emitted
electrons. This is further illustrated in Fig. 7 where the integrals over
energy ranges are shown for all combinations of GNP size and photon
spectrum. The respective right-most histogram in each panel corre
sponds to the electron energy range above the highest Auger electron
energy from an L-shell vacancy. With the exception of the results of
participant G3 that failed the consistency checks, the values all scatter
within 3%–4% around an average value of about 0.75 for the 50 kVp
spectrum and 0.8 for the 100 kVp spectrum. This seems reasonable given
that only a fraction of the photons (with energies of 23 keV or higher)
can produce L-shell photoelectrons of these energies, which is higher for
the 100 kVp spectrum. Furthermore, there is also a significant proba
bility for elastic photon scattering in the energy ranges considered in the
exercise.
The histograms second from the right correspond to the energy range
between 5 keV and 11.5 keV, where Auger-electrons are produced from
L-shell vacancies filled by transitions involving only electrons from
higher shells. In these histograms, the scatter is larger and the results
show a dependence on GNP size and photon spectrum, that becomes
evident when Fig. 7(a) and (d) are compared. These dependencies are
more pronounced in the energy range between 500 eV and 5 keV, which
covers Auger electrons from M-shell vacancies (and from L-shell va
cancies filled with another L-shell electron). The scatter between results
of different participants is most pronounced in the left-most histograms
that cover the energy range below 500 eV.
Reference to the list of simulation parameters and cross-section
3.3. Electrons ejected from a GNP
The presentation used in Fig. 5 highlights the spectral features of
electron emission from a GNP. The variation in magnitude of the
different participants results may reflect the impact of the different
cross-section data and approaches used in the codes for simulating
electron transport in gold and water. For a quantitative assessment of
these differences, it is useful to consider the complementary integrals of
the electron spectra:
n*e (Tmin ) =
1
ng
T∫
max
(10)
(e)
NE (T)dT
Tmin
where T is the kinetic energy of the electrons and NE is the number of
emitted electrons per energy interval, ng is the mean number of photon
interactions in the GNP and Tmax is the highest possible electron energy.
n*e (Tmin ) is the average number of electrons emitted from a GNP expe
riencing a photon interaction that have a kinetic energy higher than
Tmin, which can be calculated directly from the electron spectra reported
by the participants without the need for resampling. (This is also true for
the total energy transported by electrons with kinetic energy exceeding
Tmin as shown in Supplementary Fig. S3.)
The respective results are plotted in Fig. 6 such that the values are
constant within an energy bin. Results that did not pass the consistency
checks are shown as dot-dashed lines. It can be seen that for most spectra
the predicted average number of electrons emitted after a photon
interaction in a GNP is around 2. Only for participants M2 and T is this
number significantly higher, where the discrepancy is primarily due to
emitted electrons with energies below 100 eV. In the case of participant
T this seems to be related to the use of a production threshold for sec
ondary electrons as low as 10 eV. For participant M2, the increased
number of low-energy electrons is presumably due to the fact that more
than 1600 Auger and Coster-Kronig transitions were considered when
(e)
Fig. 6. Complementary cumulative distribution of the number of electrons emitted from a GNP in which a photon interaction occurs that have a kinetic energy
exceeding the value on the x-axis. (a) 50 kVp spectrum and 50 nm GNP, (b) 50 kVp spectrum and 100 nm GNP, (c) 100 kVp spectrum and 50 nm GNP; (d) 100 kVp
spectrum and 100 nm GNP. Dot-dashed lines indicate data that failed the consistency checks. The different horizontal steps reflect the different bin sizes used by the
participants.
7
H. Rabus et al.
Radiation Measurements 147 (2021) 106637
Fig. 7. Comparison of the integrals of the emitted electron spectra over different electron energy ranges (given on the abscissa in keV) for (a) 50 kVp spectrum and
50 nm GNP, (b) 50 kVp spectrum and 100 nm GNP, (c) 100 kVp and 50 nm GNP; (d) 100 kVp spectrum and 100 nm GNP. (The missing column in the left panel of
each graph is due to the fact that participant P1 only reported electron energies higher than 100 eV)
datasets used by the participants in Table 1 of (Li et al., 2020a) does not
provide a simple explanation for the differences observed in Figs. 6 and
7. The high number of low-energy electrons reported by participant T is
most likely due to the low energy threshold for electron production. For
participant M2, the high numbers may be due to comprehensive Auger
and Coster-Kronig cascades.
Nevertheless, the number of electrons emitted per photon interaction
in the GNP that have energies greater than the highest L-shell or the
highest M-shell Auger electron energy may also be used as a criteria for
checking the consistency of simulated electron spectra from GNPs.
On the contrary, it is the low-energy region of the electron spectrum
that is sensitive to simulation details such as interaction cross-sections,
energy thresholds, and the scope of the transitions considered in relax
ation processes following the creation of inner shell vacancies. The in
fluence of procedures for particle transport, particularly across
interfaces, is also greater in the low energy range. For instance, a surface
potential barrier leads to a change of kinetic energy when the electrons
cross the interface, and it also changes (reduces) their emission proba
bility (Bug et al., 2012). This illustrates the need for a detailed investi
gation of these aspects in the frame of future intercomparison exercises.
It is worth noting in this context that most codes only consider
atomic relaxation where the final state is a multiple charged ionized
atom. In reality, all vacancies in valence shells of a GNP are filled and all
holes are collected in the conduction band. The transitions leading to
this final state also produce electrons with low energy (with respect to
the Fermi edge) that may overcome the surface energy barrier.
repeating the simulations in the exercise. The cross-checking of internal
consistency of the simulation results emphasizes the need for such multigroup intercomparison studies such as to raise awareness in the scien
tific community that apparent simplicity of a simulation task can be
deceptive.
Apart from identifying inconsistencies between different simula
tions, the methods used in this study provide tools for assessing the
plausibility of simulations results for the physical radiation effects of
nanoparticles. Such plausibility checks are often not considered in such
simulation studies reported in the literature (Rabus et al., 2021b).
In particular, normalizing the simulation results to the probability
for a photon interaction in a GNP yields easily interpretable quantities.
An example shown in this work was the total number of ejected electrons
from a GNP. For the GNP sizes considered in the exercise, there are
approximately two electrons with energies exceeding 100 eV that leave
a GNP after a photon interaction. Electrons of lower energy will be
absorbed in the few nm-thick coating of the GNPs. Thus, any radiation
effects of GNPs of this size are due to only a few emitted electrons.
4. Conclusion
This work was, in part, funded by the DFG (grant nos. 336532926
and 386872118) and the National Cancer Institute (grant no. R01
CA187003). Werner Friedland is acknowledged for providing his
simulation results without claiming co-authorship.
Declaration of competing interest
The authors declare that they have no known competing financial
interests or personal relationships that could have appeared to influence
the work reported in this paper.
Acknowledgements
The consistency tests presented in this paper have been used to
identify simulation results that did not fully comply with the definition
of the Monte Carlo code intercomparison exercise. Deviations from the
exercise definition included variation in geometrical dimensions,
different particle fluence, incorrect tallies and variations in the photon
energy spectra. In the first two cases, the results could be corrected by a
simple fluence correction. The other cases required determination of
appropriate correction factors by performing additional simulations or
Appendix A. Supplementary data
Supplementary data to this article can be found online at https://doi.
org/10.1016/j.radmeas.2021.106637.
8
H. Rabus et al.
Radiation Measurements 147 (2021) 106637
References
Li, J., Li, C., Qiu, R., Yan, C., Xie, W., Wu, Z., Zeng, Z., Tung, C., 2015. DNA strand breaks
induced by electrons simulated with Nanodosimetry Monte Carlo Simulation Code:
NASIC. Radiat. Protect. Dosim. 166, 38–43. />Li, W.B., Belchior, A., Beuve, M., Chen, Y.Z., Maria, S.D., Friedland, W., Gervais, B.,
Heide, B., Hocine, N., Ipatov, A., Klapproth, A.P., Li, C.Y., Li, J.L., Multhoff, G.,
Poignant, F., Qiu, R., Rabus, H., Rudek, B., Schuemann, J., Stangl, S., Testa, E.,
Villagrasa, C., Xie, W.Z., Zhang, Y.B., 2020a. Intercomparison of dose enhancement
ratio and secondary electron spectra for gold nanoparticles irradiated by X-rays
calculated using multiple Monte Carlo simulation codes. Phys. Med. 69, 147–163.
/>Li, W.B., Beuve, M., Maria, S.D., Friedland, W., Heide, B., Klapproth, A.P., Li, C.Y.,
Poignant, F., Rabus, H., Rudek, B., Schuemann, J., Villagrasa, C., 2020b.
Corrigendum to “Intercomparison of dose enhancement ratio and secondary electron
spectra for gold nanoparticles irradiated by X-rays calculated using multiple Monte
Carlo simulation codes” [Phys. Med. 69 (2020) 147-163] Phys. Med. 80, 383–388.
/>McMahon, S.J., Hyland, W.B., Muir, M.F., Coulter, J.A., Jain, S., Butterworth, K.T.,
Schettino, G., Dickson, G.R., Hounsell, A.R., O’Sullivan, J.M., Prise, K.M., Hirst, D.G.,
Currell, F.J., 2011. Nanodosimetric effects of gold nanoparticles in megavoltage
radiation therapy. Radiother. Oncol. 100, 412–416. />radonc.2011.08.026.
Mesbahi, A., 2010. A review on gold nanoparticles radiosensitization effect in radiation
therapy of cancer. Rep Pr. Oncol Radiother 15, 176–180. />rpor.2010.09.001.
Moradi, F., Saraee, K.R.E., Sani, S.F.A., Bradley, D.A., 2021. Metallic nanoparticle
radiosensitization: the role of Monte Carlo simulations towards progress. Radiat.
Phys. Chem. 180 (109294) />´ Gervais, B., Beuve, M.,
Poignant, F., Ipatov, A., Chakchir, O., Lartaud, P.-J., Testa, E.,
2020. Theoretical derivation and benchmarking of cross sections for low-energy
electron transport in gold. Eur. Phys. J. Plus 135 (358). />epjp/s13360-020-00354-3.
Rabus, H., Gargioni, E., Li, W., Nettelbeck, H., Villagrasa, C., 2019. Determining dose
enhancement factors of high-Z nanoparticles from simulations where lateral
secondary particle disequilibrium exists. Phys. Med. Biol. 64 />10.1088/1361-6560/ab31d4, 155016 (26 pp.).
Rabus, H., G´
omez-Ros, J.M., Villagrasa, C., Eakins, J., Vrba, T., Blideanu, V., Zankl, M.,
Tanner, R., Struelens, L., Brki´c, H., Domingo, C., Baiocco, G., Caccia, B., Huet, C.,
Ferrari, P., 2021a. Quality assurance for the use of computational methods in
dosimetry: activities of EURADOS Working Group 6 ’Computational Dosimetry’.
J. Radiol. Prot. 41, 46–58. />Rabus, H., Li, W.B., Villagrasa, C., Schuemann, J., Hepperle, P.A., Rosales, L., De la, F.,
Beuve, M., Maria, S.D., Klapproth, A.P., Li, C.Y., Poignant, F., Rudek, B.,
Nettelbeck, H., 2021b. Intercomparison of Monte Carlo calculated dose
enhancement ratios for gold nanoparticles irradiated by X-rays: assessing the
uncertainty and correct methodology for extended beams. Phys. Med. 84, 241–253.
/>ˇ Rabus, H.,
Rühm, W., Ainsbury, E., Breustedt, B., Caresana, M., Gilvin, P., Kneˇzevi´c, Z.,
Stolarczyk, L., Vargas, A., Bottollier-Depois, J.F., Harrison, R., Lopez, M.A.,
Stadtmann, H., Tanner, R., Vanhavere, F., Woda, C., Clairand, I., Fantuzzi, E.,
Fattibene, P., Hupe, O., Olko, P., Olˇsovcov´
a, V., Schuhmacher, H., Alves, J.G.,
Miljanic, S., 2020. The European radiation dosimetry group – review of recent
scientific achievements. Radiat. Phys. Chem. 168, 108514. />6/j.radphyschem.2019.108514.
ˇ Lopez, M.A.,
Rühm, W., Bottollier-Depois, J.F., Gilvin, P., Harrison, R., Kneˇzevi´c, Z.,
Tanner, R., Vargas, A., Woda, C., 2018. The work programme of EURADOS on
internal and external dosimetry. Ann. ICRP 47, 20–34. />0146645318756224.
Salvat, F., 2015. NEA/NSC/DOC(2015): PENELOPE-2014: A Code System for Monte
Carlo Simulation of Electron and Photon Transport. Nuclear Energy Agency (NEA) of
the Organisation for Economic Co-operation and Development (OECD), Paris.
Salvat, F., Fernandez-Varea, J.M., Sempau, J., 2011. PENELOPE-2011: a code system for
Monte Carlo. Simulat. Electron Photon Transport.
Schuemann, J., McNamara, A.L., Ramos-M´endez, J., Perl, J., Held, K.D., Paganetti, H.,
Incerti, S., Faddegon, B., 2019. TOPAS-nBio: an extension to the TOPAS simulation
toolkit for cellular and sub-cellular radiobiology. Radiat. Res. 191 (125) https://doi.
org/10.1667/rr15226.1.
Seltzer, S.M., Bartlett, D.T., Burns, D.T., Dietze, G., Menzel, H.-G., Paretzke, H.G.,
Wambersie, A., 2011. ICRU report 85: fundamental quantities and units for ionizing
radiation. J. Int. Comm. Radiat. Units Meas 11, 1–38.
Vlastou, E., Diamantopoulos, S., Efstathopoulos, E.P., 2020. Monte Carlo studies in Gold
Nanoparticles enhanced radiotherapy: the impact of modelled parameters in dose
enhancement. Phys. Med. 80, 57–64. />
Andreo, P., Burns, D.T., Salvat, F., 2012. On the uncertainties of photon mass energyabsorption coefficients and their ratios for radiation dosimetry. Phys. Med. Biol. 57,
2117–2136. />Bernal, M.A., Bordage, M.C., Brown, J.M.C., Davídkov´
a, M., Delage, E., Bitar, Z.E.,
Enger, S.A., Francis, Z., Guatelli, S., Ivanchenko, V.N., Karamitros, M., Kyriakou, I.,
Maigne, L., Meylan, S., Murakami, K., Okada, S., Payno, H., Perrot, Y., Petrovic, I.,
ˇ ep´
Pham, Q.T., Ristic-Fira, A., Sasaki, T., Stˇ
an, V., Tran, H.N., Villagrasa, C.,
Incerti, S., 2015. Track structure modeling in liquid water: a review of the Geant4DNA very low energy extension of the Geant4 Monte Carlo simulation toolkit. Phys.
Med. 31, 861–874. />Berger, M.J., Hubbell, J.H., Seltzer, S.M., Chang, J., Coursey, J.S., Sukumar, D.S.R.,
Zucker Olsen, K., . XCOM: Photon Cross Section Database version 1.5). Available at::
Gaithersburg, MD: National Institute of Standards and
Technology />Booz, J., Braby, L., Coyne, J., Kliauga, P., Lindborg, L., Menzel, H.-G., Parmentier, N.,
1983. ICRU report 36: microdosimetry. J. Int. Comm. Radiat. Units Meas. os-19,
iii–119.
Breustedt, B., Blanchardon, E., Castellani, C.-M., Etherington, G., Franck, D., Giussani, A.,
Hofmann, W., Lebacq, A.-L., Li, W.B., Noßke, D., Lopez, M.A., 2018. EURADOS work
on internal dosimetry. Ann. ICRP 47, 75–82. />0146645318756232.
Bromma, K., Cicon, L., Beckham, W., Chithrani, D.B., 2020. Gold nanoparticle mediated
radiation response among key cell components of the tumour microenvironment for
the advancement of cancer nanotechnology. Sci. Rep. 10 />s41598-020-68994-0.
Bug, M., Rabus, H., Rosenfeld, A.B., 2012. Electron emission from amorphous solid water
after proton impact: benchmarking PTra and Geant4 track structure Monte Carlo
simulations. Radiat. Phys. Chem. 81, 1804–1812. />radphyschem.2012.07.006.
Butterworth, K.T., McMahon, S.J., Currell, F.J., Prise, K.M., 2012. Physical basis and
biological mechanisms of gold nanoparticle radiosensitization. Nanoscale 4,
4830–4838. />Cui, L., Her, S., Borst, G.R., Bristow, R.G., Jaffray, D.A., Allen, C., 2017.
Radiosensitization by gold nanoparticles: will they ever make it to the clinic?
Radiother. Oncol. 124, 344–356. />Friedland, W., Dingfelder, M., Kundr´
at, P., Jacob, P., 2011. Track structures, DNA targets
and radiation effects in the biophysical Monte Carlo simulation code PARTRAC.
Mutat. Res. 711, 28–40. />Gervais, B., Beuve, M., Olivera, G.H., Galassi, M.E., 2006. Numerical simulation of
multiple ionization and high LET effects in liquid water radiolysis. Radiat. Phys.
Chem. 75, 493–513. />Goorley, T., James, M., Booth, T., Brown, F., Bull, J., Cox, L.J., Durkee, J., Elson, J.,
Fensin, M., Forster, R.A., Hendricks, J., Hughes, H.G., Johns, R., Kiedrowski, B.,
Martz, R., Mashnik, S., McKinney, G., Pelowitz, D., Prael, R., Sweezy, J., Waters, L.,
Wilcox, T., Zukaitis, T., 2012. Initial MCNP6 release overview. Nucl. Technol. 180,
298–315. />Hainfeld, J.F., Slatkin, D.N., Smilowitz, H.M., 2004. The use of gold nanoparticles to
enhance radiotherapy in mice. Phys. Med. Biol. 49, N309–N315. />10.1088/0031-9155/49/18/n03.
Her, S., Jaffray, D.A., Allen, C., 2017. Gold nanoparticles for applications in cancer
radiotherapy: mechanisms and recent advancements. Adv. Drug Deliv. Rev. 109,
84–101. />Hubbell, J.H., Seltzer, S.M., . Tables of X-Ray Mass Attenuation Coefficients and Mass
Energy-Absorption Coefficients from 1 keV to 20 MeV for Elements Z = 1 to 92 and
48 Additional Substances of Dosimetric Interest (version 1.4) [Online] Available at:
Gaithersburg, MD: National Institute of Standards
and Technology />Incerti, S., Baldacchino, G., Bernal, M., Capra, R., Champion, C., Francis, Z., Guatelli, S.,
Gu`
eye, P., Mantero, A., Mascialino, B., Moretto, P., Nieminen, P., Rosenfeld, A.,
Villagrasa, C., Zacharatou, C., 2010. The Geant4-DNA project. Int. J. Model. Simul.
Sci. Comput. 1, 157–178. />Incerti, S., Kyriakou, I., Bernal, M.A., Bordage, M.C., Francis, Z., Guatelli, S.,
Ivanchenko, V., Karamitros, M., Lampe, N., Lee, S.B., Meylan, S., Min, C.H., Shin, W.
G., Nieminen, P., Sakata, D., Tang, N., Villagrasa, C., Tran, H.N., Brown, J.M.C.,
2018. Geant4-DNA example applications for track structure simulations in liquid
water: a report from the Geant4-DNA Project. AIP Conf. Proc. 45, e722–e739.
/>Koger, B., Kirkby, C., 2016. A method for converting dose-to-medium to dose-to-tissue in
Monte Carlo studies of gold nanoparticle-enhanced radiotherapy. Phys. Med. Biol.
61, 2014–2024. />Kuncic, Z., Lacombe, S., 2018. Nanoparticle radio-enhancement: principles, progress and
application to cancer treatment. Phys. Med. Biol 63. 02TR01.
9