Exploring the application of blue and red thermoluminescence for dating volcanic glasses
Bạn đang xem bản rút gọn của tài liệu. Xem và tải ngay bản đầy đủ của tài liệu tại đây (8.98 MB, 11 trang )
Radiation Measurements 153 (2022) 106731
Contents lists available at ScienceDirect
Radiation Measurements
journal homepage: www.elsevier.com/locate/radmeas
Exploring the application of blue and red thermoluminescence for dating
volcanic glasses
K. Rodrigues a, *, S. Huot b, A. Keen-Zebert a
a
b
Division of Earth and Ecosystem Sciences, Desert Research Institute, 2215 Raggio Parkway, Reno, NV, 89512, USA
Illinois State Geological Survey, Prairie Research Institute, University of Illinois at Urbana-Champaign, Champaign, IL, 61820, USA
A R T I C L E I N F O
A B S T R A C T
Keywords:
Luminescence
Tephrochronology
Thermoluminescence
Volcanic glass
TL
Tephras are significant markers in the stratigraphic record and play a key role in establishing paleoenvir
onmental and paleoclimate histories worldwide. Despite burgeoning research focused on tephra characterization
and correlation techniques, there are still few techniques that allow for the direct dating of tephra, particularly
below the lower age limit of K/Ar and Ar/Ar dating methods. In this study, we test different thermoluminescence
(TL) dating approaches on the 4–11 μm volcanic glass constituents of three different independently different
tephras. By comparing against independent age control, we demonstrate the utility of both blue (320–450 nm)
and red (587–651 nm) TL emissions for dating volcanic glasses using single aliquot regenerative (SAR) dose
techniques. We find that both blue and red TL emissions from the volcanic glass shards are dim but reproducible
and show no evidence for significant sensitivity changes occurring between the natural TL and the first test dose
during the SAR protocol. Fading tests on the blue TL signal show that g-values range from 1.6 ± 1.0 to 2.9 ±
1.1%/decade and are statistically indistinguishable with zero at 2σ for the red TL. Bleaching experiments show
that both blue and red TL signals are sensitive to light exposure, with sensitivity corrected signals declining by
~40% over a 2-h period. For all three tephras, both the fading-corrected blue and red SAR-TL ages are consistent
with age expectation. These successful results demonstrate the effectiveness of TL techniques for determining the
eruption ages of tephra deposits in primary position between ~1 and at least 30 ka.
1. Introduction
from other eruption events (Lowe, 2011). A major obstacle in the
application of tephrochronology is accurate age determination. The age
of tephras is most commonly established either directly by radiometric
methods (commonly K/Ar or Ar/Ar, e.g., Van den Bogaard, 1995), or
fission track dating of primary mineral constituents for older deposits
(≳100 ka, e.g., Seward, 1974) or indirectly by radiocarbon dating of
associated organic material for younger tephras (<50 ka, e.g., Benson
et al., 1997). For older tephras lacking in K-rich components, ages can
also be indirectly defined by correlating paleomagnetic secular varia
tions with GISP2 ice core records (e.g., Benson et al., 2003), but these
techniques
rely
on
several
untested
assumptions
about
intra-hemispheric relationships between marine and continental
records.
Techniques that can accurately date tephra between the upper limits
of radiocarbon dating (~50 ka) and lower limits of K/Ar and Ar/Ar
dating (~100 ka) are limited, but luminescence dating methods hold
considerable promise. Previous luminescence work on volcanic mate
rials has primarily focused on dating either (1) volcanic phenocrysts
Tephrochronology is a geochronologic dating technique based on
geochemically identifying and correlating horizons of tephra erupted
from volcanic eruptions (Lowe and Alloway, 2015). In recent decades,
the application of tephrochronology has increased considerably in direct
response to advances in geochemical techniques used to ‘fingerprint’
individual tephras and correlate them with specific eruption events
(Lowe, 2011). Because tephras are deposited virtually instantaneously
(in geologic terms) and over long distances, they effectively represent
isochronic marker horizons within stratigraphic sequences (Lowe,
2011). If the age of a tephra layer is known, its occurrence in strati
graphic sequences offers an opportunity to constrain the age of brack
eting stratigraphic units and link spatially separated stratigraphic
sequences into an integrated chronological framework.
Accurate tephrochronology requires that tephra deposits (a) have a
known age, (b) originate from a (geologically) short lived volcanic
eruption, and (c) can be fingerprinted and geochemically discriminated
* Corresponding author.
E-mail address: (K. Rodrigues).
/>Received 1 December 2021; Received in revised form 15 February 2022; Accepted 23 February 2022
Available online 26 February 2022
1350-4487/© 2022 Elsevier Ltd. All rights reserved.
K. Rodrigues et al.
Radiation Measurements 153 (2022) 106731
technique (e.g., Wintle, 1973; Tsukamoto and Duller, 2008). Addition
ally, the aforementioned approaches, which depend on the presence of
phenocrysts or xenoliths, are not applicable for dating volcanic products
lacking macroscopic mineral grains, particularly from deposits far from
the eruptive source.
With respect to the volcanic glass constituents of tephra, previous
works have used blue thermoluminescence (TL) to produce age results
with varying degrees of success between 0.5 ka to 400 ka (Berger and
Huntley, 1983; Berger, 1985, 1987, 1991; Berger and Davis, 1992). TL
dating of volcanic glass was not continued because of problems associ
ated with low signal intensities, anomalous fading, and poor
inter-aliquot reproducibility resulting in large analytical errors up to
20–25% (e.g., Berger, 1991). Moreover, several TL ages had an apparent
discrepancy with the established tephra ages and were considered
inaccurate. Since that time, the regional tephrochronology has been
revised and are now in agreement with Berger’s (1991) age results with
one exception: the Dibekulewe tephra (Redwine, 2013).
Beyond the work carried out by Berger, there have been few attempts
to apply luminescence dating to glass. Several attempts to apply TL
dating to archaeological glasses have provided unsatisfactory results
(Sanderson et al., 1983), though some recent attempts on glass tiles
(tesserae) have been more promising (Chiavari et al., 2001; Galli et al.,
2006, 2011) apparently owing to the relatively high degree of crystal
linity within the amorphous silica and/or to the presence of individual
minerals dispersed within the glass. Other amorphous natural materials
including flint (amorphous or microcrystalline SiO2) have demonstrated
ăksu et al., 1974).
a long history of TL dating success (e.g., Go
New technology and advances in technique development provide an
opportunity to revisit the applicability of luminescence dating to vol
canic glass. A successful volcanic glass TL dating approach would enable
direct dating of tephras and allow for age determination of their asso
ciated eruption events. In this paper, we expand on the work of Berger
and others for TL dating of volcanic glass by refining previously suc
cessful techniques (blue TL), and testing the application of a new dating
technique focused on red TL emission that has previously been observed
for volcanic glasses with andesitic or dacitic composition (Kanemaki
et al., 1991).
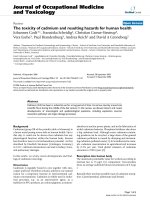
Fig. 1. Location map of the Lahontan basin showing the sample locations of the
Wono, Trego Hot Springs, and Turupah Flat tephras described in this study.
Details about the sample location, and independent age control for each of the
tephra beds are outlined in Table 1. The thin grey line denotes the late Pleis
tocene highstand of Lake Lahontan approximately 12.7 ka. T = Lake Tahoe, P =
Pyramid Lake, W = Walker Lake.
2. Study area and sample characteristics
(Tsukamoto et al., 2007) or (2) xenoliths that have had their lumines
cence signal reset upon interaction with lava flows (Schmidt et al., 2017)
or via phreatomagmatic explosions (Rufer et al., 2012). Fattahi and
ăsken and Schmidt (2020) summarize many
Stokes (2003) and Bo
luminescence-based efforts for determining the ages of various volcanic
products. Several studies have observed that the major limitation in
applying luminescence dating techniques to volcanic materials has been
anomalous fading, which can severely affect the accuracy of the
Tephra samples were collected from the Lahontan basin of
Nevada—a sub-basin of the Great Basin that hosted a series of large lakes
throughout the Quaternary (Fig. 1; Russell, 1885). Three
well-documented tephra outcrops were selected for sampling based on
the following criteria: (1) thick (ideally 10+ cm), well preserved tephra
beds with minimal visible evidence for reworking, thus reducing the
possibility for post-depositional signal resetting, and (2) independently
Table 1
Information about tephra samples collected for luminescence age determination.
Tephra
Sample Location
Sample Depth
(m)
Age (ka)
Age determinant
Reference(s)
Turupah Flat
Salt Wells (39◦ 23′ 15.36′′ N, 118◦ 38′ 3.48′′ W)
0.4
0.6–2.0a
Radiocarbon dating
Trego Hot
Springs
Squaw Creek, southern amphitheater (40◦ 47′ 16.56′′ N,
119◦ 30′ 30.88′′ W)
25.0
23.4 ±
0.5
Radiocarbon, thermoluminescence dating
Wono
North of Bunejug Mountains (39◦ 22′ 10.20′′ N,
118◦ 37′ 53.04′′ W)
3.5
27.3 ±
0.3
Radiocarbon dating, paleomagnetic
correlation to GISP2
Wood (1977)
Davis (1978)
Miller (1985)
Sieh and Bursik
(1986)
Adams (2003)
Davis (1983)
Berger (1991)
Benson et al.
(1997)
Davis (1983)
Benson et al.
(1997)
Zic et al. (2002)
a
Adams (2003) provides the geographically closest radiocarbon age of 650–920 cal years BP at Salt Wells.
2
K. Rodrigues et al.
Radiation Measurements 153 (2022) 106731
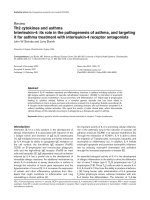
Fig. 2. Pictures of sample sites showing tephra beds and their bounding sedimentary units. (A) The Turupah Flat tephra at Salt Wells. The arrow in the picture is 10
cm in length for scale. (B) The Trego Hot Springs tephra at Squaw Creek (the southern amphitheater of Davis, 1983). Hammer is ~60 cm in length for scale. (C) The
Wono tephra near the Bunejug Mountains. The arrow in the picture is 10 cm in length for scale.
dated with at least one type of dating technique, with ages that are
widely accepted in the regional tephrochronology. The three selected
tephras were sourced from different eruptions along the Cascade Range
spanning ~1 to ~30 ka (Table 1). The tephras in this study have all been
identified as rhyolitic (>75% SiO2) on the basis of major and minor
elemental analysis of volcanic glass shards by electron microprobe
(Benson et al., 1997; Kuehn and Negrini, 2010; Bursik et al., 2014;
Pouget et al., 2014).
Adams, 2003). The only local age constraint of the Turupah Flat tephra
at Salt Wells is based on a single radiocarbon age (650–920 cal years BP)
determined from a charcoal sample collected immediately below the
tephra layer within ~20 m of the site sampled in this study. At the site
selected for sample collection, the Turupah Flat tephra is ~5 cm in
thickness and situated 0.4 m below the ground surface. The tephra layer
has an abrupt lower contact and grades upward into parallel laminae of
silt and tephra throughout the upper 1 cm (Fig. 2A). Adams (2003)
documents the depositional environment, geomorphology, stratigraphic
succession, and relevant geochronology at this site.
2.1. Turupah Flat tephra
The Turupah Flat tephra bed is comprised of a series of geochemi
cally similar tephras dated between 0.6 and 2.0 ka years ago (Table 1,
Wood, 1977; Davis, 1978; Miller, 1985; Sieh and Bursik, 1986; Adams,
2003). The Turupah Flat tephra sampled in this study is exposed at Salt
Wells on the landward (south) side of a beach barrier that borders a
small playa in northern Nevada. The beach barrier—originally mapped
as the Fallon 1 lake shoreline by Morrison (1964) and since referred to as
the Salt Wells beach barrier (Adams, 2003)—has been interpreted to
represent a lake stand that covered most of the Carson Sink (a remnant
of Lake Lahontan) during the late Holocene. The Turupah Flat tephra is
thought to have been deposited through overwash processes on the
backside of the beach barrier at the time of this highstand (Davis, 1978;
2.2. Trego Hot Springs tephra
The Trego Hot Springs tephra is widespread throughout the Lahon
tan basin and has been independently dated to 23.4 ka (Table 1, Davis,
1983; Berger, 1991, Benson et al., 1997). For this study, the Trego Hot
Springs tephra was sampled at a locality on Squaw Creek (the southern
amphitheater of Davis, 1983), a site that has been studied thoroughly
over the last 40 years (Davis, 1983; Benson et al., 1997; Adams, 2010).
Here, Squaw Creek has exposed parts of a delta belonging to the Sehoo
Formation of Morrison (1964). An ~12–15 cm thick exposure of the
Trego Hot Springs tephra is situated near the base of the delta and grades
upward into an ~30 cm thick siltier unit with prominent reworked
3
K. Rodrigues et al.
Radiation Measurements 153 (2022) 106731
tephra (Fig. 2B).
Table 2
The SAR-TL protocol applied to the samples in this study.
2.3. Wono tephra
Step
1
2
3
4
5
6
7
8
9
Approximately 2 km southeast of the Turupah Flat tephra sampled at
Salt Wells is a prominent exposure of the Wono tephra, located at the
northern end of the Bunejug Mountains. The Wono tephra has a wellestablished age of 27.3 ka (Table 1, Davis, 1983; Benson et al., 1997;
Zic et al., 2002). At the site selected for sample collection, the Wono
tephra is interbedded with coarse beach gravels and has been inter
preted to represent deposition in backset beds on the margin of a former
lake (Adams, 2010). At this location, the Wono tephra forms an ~15 cm
thick bed with abrupt upper and lower contacts (Fig. 2C).
a
Treatment
Observation
a
Give dose, Di
Preheat (200 ◦ C for 10 min)
TL measurement to 450 ◦ C at 2 ◦ C/s
Background TL measurement to 450 ◦ C
Administer test dose (50 Gy)
Preheat (200 ◦ C for 10 min)
TL measurement to 450 ◦ C at 2 ◦ C/s
Background TL measurement to 450 ◦ C
Return to step 1
Lx
Tx
For measurement of the natural signal, i = 0.
a heating rate of 2 ◦ C/s. The background TL was recorded in a second
measurement on the same aliquot immediately after signal readout and
subtracted channel-wise to obtain net signals. TL measurements were
made on 9.8 mm diameter stainless steel discs mounted with ~1 mg of
sample by settling in acetone.
3. Methods
3.1. Sample collection and preparation
At each of the three sites, luminescence samples were taken directly
from the tephra bed by hammering steel tubes (for Wono and Trego Hot
Springs tephras: ~20 cm L x ~5 cm D, for Turupah Flat tephra: ~10 cm L
x 3 cm D) into freshly cleaned vertical sections. The ends of tubes were
then wrapped to avoid light exposure during transport. To account for
the heterogeneous gamma dose rate environments at each of the lumi
nescence sample sites, sediment samples were collected from the upper
and lower bounding layers for dose rate assessment. A third ‘average’
dose rate sample was collected from sediment within a 30 cm radius
surrounding the luminescence sample tube. This third dose rate sample
was used exclusively to check for equilibrium conditions in the 238U
decay chain.
Luminescence sample preparation was conducted at the DRI Lumi
nescence Laboratory (DRILL). Preparation of the tephra for TL mea
surement adapted the methodology from Berger (1991). Following this
protocol, the tephra samples were chemically treated to remove car
bonates and organic material (10% HCl and 30% H2O2, respectively),
and the fine grained (4–11 μm) fraction was separated from the bulk
sample by extraction from suspension at appropriate settling velocity
times according to Stokes’ Law. Volcanic glass was isolated from bulk
tephra using a solution of lithium heteropolytungstate in methanol
prepared with a specific gravity of 2.45 g/cm3 and centrifuged at 3000
rpm for 10 min. The heavy liquid separation protocol was carried out a
minimum of two times with the float. The effectiveness of the separation
technique was evaluated by visual inspection under both petrographic
and scanning electron microscope (SEM) at the University of Nevada,
Reno Microbeam Laboratory. Panchromatic SEM-cathodoluminescence
(SEM-CL) was also applied to individual glass shards in effort to char
acterize them further.
3.3. Initial testing and measurement protocols
To define the thermally stable part of the TL glow curve and deter
mine an appropriate preheat temperature for experimentation, a plateau
test was carried out on three aliquots of each sample by using the ratio of
natural TL to the TL after laboratory bleaching (herein defined as
heating to 450 ◦ C to remove the signal) and subsequently administering
a β-dose (Aitken, 1985).
Standard SAR procedures were carried out following the methods of
Murray and Wintle (2000) and incorporated a preheat of 200 ◦ C for 10
min to eliminate the thermally unstable part of the TL glow curve prior
to TL readout, 4–5 regeneration doses bracketing the natural dose
including a recycled dose and a zero dose, in addition to sensitivity
correction with a 50 Gy test dose (Table 2). SAR-TL dose recovery tests
were carried out for both blue and red TL to further test the reliability of
the SAR protocol and determine the spread of the recovered doses. Blue
TL dose recovery tests (Murray and Wintle, 2003) were carried out on 10
aliquots of each sample that were first bleached and then β-irradiated
with a known dose approximating the natural equivalent dose (natural
De). Red TL dose recovery tests followed the same protocol but for only 5
aliquots of Trego Hot Springs.
All previously published TL dating work on volcanic glass (Berger
and Huntley, 1983; Berger, 1985, 1987, 1991; Berger and Davis, 1992)
has employed a multiple aliquot additive dose (MAAD) approach using
the methodology described in Aitken (1985). However, MAAD ap
proaches require significantly more prepared material and yield values
of De that are based on extrapolation and yield lower age precision
relative to interpolative approaches like the single aliquot regenerative
protocol (SAR, Murray and Wintle, 2000). In order to test whether a SAR
approach would be appropriate for both blue and red TL measurements
on volcanic glass, a single-aliquot regeneration and added dose (SARA,
Mejdahl and Bøtter-Jensen, 1997) approach was applied to assess for
potential sensitivity changes occurring between natural and regenera
tive TL readout. Owing to sample availability, the SAR-SARA experi
ments were only carried out for Trego Hot Springs. The SAR-SARA
experiments included four to five groups of aliquots which were given a
different additive prior to the determination of De by our SAR-TL pro
tocol (Table 2). These SAR-TL measured doses were then plotted against
the known added doses, and the value of De was obtained by a linear
extrapolation of the data to the dose axis at the intercept. A line with a
slope of 1 was considered to reflect insignificant sensitivity change be
tween measurement of the natural and first regenerative dose.
The ‘Luminescence’ package (Kreutzer, 2021) for R was used to
calculate De values using the SAR-TL protocol. The appropriate TL in
tegral used for De calculation was determined by identifying a stable
region showing a plateau in De values (Aitken, 1985). All results of TL
3.2. Luminescence measurements
TL measurements on each sample were performed using two
different methods, each utilizing a different range of emission spectra for
measurement: blue TL and red TL. Blue TL measurements on separated
volcanic glass were conducted using a Risø TL/OSL-DA-20 reader
housed at the DRILL with an integrated 90Sr/90Y β-source delivering a
dose rate of 0.10 Gy/s. Blue TL signals were detected with an EMI
9235QA photomultiplier tube (PMT) after passing through a blue filter
pack (4 mm of Corning 7–59 in combination with 2 mm Schott BG 39).
Red TL measurements were conducted on a Lexsyg Smart TL/OSL reader
housed at the Illinois State Geologic Survey OSL Dating Lab with
a90Sr/90Y β-source delivering a dose rate of 0.074 Gy/s. Red TL emission
was detected through a thermoelectrically cooled H7421-40 Hama
matsu PMT after passing through a combination of Chroma ET 620/60
and Schott KG 3 filters. The beta sources for both systems were cali
brated with 4–11 μm quartz prepared by Risø.
All TL measurements were conducted in an N2 atmosphere and using
4
K. Rodrigues et al.
Radiation Measurements 153 (2022) 106731
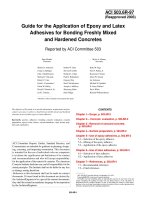
Fig. 3. Images of Wono bulk tephra pre- (A) and post-volcanic glass separation (B). (C) and (D) are images of the same glass shard displaying a series of unidentifiable
elongated or acicular microlites under SEM (C) and as observed under cathodoluminescence (CL). Note the dim visible range luminescence emitted from these
microlites under CL.
measurements were required to pass the following criteria for further
analysis: >40 ◦ C plateau range, <10% test dose error, <10% recycling
ratio error, <10% recuperation, and a signal > 3σ above background.
Owing to the small spread in values of De, the central age model (CAM,
Galbraith et al., 1999) was used to calculate a weighted mean value of
De .
To determine anomalous fading rates (g-values, Aitken, 1985) of the
TL signal in both the blue and red emission windows, β-irradiations with
doses similar to the natural De were administered to a series of aliquots
following laboratory bleaching. Fading tests incorporated pauses of
varying duration (up to 40 h) after irradiation and prior to measurement
of the test dose corrected signal (Lx/Tx) following the approach of
Auclair et al. (2003). For Lx/Tx measurements, TL signals were inte
grated from ~260 to 300 ◦ C for blue TL and ~230–270 ◦ C for red TL.
Anomalous fading tests for the blue TL signal were performed on five
aliquots of each of the samples. Anomalous fading tests for the red TL
signal were only carried out on five aliquots of Trego Hot Springs.
The optical bleachability of both the blue and red TL signal was
evaluated using aliquots that had been laboratory bleached, β-irradiated
with a dose similar to the natural De, and subsequently exposed to
natural sunny day light conditions for intervals of time ranging from 0 to
8.3 h. Owing to sample availability, light exposure experiments were
only carried out on one sample: Trego Hot Springs. Three aliquots were
measured for every light exposure interval. The sensitivity corrected
signals (Lx/Tx) remaining after light exposure were measured using a
test dose of 50 Gy. Like the fading tests described above, TL signals used
for Lx/Tx measurements were integrated from ~260 to 300 ◦ C for blue
TL and ~230–270 ◦ C for red TL.
subsamples of the original dating sample. However, distal tephras are
typically thin relative to the distance traveled by gamma rays, and
contributions from both bounding sedimentary units and the tephra bed
itself must be considered. In this study, external dose rates were esti
mated from both (1) untreated sub-samples collected from the lumi
nescence sample tube for alpha, beta, and a fraction of the gamma dose
rate, and (2) from representative samples collected from the bounding
sediments above and below the luminescence dating sample which
contribute to the modeled gamma dose rate.
Dose rates were determined by measuring the elemental concentra
tions of U, Th, and K via ICP-MS/AES (from ~20 g of material) at the ALS
facility in Reno, Nevada and then converted to dose rates based on the
factors of Adamiec and Aitken (1998). Alpha and beta dose attenuation
factors were based on Brennan et al. (1991) and Gu´erin et al. (2012),
respectively. The α-efficiency (a-value, Aitken and Bowman, 1975) of
each sample was determined on three aliquots of each sample. Following
laboratory bleaching, the aliquots were α-irradiated with a known dose
and then subsequently measured using the SAR-TL protocol outlined in
Table 2 with β-irradiations for regenerative and test dose steps. Irradi
ations were performed using a calibrated six-seater vacuum alpha irra
diation facility using 241Am alpha sources delivering ~0.14/μm2 min
housed at the University of Washington Luminescence Lab. A-values
were only measured for the blue TL emission of each sample. The frac
tional gamma dose rate contribution to the luminescence sample from
both the tephra bed itself and the bounding sediment layers at each site
were calculated as a function of their thickness following Aitken (1985,
Appendix H). The cosmic dose rate contribution was calculated after
Prescott and Hutton (1994). Internal dose rates were determined from
the elemental concentrations of U, Th, and K from the isolated glass
fraction of each sample (~5 g of material). Alpha, beta, and gamma dose
rates were adjusted for estimated moisture content of the sample during
the burial history (1 ± 5%).
To test for U-series disequilibrium in our samples, a representative
portion of each sample (~20 g) was encapsulated in thin disk-shaped
containers and sealed with two layers of epoxy gel. A minimum wait
ing time of 21 days after sealing was observed to restore the radioactive
3.4. Dose rate measurement and age calculation
Samples for luminescence dating should ideally be collected from a
sedimentary deposit that is homogenous within a radius of at least ~30
cm (Aitken, 1998), but where sampling distal tephras are concerned, this
condition is rarely met. Because of their short penetration distances,
alpha and beta dose rate contributions are likely best estimated using
5
K. Rodrigues et al.
Radiation Measurements 153 (2022) 106731
observed under a standard optical microscope (Fig. 3A). Petrographic
and SEM examination of the separated volcanic glass component
showed no observable non-glass grains (Fig. 3B). Moreover, we did not
observe the typical 110 ◦ C UV TL peak that would likely be emitted in
the presence of detrital quartz (Supplementary Fig. 1). Taken together,
these results suggest that the TL emission of our volcanic glass samples
likely arises from the glass shards (and potentially the inclusions within
them) as opposed to some other detrital component that was not
adequately removed during separation.
Approximately 10–15% of the 4–11 μm glass shards imaged dis
played prominent nano-to micro-scale crystalline inclusions with
tabular, acicular, or skeletal crystal habits (Fig. 3C). It is well docu
mented that volcanic glass shards frequently feature microlites and
nanolites with compositions that can vary depending on the magmatic
source (Sharp et al., 1996; Raymond, 2002). This contrasts with the
observations made by Berger (1991) who reported that the fine-grained
glass component was free from inclusions on the basis of petrographic
examination. Under panchromatic SEM-CL, several of the observable
microlites appeared dimly luminescent in the visible spectrum in
contrast to the glass matrix (Fig. 3D). These microlites were too small to
reveal chemical variations by energy dispersive X-ray spectroscopy
elemental mapping or spot chemical analyses.
4.2. Blue TL (320 nm–450 nm)
Blue TL signals arising from each of the measured volcanic glass
samples were dim with peaks centered near ~300 ◦ C (Fig. 4A), consis
tent with the findings of Berger (1983, 1985, 1991, 1987) and Berger
and Davis (1992). In those previous studies, a low temperature, long
preheat (e.g., 50 ◦ C over 8 days) was employed to improve the separa
tion of thermally unstable and stable components of the glow curve. In
our samples, we find that thermal instability is a prominent feature of
the glow curves below ~200 ◦ C and opt for the application of a 200 ◦ C
preheat for 10 min prior to TL measurement. An example of background
subtracted TL measured after preheating from a natural and artificially
dosed aliquot of Trego Hot Springs is displayed in Fig. 4A. A zone of
thermal stability indicated by a plateau in the ratio of natural and
irradiated blue TL was prevalent from ~250 to 325 ◦ C across all sam
ples. When no initial preheat was performed, blue TL glow curves
exhibited a broad peak spanning ~150–400 ◦ C (Supplementary Fig. 2),
suggesting the presence of several overlapping (first order) peaks.
Blue TL dating of volcanic glass, like many TL-dating applications on
heated materials, has routinely employed a multiple aliquot protocol.
However, an additive protocol requires several aliquots and therefore a
significant amount of prepared material to carry out. SAR protocols
(Murray and Wintle, 2000) are preferable because they provide more
precise estimates of De (and therefore ages). Berger and Huntley (1983)
reported significant age underestimation using regeneration methods
for dating volcanic glass, ostensibly owing to sensitivity changes be
tween natural and regeneration dose measurements. Our results from
SAR-SARA experiments on Trego Hot Springs yield a slope of 0.9, sug
gesting that sensitivity changes between the natural and first regener
ated dose are negligible while employing our SAR-TL protocol (Fig. 3C).
We expect that the other samples studied here would behave similarly
given their otherwise comparable luminescence characteristics. Dose
recovery tests performed on each sample indicate that the SAR protocol
reproduces laboratory doses with reasonable accuracy (mean dose re
covery ratio of 0.9 ± 0.1, n = 22). Blue SAR-TL dose response curves
(Fig. 3B) were fit with a single saturating exponential.
Fig. 4. Various features of the blue TL signal from volcanic glass. (A) Shows
natural and regenerated glow curves for an aliquot of prepared volcanic glass
from Trego Hot Springs. Red dots indicate the channel by channel ratio of the
natural to regenerated dose. (B) The sensitivity corrected dose response of a
single aliquot of Trego Hot Springs with test dose response (inset). (C) Results of
the SAR-SARA protocol on Trego Hot Springs.
equilibrium of 222Rn daughter products. The specific activities (Bq/kg)
were measured with a broad-energy high-purity germanium detector in
a planar configuration, shielded by 15 cm of lead.
4. Results and discussion
4.1. Volcanic glass characterization and assessment of the separation
protocol
4.3. Red TL (587 nm–651 nm)
The red TL emission from our volcanic glass samples were dimmer
than their blue TL counterparts and centered near ~250 ◦ C, consistent
with the findings of Kanemaki et al. (1991) who similarly describe high
temperature red TL emission at ~620 nm. Our TL glow curves featured
Bulk tephra samples collected for this study were largely dominated
by the glass component, with minor (≲10%) contributions of quartz and
feldspar (either primary or detrital), lithics, and pumice fragments.
Several glass shards featured small unidentifiable dark inclusions, as
6
K. Rodrigues et al.
Radiation Measurements 153 (2022) 106731
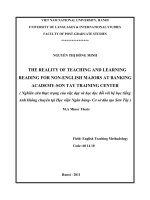
Fig. 6. Blue and red TL signal loss as a function of bleaching time for Trego Hot
Springs (THS). Data was normalized to initial measurements made on three
artificially irradiated, unbleached aliquots. Bleaching was carried out using
natural sunny daylight conditions for both blue and red TL. Each data point
reflects the average of measurements on three aliquots with errors that repre
sent the standard deviation.
recovery ratio carried out using the SAR-TL protocol for Trego Hot
Springs is 1.0 ± 0.1. Red SAR-TL dose response curves were fit with a
single saturating exponential (Fig. 5B).
4.4. Light exposure tests
In principle, the TL signal from volcanic glasses should begin to
accumulate shortly after cooling and solidification. Provided that
tephras are subsequently deposited within days to a few years (Lowe,
2011), the TL age should closely represent the timing of eruption.
However, if the electron trap storing the signal is optically bleachable,
post-depositional reworking may reset or conflate the age of interest.
Though the samples collected for this study were considered primary
with no indication of post-depositional reworking, we carried out a se
ries of tests to determine the sensitivity of both the blue and red TL
signals of volcanic glass to light exposure.
Both red and blue TL signals appear sensitive to light exposure and
display a logarithmic decline in signal intensity over ~8 h of sunlight
exposure with an average signal reduction of ~40% over a 2-h period
(Fig. 6). Within the reported analytical uncertainties, there is no
appreciable difference in the bleaching rates between blue and red TL
signals. These results suggest that both blue and red TL dating of vol
canic glass can only accurately determine the timing of an eruption
event if sampling is conducted on primary ashfall, or where reworking
has occurred over short post-depositional time scales.
Fig. 5. Various features of volcanic glass red TL signals displayed for Trego Hot
Springs. (A) shows natural and regenerated glow curves for an aliquot of pre
pared volcanic glass. Red dots indicate the channel-by-channel ratio of the
natural to regenerated dose. (B) The sensitivity corrected dose response of a
single aliquot with test dose response (inset). (C) Results of the SARSARA protocol.
4.5. Equivalent dose determinations
plateaus that extended from ~220 to 275 ◦ C (Fig. 5A). At temperatures
above ~325 ◦ C a high thermal background was dominant, making it
difficult to extract a meaningful net signal. Manually shifting the back
ground TL by a single data channel (i.e. 2 ◦ C) improved black body
subtraction at high temperatures but had no appreciable impact on the
plateau region where the TL signal was integrated for calculation of De
(Supplementary Fig. 3). We therefore carried out standard
channel-by-channel subtraction for all red TL glow curves.
Results of the SAR-SARA protocol on Trego Hot Springs using the red
TL signal are displayed in Fig. 5B. Like the blue TL emission, a slope of
1.0 confirms that there is negligible sensitivity change between mea
surement of the natural and first test dose (Fig. 5C). The mean dose
Results of the blue and red SAR-TL and SAR-SARA De measurements
are compiled in Table 3. Values of De obtained using the SAR and SARSARA protocols for Trego Hot Springs are indistinguishable from each
other within 1σ error uncertainty, further demonstrating that the SAR
protocol accurately measures radiation doses stored in our volcanic glass
samples. Values of De generally display low spread with overdispersion
values under 10% (Fig. 7, Table 3). The observation of low inter-aliquot
scatter suggests that the TL signal is dominated by an average lumi
nescence signal derived from many emitters at the aliquot level, but
further work is needed to determine whether this is associated with
discrete inclusions embedded within the glass shards, the glass matrix
7
K. Rodrigues et al.
Radiation Measurements 153 (2022) 106731
Table 3
A summary of red and blue TL equivalent doses, dose rates, and calculated ages. Preferred ages are in bold.
Sample
Method
Aliquots Accepted
(measured)
De (Gy)
Overdispersion
(%)
Total dose
rate (Gy/ka)
Average g-value
(%/decade)
Measured age
(ka)
Final age
(ka)
Expected age
(ka)
Turupah Flat
Blue SAR-TL
11 (20)
0±0
13.1 ± 1.3
2.9 ± 1.1
0.9 ± 0.1
9 (16)
Blue SAR-TL
13 (20)
Red SAR-TL
8 (15)
Blue SARSARA- TL
Red SARSARA- TL
Blue SAR-TL
16 (23)
20 (26)
Red SAR-TL
9 (13)
1.1 ±
0.2a
1.1 ±
0.1
26.3 ±
3.0a
24.2 ±
2.4
27.0 ±
4.3a
24.7 ±
4.0
25.9 ±
2.5a
26.2 ±
3.1
0.6–2.0
Red SAR-TL
12.0 ±
1.1
14.4 ±
1.2
119.1 ±
3.7
133.0 ±
6.4
122.2 ±
14.3
135.5 ±
18.6
135.4 ±
4.1
155.0 ±
7.5
Trego Hot
Springs
Wono
a
20 (35)
0±0
1.1 ± 0.1
1±5
5.5 ± 0.5
0±0
2.4 ± 1.0
21.7 ± 2.0
− 0.4 ± 1.2
24.2 ± 2.4
2.4 ± 1.1
22.3 ± 3.3
24.7 ± 4.0
8±3
5.9 ± 0.6
7±4
1.6 ± 1.0
22.9 ± 2.5
26.2 ± 3.1
Ages corrected for anomalous fading.
Fig. 7. Equivalent dose values displayed as kernel density estimate (KDE) plots. RTL = red TL, BTL = blue TL.
8
23.4 ± 0.5
27.3 ± 0.3
K. Rodrigues et al.
Radiation Measurements 153 (2022) 106731
of the total dose rate), with minor contributions from the gamma, cos
mic, and internal dose rate components (Table 4). With the exception of
Trego Hot Springs, we find no evidence for disequilibrium in either the U
or Th decay chains that may contribute to inaccurate age estimation (see
Supplementary Table 3). For Trego Hot Springs, the 226Ra/238U and
210
Pb/226Ra activity ratios (both 1.2 ± 0.1, Supplementary Table 3)
indicate minor U-series disequilibrium, but any resulting dose rate un
certainty is likely minimized given the high concentration of K in the
sample.
The blue TL derived a-values for these samples ranged from 0.18 to
0.21, in agreement with Berger (1991) who report a range from 0.08 to
0.36. Due to technical considerations, we were not able to carry out
alpha efficiency measurements on the red TL signal. This parameter
might differ between TL emissions (e.g., for flint, Richter and Krbet
schek, 2006). A larger uncertainty (~33%) was incorporated on the
a-value for red TL age calculation to account for the variability that may
present between the different TL emissions. Further work should be
carried out to test for the differences in alpha efficiency between the TL
emissions for volcanic glasses.
4.8. Blue and red TL ages
Fig. 8. Results of blue and red TL fading experiments for a series of Trego Hot
Springs (THS) aliquots. Data is normalized to the first measurement. Dashed
lines represent a logarithmic trend fit to the data. G-values are normalized to
2 days.
Final age calculations are reported in Table 3 and incorporate beta
and alpha dose rates determined from a sub-sample of the luminescence
dating sample, and a gamma dose rate modeled from representative
samples collected from the bounding sediments above and below the
luminescence dating sample. SAR-TL ages are fully consistent with in
dependent age control for both the fading-corrected blue TL and red TL
signals. Our SAR protocol applied regeneration doses across a limited
range (<400 Gy) which did not permit confident determination of the
saturation dose and thus the upper dating limit for these materials.
Previous applications of red TL on volcanic quartz have reported a
significantly higher dose saturation level relative to conventional UV or
blue TL approaches (e.g., Pilleyre et al., 1992; Miallier et al., 1994;
Fattahi and Stokes, 2003). Additional work should be carried out to
characterize saturation limits of both the blue and red TL emission from
volcanic glass.
Importantly, relative to red TL, blue TL ages are less precise (relative
errors of ~14% vs. 10%) owing to the additional errors that are intro
duced on the final age after fading correction. The fading correction
method proposed by Huntley and Lamothe (2001) is also limited to
young (<50 ka) samples that exhibit relatively low fading rates. Despite
yielding statistically equivalent ages, we propose that red TL be used
over blue TL particularly when dating older volcanic glass samples
and/or if a higher level of precision is required on the age.
itself, or both.
4.6. Fading tests
Consistent with the findings of Berger (1985, 1987) and Berger and
Davis (1992) we find that the blue TL emission from our volcanic glass
samples exhibits anomalous fading with average g-values ranging from
1.6 ± 1.0 to 2.9 ± 1.1%/decade (tc = 2 days) (Table 3, Fig. 8). G-values
listed in Table 2 represent an average from 5 aliquots per sample. These
average fading rates were used to correct the measured blue TL De values
following the method of Huntley and Lamothe (2001). The red TL
emission from Trego Hot Springs displays negligible fading over a period
of ~40 h (− 0.4 ± 1.2%/decade, tc = 2 days) (Table 3, Fig. 8). These
results are consistent with the work of Tsukamoto et al. (2007) which
demonstrated that the blue emission from volcanic quartz fades, while
the red does not.
4.7. Dose rate determination
Dose rates for the volcanic glass samples were typically dominated
by the external alpha and beta dose rates (together making up ~75–80%
Table 4
Elemental concentrations and dose rates used for age calculation.
Sample
Ua
(ppm)
Tha
(ppm)
Ka
(%)
a-value
External Alpha
Dose Rate (Gy/ka)
External Beta
Dose Rate (Gy/
ka)
External Gamma
Dose Rate (Gy/ka)b
Cosmic Dose
Rate (Gy/ka)
Internal Dose
Rate (Gy/ka)c
Total Dose
Rate (Gy/
ka)d
Turupah
Flat
Trego Hot
Springs
Wono
6.3 ±
0.6
2.3 ±
0.2
2.3 ±
0.2
19.0 ±
1.9
5.3 ±
0.5
6.0 ±
0.6
3.7
± 0.4
2.7
± 0.3
2.9
± 0.3
0.2 ±
0.05
0.2 ±
0.05
0.2 ±
0.05
6.1 ± 1.2
4.3 ± 0.4
1.7 ± 0.2
0.3 ± 0.03
0.8 ± 0.3
13.1 ± 1.3
1.6 ± 0.4
2.6 ± 0.3
1.1 ± 0.1
0.03 ± 0.003
0.2 ± 0.1
5.5 ± 0.5
1.6 ± 0.4
2.8 ± 0.4
1.1 ± 0.1
0.2 ± 0.02
0.3 ± 0.1
5.9 ± 0.6
a
Elemental concentrations provided here were determined from a subsample of the luminescence dating sample and used to determine external alpha and beta
contributions.
b
Estimates of external gamma dose rate were determined on the basis of elemental concentrations of U, Th, and K from representative samples collected from both
the bounding sediments above and below the luminescence dating sample and from the luminescence dating sample itself. See Supplementary Table 1 for the elemental
concentrations used in these determinations.
c
Elemental concentrations used for internal dose rate calculation can be found in Supplementary Table 2.
d
Dose rates assume a moisture content of 1 ± 5% for all samples.
9
Radiation Measurements 153 (2022) 106731
K. Rodrigues et al.
5. Conclusions
Benson, L.V., Smoot, J.P., Kashgarian, M., Sarna-Wojcicki, A., Burdett, J.W., 1997.
Radiocarbon ages and environments of deposition of the Wono and Trego Hot
Springs tephra layers in the Pyramid Lake Subbasin, Nevada. Quat. Res. 47,
251–260.
Berger, G.W., 1991. The use of glass for dating volcanic ash by thermoluminescence.
J. Geophys. Res. Solid Earth 96, 19705–19720.
Berger, G.W., 1987. Thermoluminescence dating of the Pleistocene Old Crow tephra and
adjacent loess, near Fairbanks, Alaska. Can. J. Earth Sci. 24, 1975–1984.
Berger, G.W., 1985. Thermoluminescence dating of volcanic ash. J. Volcanol. Geoth. Res.
25, 333–347.
Berger, G.W., Davis, J.O., 1992. Dating volcanic ash by thermoluminescence: test and
application. Quat. Int. 13–14, 127–130.
Berger, G.W., Huntley, D.J., 1983. Dating volcanic ash by thermoluminescence. PACT 9,
581592.
Bă
osken, J.J., Schmidt, C., 2020. Direct and indirect luminescence dating of tephra: a
review. J. Quat. Sci. 35, 39–53.
Brennan, B.J., Lyons, R.G., Phillips, S.W., 1991. Attenuation of alpha particle track dose
for spherical grains. Int. J. Radiat. Appl. Instrum. Part Nucl. Tracks Radiat. Meas. 18,
249–253.
Bursik, M., Sieh, K., Meltzner, A., 2014. Deposits of the most recent eruption in the
Southern Mono Craters, California: description, interpretation and implications for
regional marker tephras. J. Volcanol. Geoth. Res. 275, 114–131.
Chiavari, C., Martini, M., Sibilia, E., Vandini, M., 2001. Thermoluminescence (TL)
characterisation and dating feasibility of ancient glass mosaic. Quat. Sci. Rev. 20,
967–972.
Davis, J.O.J., 1978. Quaternary tephrochronology of the Lake Lahontan area, Nevada
and California. Nev. Archeol. Surv. Res. Pap. 7, 137.
Davis, J.O., 1983. Level of Lake Lahontan during deposition of the Trego Hot Springs
tephra about 23,400 years ago. Quat. Res. 19, 312–324.
Fattahi, M., Stokes, S., 2003. Dating volcanic and related sediments by luminescence
methods: a review. Earth Sci. Rev. 62, 229–264.
Galbraith, R.F., Roberts, R.G., Laslett, G.M., Yoshida, H., Olley, J.M., 1999. Optical
dating of single and multiple grains of quartz from Jinmium Rock Shelter, northern
Australia: Part I, experimental design and statistical models. Archaeometry 41,
339–364.
Galli, A., Martini, M., Sibilia, E., Vandini, M., Villa, I., 2011. Dating ancient mosaic
glasses by luminescence: the case study of San Pietro in Vaticano. Eur. Phys. J. Plus
126, 121.
Galli, A., Poldi, G., Martini, M., Sibilia, E., Montanari, C., Panzeri, L., 2006. Study of blue
colour in ancient mosaic tesserae by means of thermoluminescence and reflectance
measurements. Appl. Phys. A 83, 675679.
Gă
oksu, H., Fremlin, J., Irwin, H., Fryxell, R., 1974. Age determination of burned flint by a
thermoluminescent method. Science 183, 651–654.
Gu´
erin, G., Mercier, N., Nathan, R., Adamiec, G., Lefrais, Y., 2012. On the use of the
infinite matrix assumption and associated concepts: a critical review. Radiat. Meas.
47, 778–785.
Huntley, D.J., Lamothe, M., 2001. Ubiquity of anomalous fading in K-feldspars and the
measurement and correction for it in optical dating. Can. J. Earth Sci. 38,
1093–1106.
Kanemaki, M., Ninagawa, K., Yamamoto, I., Nakagawa, M., Wada, T., Yamashita, Y.,
Endo, K., 1991. Red thermoluminescence of volcanic glass fractions from tephras.
Int. J. Radiat. Appl. Instrum. Part Nucl. Tracks Radiat. Meas. 18, 81–88.
Kreutzer, S., 2021. analyse_SAR.TL: Analyse SAR TL measurements. Function version
0.3.0. In: Kreutzer, S., Burow, C., Dietze, M., Fuchs, M.C., Schmidt, C., Fischer, M.,
Friedrich, J., Mercier, N., Philippe, A., Riedesel, S., Autzen, M., Mittelstrass, D.,
Gray, H.J. (Eds.), Luminescence: Comprehensive Luminescence Dating Data
Analysis. R package version 0.9.14, 2021.
g/package=Luminescence.
Kuehn, S.C., Negrini, R.M., 2010. A 250 k.y. record of Cascade arc pyroclastic volcanism
from late Pleistocene lacustrine sediments near Summer Lake, Oregon, USA.
Geosphere 6, 397–429.
Lowe, D.J., 2011. Tephrochronology and its application: a review. Quat. Geochronol. 6,
107–153.
Lowe, D.J., Alloway, B.V., 2015. Tephrochronology. In: Rink, W.J., Thompson, J.M.
(Eds.), Encyclopaedia of Scientific Dating Methods. Springer, Dordrecht,
pp. 783–799.
Mejdahl, V., Bøtter-Jensen, L., 1997. Experience with the SARA OSL method. Radiat.
Meas. 27, 291–294.
Miallier, D., Faïn, J., Sanzelle, S., Pilleyre, Th, Montret, M., Soumana, S., Falgu`
eres, C.,
1994. Attempts at dating pumice deposits around 580 ka by use of red TL and ESR of
xenolithic quartz inclusions. Radiat. Meas. 23, 399–404.
Miller, C.D., 1985. Holocene eruptions at the Inyo volcanic chain, California:
implications for possible eruptions in Long Valley caldera. Geology 13, 14–17.
Morrison, R.B., 1964. Lake Lahontan: Geology of Southern Carson Desert, Nevada. U.S.
Government Printing Office, p. 156.
Murray, A.S., Wintle, A.G., 2003. The single aliquot regenerative dose protocol: potential
for improvements in reliability. Radiat. Meas. 37, 377–381.
Murray, A.S., Wintle, A.G., 2000. Luminescence dating of quartz using an improved
single-aliquot regenerative-dose protocol. Radiat. Meas. 32, 57–73.
Pilleyre, Th, Montret, M., Fain, J., Miallier, D., Sanzelle, S., 1992. Attempts at dating
ancient volcanoes using the red TL of quartz. Quat. Sci. Rev. 11, 13–17.
Pouget, S., Bursik, M., Cort´
es, J.A., Hayward, C., 2014. Use of principal component
analysis for identification of Rockland and Trego Hot Springs tephras in the Hat
Creek Graben, northeastern California, USA. Quat. Res. 81, 125–137.
This study has demonstrated the potential for SAR-TL dating of
volcanic glasses. Ages were measured from two distinct luminescence
color centers: blue and red. Fading corrected blue TL and red TL ages are
in good agreement with independent age control for the three samples
that we studied. Aside from imposing additional uncertainties on the
calculated age, the fading correction methods that we utilize for the blue
TL ages are also limited to young samples with low fading rates. We
recommend that red TL be used over blue TL methods, particularly when
dating older volcanic glass samples and/or if a higher level of precision
is required on the age. Our results show that both blue and red TL dating
of volcanic glass can accurately determine the timing of an eruption
event provided that the tephra bed is in primary depositional context or
has only experienced reworking over short post-depositional time scales.
We have demonstrated that TL dating of volcanic glass offers an
accurate and direct dating approach that has the potential to fill the gap
between the upper range of radiocarbon dating and the lower range of
K/Ar and Ar/Ar dating techniques. The results of this study are
encouraging and emphasize the need for continued research. Future
work should investigate the saturation limits for both blue and red TL to
better define the effective dating range for these approaches. At present,
the TL observations that we report cannot provide conclusive evidence
for the origin of the signal, but further work should seek to establish and
isolate a mineralogical source for both the blue and red TL emission
arising from volcanic glasses. Additional efforts should also be made to
extend testing to compositionally different volcanic glasses.
Declaration of competing interest
The authors declare that they have no known competing financial
interests or personal relationships that could have appeared to influence
the work reported in this paper.
Acknowledgments
This work was funded through an NSF grant (EAR 2026019) awar
ded to AKZ, a UNR Graduate Student Association Research Grant
awarded to KR and other in-house support from the Desert Research
Institute and Illinois State Geological Survey. The authors thank Jim
Feathers for gracious use of the alpha irradiation facilities at the Uni
versity of Washington. KR thanks Ken Adams at the Desert Research
Institute for field assistance.
Appendix A. Supplementary data
Supplementary data to this article can be found online at https://doi.
org/10.1016/j.radmeas.2022.106731.
References
Adamiec, G., Aitken, M.J., 1998. Dose-rate conversion factors : update. Anc. TL 16,
37–50.
Adams, K.D., 2010. Lake levels and sedimentary environments during deposition of the
Trego Hot Springs and Wono tephras in the Lake Lahontan basin, Nevada, USA.
Quat. Res. 73, 118–129.
Adams, K.D., 2003. Age and paleoclimatic significance of late Holocene lakes in the
Carson Sink, NV, USA. Quat. Res. 60, 294–306.
Aitken, M.J., 1985. Thermoluminescence Dating. Academic Press, London.
Aitken, M.J., 1998. Introduction to Optical Dating: the Dating of Quaternary Sediments
by the Use of Photon-Stimulated Luminescence. Oxford University Press, Oxford,
p. 267.
Aitken, M.J., 1985. Thermoluminescence Dating. Academic Press, London, p. 359.
Aitken, M.J., Bowman, S.G.E., 1975. Thermoluminescent dating: assessment of alpha
particle contribution. Archaeometry 17, 132–138.
Auclair, M., Lamothe, M., Huot, S., 2003. Measurement of anomalous fading for feldspar
IRSL using SAR. Radiat. Meas. 37, 487–492.
Benson, L., Liddicoat, J., Smoot, J., Sarna-Wojcicki, A., Negrini, R., Lund, S., 2003. Age of
the Mono Lake excursion and associated tephra. Quat. Sci. Rev. 22, 135–140.
10
K. Rodrigues et al.
Radiation Measurements 153 (2022) 106731
Sharp, T.G., Stevenson, R.J., Dingwell, D.B., 1996. Microlites and “nanolites” in rhyolitic
glass: microstructural and chemical characterization. Bull. Volcanol. 57, 631–640.
Sieh, K., Bursik, M., 1986. Most recent eruption of the Mono Craters, eastern central
California. J. Geophys. Res. Solid Earth 91, 12539–12571.
Tsukamoto, S., Duller, G.A.T., 2008. Anomalous fading of various luminescence signals
from terrestrial basaltic samples as Martian analogues. Radiat. Meas. 43, 721–725.
Tsukamoto, S., Murray, A.S., Huot, S., Watanuki, T., Denby, P.M., Bøtter-Jensen, L.,
2007. Luminescence property of volcanic quartz and the use of red isothermal TL for
dating tephras. Radiat. Meas. 42, 190–197.
Van den Bogaard, P., 1995. 40Ar/39Ar ages of sanidine phenocrysts from Laacher See
Tephra (12,900 yr BP): Chronostratigraphic and petrological significance. Earth
Planet Sci. Lett. 133, 163–174.
Wintle, A.G., 1973. Anomalous fading of thermo-luminescence in mineral samples.
Nature 245, 143–144.
Wood, S.H., 1977. Distribution, correlation, and radiocarbon dating of late Holocene
tephra, Mono and Inyo craters, eastern California. GSA Bull 88, 89–95.
Zic, M., Negrini, R.M., Wigand, P.E., 2002. Evidence of synchronous climate change
across the Northern Hemisphere between the north Atlantic and the northwestern
Great Basin, United States. Geology 30, 635–638.
Prescott, J.R., Hutton, J.T., 1994. Cosmic ray contributions to dose rates for
luminescence and ESR dating: large depths and long-term time variations. Radiat.
Meas. 23, 497–500.
Raymond, L.A., 2002. Petrology: the Study of Igneous, Sedimentary, and Metamorphic
Rocks, second ed. McGraw Hill, Boston, p. 720.
Redwine, J., 2013. The Quaternary History of Mohawk Valley, Northeastern California.
PhD Dissertation. University of Nevada, Reno.
Richter, D., Krbetschek, M., 2006. A new thermoluminescence dating technique for
heated flint. Archaeometry 48, 695–705.
Rufer, D., Gnos, E., Mettier, R., Preusser, F., Schreurs, G., 2012. Proposing new
approaches for dating young volcanic eruptions by luminescence methods.
Geochronometria 39, 48–56.
Russell, I.C., 1885. Geological History of Lake Lahontan: A Quaternary Lake of
Northwestern Nevada. U.S. Government Printing Office, p. 288.
Sanderson, D.C.W., Warren, S.E., Hunter, J.R., 1983. The TL properties of archaeological
glass. J. Counc. Eur. PACT 9 (II), 288–298.
Schmidt, C., Schaarschmidt, M., Kolb, T., Bỹchel, G., Richter, D., Ză
oller, L., 2017.
Luminescence dating of late Pleistocene eruptions in the Eifel volcanic field,
Germany. J. Quat. Sci. 32, 628–638.
Seward, D., 1974. Age of New Zealand Pleistocene substages by fission-track dating of
glass shards from tephra horizons. Earth Planet Sci. Lett. 24, 242–248.
11