Testing the effects of aspect and total insolation on luminescence depth profiles for rock surface exposure dating
Bạn đang xem bản rút gọn của tài liệu. Xem và tải ngay bản đầy đủ của tài liệu tại đây (850.11 KB, 10 trang )
Radiation Measurements 153 (2022) 106732
Contents lists available at ScienceDirect
Radiation Measurements
journal homepage: www.elsevier.com/locate/radmeas
Testing the effects of aspect and total insolation on luminescence depth
profiles for rock surface exposure dating
S. Fuhrmann a, *, M.C. Meyer a, L.A. Gliganic a, b, F. Obleitner c
a
Department of Geology, University Innsbruck, Austria
Centre for Archaeological Sciences, University of Wollongong, Australia
c
Department of Atmospheric and Cryospheric Sciences, University Innsbruck, Austria
b
A R T I C L E I N F O
A B S T R A C T
Keywords:
Rock surface dating
Luminescence dating
OSL
Calibration
Optically stimulated luminescence
Using luminescence to date the burial and exposure ages of rock surfaces has been a revolutionary new
geochronological approach developed and refined over the past decade. Rock surface exposure dating is based on
the principle that the depth to which the luminescence signal is bleached into a rock surface is dependent on the
duration of that rock surface’s exposure to sunlight. However, given the recentness of method development, the
effects of basic light exposure variables such as the orientation of rock surfaces and the incidence angle of
incoming light on bleaching depth have not been tested. We designed an experiment in which we controlled the
exposure duration (t) and orientation of granite and sandstone samples while measuring the light attenuation
coefficient (μ) and the photon flux at the rock surface (φ0 ) to determine the influence of spatial orientation of a
rock surface on its respective bleaching depth. Our results confirm that the opacity of the rock (μ) and the total
insolation have significant effects on the bleaching depth for vertically oriented surfaces. We also observed that
the bleaching depth is strongly related to the incidence angle at which the sunlight hits the rock surface, indi
cating that the effectiveness of bleaching of a given rock surface follows seasonal cycles. Our data suggest that
optimal calibration samples for rock surface exposure dating should be of the same lithology and have the same
geographical location and orientation of the target sample. Additionally, calibration samples should be collected
in year increments so that no season’s solar incidence angles are preferred.
1. Introduction
Over the last decades, optically stimulated luminescence (OSL)
dating has evolved into a well-established numerical dating technique in
the Quaternary Sciences that has seen a number of methodological in
ventions. Classical OSL dating allows determining the burial age of sandand silt-sized sediments from estimates of absorbed doses and dose rate
(Huntley et al., 1985; Rhodes, 2011). Recently, this approach has been
adapted to also determine the burial age of geological and archaeolog
ical rock surfaces (e.g. Chapot et al., 2012; Gliganic et al., 2021; Greilich
et al., 2005; Jenkins et al., 2018; Liritzis, 2011; Liu et al., 2019; Simkins
et al., 2013; Simms et al., 2011; Sohbati et al., 2012). This latter variant
of optical dating is referred to as OSL rock surface burial dating (RSbD)
and is based on the circumstance that all traps inside the crystalline
structure of a rock are filled with electrons, giving rise to a saturated OSL
signal upon optical stimulation. Daylight exposure causes these electron
traps to be gradually emptied in the topmost millimetres to centimetres
of a fresh rock surface and the OSL signal to be reset (or bleached). Upon
burial, a natural dose re-accumulates in the previously bleached rock
surface, due to naturally occurring ionizing radiation from the rock itself
and the surrounding sediment that shields the rock surface from further
daylight exposure. Hence, similar to sediment burial dating, estimates of
dose rate and (re-)accumulated dose in a given rock surface allow the
time since burial to be constrained.
The fact that light penetrates into rock surfaces, albeit on a mm to cm
scale only, and thus gradually bleaches the OSL signals, can also be
exploited to determine the time elapsed since a rock surface has been
subjected to daylight exposure. This approach is referred to as OSL rock
surface exposure dating (RSeD) and has been used to determine the age
of e.g. rock paintings (Chapot et al., 2012), negative flake scars (Gliganic
et al., 2021), or the emplacement of coastal tsunami boulders (Brill et al.,
2012) and other rock surfaces (Polikreti, 2007; Polikreti et al., 2003;
Sohbati et al., 2012).
The methodological foundation for RSeD has been laid by Polikreti
* Corresponding author.
E-mail address: (S. Fuhrmann).
/>Received 1 December 2021; Received in revised form 18 February 2022; Accepted 23 February 2022
Available online 26 February 2022
1350-4487/© 2022 The Authors. Published by Elsevier Ltd. This is an open access article under the CC BY license ( />
S. Fuhrmann et al.
Radiation Measurements 153 (2022) 106732
et al. (2003) and picked up and developed further by Sohbati et al.
(2011) and Laskaris and Liritzis (2011). Because daylight exposure is
gradually resetting the OSL signal in the topmost section of a fresh rock
surface a characteristic OSL-depth profile evolves over time, with no
OSL signal remaining at the very surface and a gradual (S-shaped) OSL
signal build-up with depth below the rock surface. RSeD exploits the
circumstance that the depth as well as the shape of the OSL bleaching
front is closely related to the time that has elapsed since the fresh rock
surface has first been exposed to light (Meyer et al., 2018; Sohbati et al.,
2012). Hence, deriving an exposure age from the depth and shape of an
OSL profile requires an accurate bleaching-with-depth model to be fitted
to the OSL data and the relvant model parameters to be constrained. The
currently most widely used model for RSeD is that of Sohbati et al.
(2012a,b), which is a double exponential function based on first order
luminescence kinetics from a single luminescence trap (Equation (1)):
L = L0 e−
σφ0 te−
μx
enough, that bleaching profiles develop and differences in bleaching
rates (φ0 ) can be obtained. The experiment was conducted on granite
and sandstone samples and the total insolation received by each sample
surface was monitored with pyranometers for the entire duration of the
experiment. The infrared-stimulated luminescence (IRSL) from feldspar
and the optically stimulated luminescence (OSL) signal of quartz was
examined from the granite and sandstone samples, respectively.
This experiment allowed us to (i) isolate φ0 from the other parame
ters of the model of Sohbati et al. (2012a,b), (ii) evaluate the relative
influence of φ0 on the OSL bleaching depths, and (iii) investigate the
relative importance of factors that impact φ0 directly, such as aspect and
inclination, total solar insolation and topographic shadowing effects.
The data presented here thus contribute to our understanding of the
complex interplay of processes responsible for propagation of OSL
bleaching fronts into rock surfaces and thus foster the development of
RSeD as a robust dating tool.
(1)
2. Materials and methods
In this model, L represents the luminescence signal at a given depth x
[mm] and L0 is the maximum luminescence signal intensity prior to
exposure to sunlight (i.e. the unbleached, saturated luminescence level
from the light protected interior of the rock). σ [cm2] is the photoioni
zation cross section and φ0 [cm− 2 s− 1] the incident solar photon flux at
the rock surface. Thus σφ0 represents the effective detrapping rate of the
luminescence signal at the surface, while μ [mm− 1] is the rock-specific
light attenuation coefficient and t delineates the exposure duration.
Both, μ and σ are rock and mineral specific parameters and thus directly
dependent on the sample lithology.
In order to calculate the correct exposure duration (t), RSeD requires
calibration of the model parameters μ and σ φ0 . Typically, this involves
the measurement of a known-age calibration sample (Sohbati et al.,
2012a,b; Gliganic et al., 2019). It has been suggested that the rock
surface used for calibrating the model parameters should be of the same
lithology as the rock surface targeted for dating and have a known
exposure history (Sohbati et al., 2012). Sometimes an independent rock
surface of known age is available at the sampling site for this calibration
(e.g., Sohbati et al., 2012a,b). Alternatively, a fresh calibration surface
in close spatial proximity to the sampling site can be artificially created
for that purpose (e.g. Gliganic et al., 2019). After some time to allow a
new OSL-depth profile to develop (usually at least one year), the site can
be re-visited and the calibration surface (for which the exposure time is
now well constrained) can be sampled and an OSL depth profile ob
tained. The model parameters μ and σ φ0 are derived by fitting equation
(1) to the calibration sample while using its known t (Gliganic et al.,
2019). Once μ and σ φ0 are derived the unknown rock surface exposure
durations from the dating samples can – in principle – be obtained.
Because of the necessity to calibrate key model parameters for RSeD
it follows that in order to obtain a correct rock surface exposure age the
lithology-dependent parameters σ and μ must be the same in the dating
and the calibration samples. Ideally, the lithology of the calibration
sample matches that of the target sample as closely as possible also in
terms of texture, grain size distribution and colour hue (Meyer et al.,
2018). It has been shown that even mm-scale lithological changes be
tween samples such as changes of the relative abundance of opaque
minerals (e.g. biotite), or changes in the inclination of foliation planes
can have a large impact on light tunnelling effects and thus OSL
bleaching depths and the overall accuracy of RSeD (Ou et al., 2018;
Meyer et al., 2018).
The same is true for φ0 , because any changes in the incoming photon
flux will result in a change in the bleaching rate and thus influence OSL
bleaching depths. The relative importance and influence of the model
parameter φ0 on OSL bleaching depths in relation to the other model
parameters has never been quantified. We designed an experiment in
order to investigate this influence empirically. The principal idea of the
experiment is to expose rock samples of identical lithologies to natural
sunlight at different aspects and inclinations for a time span long
2.1. Sample description
The natural bleaching experiments were performed on two types of
lithology: a phaneritic fine-grained granite with a homogeneous distri
bution of light and dark minerals and a fine-grained and light-coloured
sandstone (SOM 1). The granite is of unknown origin, but most probably
comes from the Variszian Moldanubicum in eastern Austria. It is
composed of quartz, potassium feldspar, plagioclase and biotite (SOM 1
a and c). The equigranular and fine-grained texture provides the granite
samples a rather homogenous greyish to whitish colour hue. The finegrained sandstone is from the Elbe sandstone mountains (Germany)
and consists almost entirely of well sorted, sub-rounded quartz grains,
with ancillary muscovite, rutile and tourmaline grains and lacks feldspar
(SOM 1b and d). Most sandstone samples show macroscopically distinct
brighter and darker bands (SOM 1 b) and thin section observations
revealed that in the darker bands quartz grains are frequently coated by
a thin film of hematite, while in the light bands hematite is almost nonexistent (SOM 1 d). The differently coloured sandstone bands were
deliberately targeted in this study and investigated separately.
2.2. Experimental setup
To make sure that no parts of the granite and sandstone samples were
exposed to light prior to the start of the bleaching experiment, the
outermost 5 cm of material of each sample were removed by sawing the
samples to blocks 10 × 10 × 4 cm in dimension under red light condi
tions. Their sides were masked with two layers of lightproof adhesive
tape to prevented light from entering the rock slabs laterally and thus to
ensure that light only interacted with the frontal sample surfaces (SOM 2
c). These blocks were glued to a wooden mount, each holding one
sandstone and one granite sample. The samples in their wooden mounts
were then installed on the roof of the freestanding building of the Uni
versity Innsbruck at 640 m above sea level (Bruno Sander Haus; N
47◦ 15′ 51,36"/E 11◦ 23′ 6,57"; SOM 2 b). The height of this building is 38
m and thus sufficient that the bleaching experiment could be conducted
well above the skyline of the city of Innsbruck, unaffected by shadowing
effects of any nearby buildings. Four samples were positioned on the
outside walls of the staircase enclosure on top of the building to face
approximately northwest (309◦ ), northeast (39◦ ), southeast (129◦ ) and
southwest (219◦ ), respectively. One sandstone and one granite sample
were placed horizontally (later also referred to as "Top"), i.e. with the
rock face being oriented at 90◦ relative to the other samples and facing
upward into the open sky (Supplementary online material SOM 2 b). All
samples were kept on the roof for 108 days, from June 6th to October
25th 2019.
The amount of solar insolation reaching each sample was measured
using pyranometers (Model SP-110 from Apogee Instruments) that were
2
S. Fuhrmann et al.
Radiation Measurements 153 (2022) 106732
facing the same direction as the samples (SOM 2 c). The SP-110 pyr
anometers record in the 360–1120 nm wavelength range and measure
total (i.e. direct and indirect) insolation with highest sensitivity in the
near infra-red due to respective filter characteristics (Apogee, 2020).
Data acquisition was configured to obtain one insolation measurement
per minute and record the hourly mean and standard deviation values
calculated from this data.
Two types of calibrations were performed to ensure that the aspectspecific insolation values obtained via the SP-110 pyranometers are both
accurate and precise. Firstly, Apogee Instruments specifies a factor for
converting the readout signal (mV) to irradiance (W m− 2) of 5 W m− 2
per mV. To be sure that this conversion factor is correct over the course
of a day (and thus at different solar incident angles) we calibrated each
sensor against a high precision global radiation sensor (Schenk-Stern
pyranometer type 8102) that is permanently mounted on the rooftop of
the Bruno Sander Haus as part of long-term meteorological observations.
Corrections between 1 and 10% had to be applied to the sensors,
depending on the time of the day (SOM 3). Secondly, the pyranometers
were cross-calibrated against data from a high-precision global solar
radiation sensor (Kipp & Zonen - type CM22) situated in a semi
automatic weather station at Innsbruck airport (⁓2.5 km from the
Bruno-Sander-Haus) to ensure the overall accuracy of the insolation
values (SOM 3). The reference instruments are operated within moni
toring networks of the Austrian National Weather Services (ZAMG) and
conform to highest international standards (Olefs et al., 2016).
reader was used for measuring the OSL of the quartz-rich extracts from
the sandstone samples. Optical stimulation was performed with blue
LEDs (470 ± 30 nm, ~80 W/cm2) at 125 ◦ C for 55 s and the OSL
detected through a 7.5 mm Hoya U304 filter. We measured the Lx/Tx
values of quartz, which involved preheating to 220 ◦ C for 30 s followed
by IR stimulation for 50 s at 50 ◦ C to reduce any eventual contributions
from feldspar grains, followed by blue LED stimulation at 125 ◦ C for 55 s
(Banerjee et al., 2001; Murray and Wintle, 2000). The test dose here was
9.8 Gy. These post-IR blue OSL signals were background corrected by
integrating the initial 1.6 s of the decay curve and subtraction the signal
from the subsequent 4 s (early background subtraction; (Cunningham
and Wallinga, 2010)).
2.4. RGB scans as proxy for rock colour
We investigated the variation of rock colour in all samples following
Meyer et al. (2018). Therefore, we sawed the sample blocks in half and
scanned the rock surfaces adjacent to each drill core trace. We used an
Epson GT 10000 + scanner and scanned at a resolution of 1200 dpi. The
colour profiles were extracted using the “plot profile” tool of the image
processing tool ImageJ (Schindelin et al., 2012). In addition, for each
core, an average RGB value was calculated from the sum of the three
colour channels between 0 and 8 mm depth, which is approximately
equivalent to depth interval in which all cores achieve saturation.
3. Results
2.3. Sample preparation, IRSL and OSL measurements and protocols
3.1. Insolation data
After a bleaching duration of 108 days, the sandstone and granite
samples were transferred into the OSL laboratory for investigating their
OSL and IRSL-depth curves, respectively. Under subdued red-light lab
oratory conditions the samples were cored through their full depth (4
cm) using a water-cooled diamond core drill and cores of 7.8 mm
diameter were obtained. Multiple cores were obtained from each sample
surface.
For the granite samples, three cores were drilled per aspect and the
cores sliced at 0.85 mm increments using a Metkon Micracut 152 watercooled low-speed saw and a sawblade of 0.25 mm thickness. The
thickness of the resulting slices was between 0.4 and 0.8 mm. Intact rock
slices obtained from these granite cores were mounted directly into
aluminium cups for measurement of their IRSL signals. For the sand
stone samples, at least two cores were obtained for each light- and darkcoloured sandstone band per sample (SOM 1 d). The sandstone was too
fragile to obtain intact rock slices, but instead crumbled during sawing.
The rock fragments for each slice were collected using filter paper, dried
and gently crushed with an agate mortar to obtain the original grain size
fraction. The grain size distribution obtained via this procedure was
checked using ImageJ (Schindelin et al., 2012) on images obtained for
each aliquot at the end of the OSL measurements inside the Risø TL/OSL
reader with a built in sample camera. A grain size range of 50–250 μm
was determined in this way for all aliquots. In order not to lose too much
of the scarce sample material, we refrained from etching with HF. For
the subsequent OSL measurements, the material retrieved from each
sandstone slice was split onto three aliquots (2 mm mask size).
All luminescence measurements were conducted in a Risø TL/OSL
DA20 reader with a conventional coarse-grain-calibrated 90Sr/90Y beta
source (Bøtter-Jensen et al., 2010). The granite aliquots were stimulated
using IR LEDs (870 nm, ~145 W/cm2) and the IRSL signals measured via
an Electron Tubes Ltd 9635 photomultiplier tube and a Corning 7–59
and Schott BG-39 filter combination (“blue filter pack”). A post-IR IRSL
protocol was used for these measurements (Buylaert et al., 2012). This
protocol involved preheating to 250 ◦ C for 60 s, followed by an IR
stimulation for 100 s at 50 ◦ C (IR50) and a second IR stimulation for 100
s at 225 ◦ C. The test dose was 79 Gy. For the IR50 and the pIR-IRSL225
signals, the initial 2 s minus a background from the last 10 s of the
stimulation time were used for signal calculation. The same TL/OSL
The insolation data was recorded over a duration of 108 days (from
June 11th to October 25th 2019). The values recorded by the horizon
tally oriented high precision global radiation sensor (Ph. Schenk, Type
8102) were nearly identical to those measured using the horizontally
oriented calibrated Apogee SP 110 pyranometer, indicating that the
Apogee SP 110 pyranometer based data are accurate (Fig. 1a–d). Hence,
the total insolation measured by each pyranometer was integrated over
the entire duration of the experiment and ranges from 209 to 590 Wm− 2,
depending on aspect (Table 1).
Because the insolation data were determined on an hourly base,
aspect-specific daily insolation curves can be generated and studied. The
shape of the daily insolation curves from selected arbitrary sunny and
cloudy days during summer and autumn are shown in Fig. 1. On a sunny
summer day (10th of July; Fig. 1a), the NE sensor (facing 39◦ ) records a
maximum in the early morning. The SE (129◦ ) sensor also receives most
insolation in the morning, but with an insolation peak much broader
compared to the NE sensor. The horizontal sensor (referred to as Top)
attains the insolation peak around midday while the SW (219◦ ) sensor
receives its insolation maximum in the afternoon. The insolation peak of
the NW (309◦ ) facing sensor occurs between 4 and 6 p.m. and only
during the summer months (Fig. 1a).
On cloudy days, this typical diurnal pattern of aspect-specific
maximum insolation does not develop. The timing of the daily max
ima of the individual sensors can vary significantly between cloudy
days, because it is strongly controlled by the spatiotemporal cloud
coverage pattern, which can be quite different for each cloudy day
(Fig. 1c and d). For example, full cloud coverage occurred on the af
ternoon of July 11th (Fig. 1c) and the morning of July 12th (Fig. 1d),
blocking direct sunlight. Under such conditions scattered (diffuse) solar
radiation prevails, and all vertical facing sensors receive broadly similar
amounts of radiation, while the horizontal sensor still measures higher
intensities compared to the vertical sensors (Fig. 1c and d). Short
clearing periods in the morning of the 11th of July and in the afternoon
of the 12th July resulted in the development of weak insolation peaks of
the respective (i.e. sun-facing) aspects. In October, when the sun’s po
sition is much lower compared to July, the SE, SW as well as the top
sensors still record pronounced insolation maxima, while all other
3
S. Fuhrmann et al.
Radiation Measurements 153 (2022) 106732
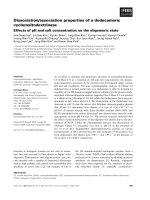
Fig. 1. Daily course of the measured insolation on two sunny ((a) and (b)) and two cloudy days ((c) and (d)). Subfigure (e) shows modelled, extraterrestrial (see
Section: Results - insolation data) and aspect specific daily insolation curves. Comparison of those model results to the measured data confirms the validity of the
measurements. The labels on the x-axis of subfigure (a), (b), (c), (d) and (e) indicate the month-date and hour of the day. Each plotted line presents one of the four
compass directions (NW, NE, SE, SW), the Top sensor was placed horizontally (facing upwards). The global radiation was measured with a high-precision global solar
radiation sensor and is used for reference and comparison with the Top sensor only. Subfigure (f) shows the sum of insolation at different aspects on sunny or cloudy
days during summer and autumn.
data analysis. The NE facing sandstone sample had no light band, hence
only cores of the dark sandstone type could be sampled in this case
(Table 1).
For all samples, the sensitivity-corrected natural signals (Lx/Tx)
from each slice were normalized to the corresponding core’s saturation
level. The normalization factor was the weighted mean value of the
deepest five Lx/Tx values, showing a saturation plateau, typically at
depths >40–60 mm). A least-square best-fit algorithm based on Leh
mann et al. (2019) was used to fit these luminescence-depth data via the
first order model of Sohbati et al. (2012) (SOM 4 and 5). Fig. 2 shows
these best-fit models that are based on at least one and up to three cores
per sample surface. Furthermore, each individual core was also fitted
with the same algorithm (SOM 4 and 5).
Both the light and dark sandstone bands in the sandstone samples
that were exposed in a SE direction were bleached least (Fig. 2a and b).
The OSL-depth profiles from the other aspects lie rather closely together
and are bleached around 1 mm deeper than the OSL-depth profiles from
the SE facing sample surface. Overall, the OSL-depth profiles from the
light sandstone bands are bleached about 1 mm deeper compared to
OSL-depth profiles from the dark sandstone bands. The slope of the
bleaching profiles varies significantly between cores, regardless of
aspect and sandstone colouring (Fig. 2a and b).
In the granite sample, the NW side was bleached least (~2.5 mm)
and the SW side was bleached almost 2 mm deeper. All other directions
lie between those two extremes and their bleaching depths are similar.
In general, the IR50 signal bleaches around 1 mm deeper compared to
the pIR225 signal (Fig. 2c and d).
Table 1
Total insolation measured in by each pyranometer all five orientations and in
tegrated over the entire duration of the experiment and numbers of cores from
each orientation and lithology that were used for constructing OSL and IRSL
depth curves.
Aspect
NW (309◦ )
NE (39◦ )
SE (129◦ )
SW (219◦ )
Horizontal
Total insolation over the
entire experiment
[kWm− 2]
225
209
335
414
590
Number of accepted cores
Sandstone
dark
Sandstone
light
Granite
2
2
2
2
2
2
0
2
2
3
2
3
3
3
3
insolation peaks are significantly less well developed (Fig. 1b). Inter
estingly, the absolute insolation values measured with the SE and SW
sensors are similar in magnitude on a sunny day of October and July
(Fig. 1a and b).
Furthermore, the total daily insolation on a sunny day is approxi
mately three to five times that on a cloudy day, regardless of exposition
of the sensor. The minimum insolation was measured on the northeast
side on a cloudy day (38 w m− 2, Fig. 1d) and the highest insolation was
measured on the horizontal sensor on a sunny day (305 W m− 2; Fig. 1a).
3.2. OSL and IRSL depth profiles
From each sample surface and each aspect (i.e. granite, light and
dark sandstone bands facing into NW, NE, SE and SW direction as well as
up-ward (horizontal) into the open sky), three drill cores were obtained
and sliced (Table 1). For some sandstone cores slicing suffered from a
large depth error, and consequently these cores had to be rejected for
3.3. RGB profiles
In Fig. 3, the RGB depth profiles that were obtained adjacent to each
core are shown. For the granite cores, the RGB values fluctuate widely
around a value of 380 ± 200. In contrast, the RGB profiles of the
4
S. Fuhrmann et al.
Radiation Measurements 153 (2022) 106732
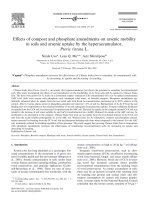
Fig. 2. Best fit models for the normalized OSL and IRSL depth profiles from the dark (a) and light (b) sandstone layers and the IR50 (c) and pIRIR225 (d) signals from
granite. Note that for each aspect all cores were combined before the bleaching-with-depth model of Sohbati et al. (2012a,b) was applied. The individually fitted
cores are shown in SOM 4 and 5, respectively.
Fig. 4c and e. This is corroborated in Fig. 4d and f, which show R2 values
0.17 and 0.08 for the IR50 and pIR225 signals, respectively, which are
statistically insignificant compared to the sandstone samples (Fig. 4b).
However there appears to be some control of total insolation on
bleaching depth. For both the IR50 and pIRIR225 signals, the vertically
oriented samples (i.e., NW, NE, SW, and SE) clearly show that bleaching
depth increases with total insolation. Interestingly, this relationship
does not apply to the horizontally oriented top surface, which received
the highest total insolation but was only bleached to a moderate depth
(relative to the other surfaces).
sandstone cores are smooth with RGB values for the light and dark
sandstone layers of ~700 and ~600 respectively (Fig. 3). Overall, all
sandstone cores plot rather close to the maximum sum of RGB values of
800 underscoring that this particular sandstone type is very light.
3.4. Correlation of insolation versus bleaching depth and RGB values
Fig. 4a, c and e show the total insolation that accumulated over the
course of the experiment for each core from each aspect (labelled NW,
NE, SE, SW and Top in Fig. 4a) on the x-axis. Each core is colour-coded
according to its average RGB value (colour bar, right hand side), while
the bleaching depth (i.e. depth at which the luminescence signal is at
50% of its maximum intensity) for each core is plotted on the y-axis.
These figures allow examination of total insolation versus bleaching
depth while considering the rock colour of each core (RGB values) at the
same time. The same data are shown in a different way in Fig. 4b, d, and
f in order to investigate the effect of rock colour (RGB values on the x
axis) on bleaching depth (y axis) while still keeping track of the total
insolation ranges via a colour coding scheme of the individual cores
(compare legend in Fig. 4b).
The sandstone samples (Fig. 4a and b) show significant intra core
variability in bleaching depth for each aspect (the bleaching depth
varies between 1 and 2 mm for each aspect; Fig. 4a) and no clear rela
tionship between bleaching depth and total insolation can be observed,
neither in Fig. 4a nor b. However, greater bleaching depths appear to be
associated with higher RGB values (i.e. lighter rock colour; Fig. 4a). This
becomes also obvious in Fig. 4b, where a robust correlation between
RGB value and bleaching depth (R2 = 0.55) can be observed, while a
correlation between total insolation (colour coding of cores) and
bleaching depth is lacking.
In case of the granite samples the aspect-specific intra-core vari
ability in bleaching depth is smaller than in sandstone samples (ranging
from 0.5 to 1 mm only; Fig. 4c and e). This is true for both, the IR50 and
pIR225 signals. Furthermore, the IR50 signal is bleached approximately
1 mm deeper than the pIRIR225 signal, corroborating many other
studies showing that the pIRIR signal is generally more difficult to
bleach than the IR50 signal (Freiesleben, 2021). There appears to be no
correlation between bleaching depth and core specific RGB values in
3.5. Incidence angle of the sun and the sample surface
To test the effect of incidence angle of incoming light on the
bleaching depth of the luminescence signal in our rock samples, the
range of angles of incoming insolation needed to be assessed. With
incidence angle we refer to the angle between the sample surface of our
rock slabs and the sun, which can be anywhere between 90◦ (solar ra
diation hits the sample surface perpendicularly) and 0◦ (solar radiation
runs parallel to rock surface). Following Whiteman and Allwine (1986),
we calculated (i) the amount of extra-terrestrial insolation that hits each
sample surface and (ii) the mean relative incidence angles between the
sun and the sample surfaces. The extra-terrestrial insolation model was
run over the entire duration of the bleaching experiment (i.e. 108 days)
at a 5-min increment resolution (Fuhrmann, 2021), but does not
consider any topographic shadowing effects.
Aspect-specific daily insolation curves were extracted from the
model and are shown in Fig. 1e. Comparing these extra-terrestrial (i.e.
modelled) aspect-specific daily insolation curves (Fig. 1e) with the ones
measured via our pyranometers (Fig. 1a) reveals that their shapes and
the insolation patterns are broadly similar to each other, confirming the
validity of the model. The only exceptions are the insolation curves from
the NE (39◦ ) and NW (309◦ ) aspects, where the modelled insolation
maxima are offset from the insolation maxima measured via our pyr
anometers; i.e. the NE pyranometer attains its maximum after the
modelled value and vice versa for the NW aspect (Fig. 1a versus e).
Because the city of Innsbruck, where the experiment was run, is sur
rounded by up to 2700 m high mountains, this effect is readily explained
5
S. Fuhrmann et al.
Radiation Measurements 153 (2022) 106732
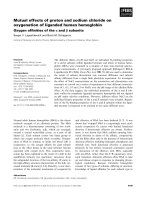
Fig. 3. RGB profiles of all cores from the granite (left column) and the sandstone samples (right column). The profiles start at the surface of the rock samples (0 mm)
and end at 8 mm depth, which is for both rock types well within the saturation plateau auf the IRSL and OSL-depth curves. Note that on the y axis the sum of the 3
RGB channels (red, green and blue) are plotted.
by the local topography (SOM 6). Hence, the model was corrected for
any local topographic shadowing effects in order to obtain an accurate
probability density distribution of incident angles for each aspect. In
Fig. 5a the resulting kernel density plots of the incident angles are shown
together with the median value. The surfaces facing SW and NE show the
highest median values (44.1◦ and 39.9◦ , respectively). The surface fac
ing NW and SW experience the lowest median angles (19.3◦ and 25.3◦ ,
respectively). The horizontal surface that faces upwards into the open
sky (receiving the highest total direct and indirect insolation), reveals a
median incidence angle of 34.7◦ .
Fig. 5b shows the linear regression between the bleaching depth and
the incidence angle. The R2 values show significant correlation for the
dark sandstone layers as well as for the IR50 and pIR225 signals (0.71,
0.45, 0.55 respectively).
4. Discussion
We have observed different bleaching depths for each orientation in
all luminescence signals (OSL, IR50 and pIR225). There are various
factors, in the rock samples themselves as well as environmental con
ditions (orientation, shielding effects caused by local topography,
weather conditions), that potentially influence μ and σφ0 and therefore
have an effect on the bleaching rate. Those factors are discussed indi
vidually below.
4.1. Variation of insolation with aspect
The amount of total insolation received by our pyranometers and
thus rock sample surfaces is the sum of direct, indirect and diffuse
6
S. Fuhrmann et al.
Radiation Measurements 153 (2022) 106732
Fig. 4. Relation of bleaching depth, total insolation and RGB values for the granite and sandstone samples. (a, c and e): Insolation versus bleaching depth. The
brightness of the rock (sum of RGB values) is indicated by brighter and darker colours. (b, d and f): RGB values versus bleaching depth. The amount of total insolation
is shown by colour (see legend above Fig. 4b).
Fig. 5. (a) Smoothed probability density plots of the incident angles with the sun and the sample surfaces. The median incidence angle for the entire duration of the
experiment (108 days) is shown for each orientation. (b) Linear regression of those median incidence angles with the bleaching depths for the different luminescence
signals and the respective R2 values.
7
S. Fuhrmann et al.
Radiation Measurements 153 (2022) 106732
insolation and varies at any given time with (i) the incidence angle
between the sample surface and the sun, (ii) the local meteorological
conditions, and (iii) shadowing, scattering and reflection effects due to
the local topography. The incoming insolation is also strongly depen
dent on (iv) the total amount of time for which a given rock surface was
exposed to the sum of the insolation components.
As far as direct solar radiation is concerned, the exposure angle
changes on diurnal and seasonal timescales and strongly influences the
solar insolation for each sample surface. Generally speaking, solar
insolation is highest when the exposure angle is at 90◦ to the sample
surface and solar insolation decreases with each degree of lowering of
the exposure angle. Our experiment took place during summer to early
autumn (6th June 2019 to 25th October 2019) and thus at a time when
the sun followed a relatively steep apparent arc-like path in the sky, with
a maximum solar altitude angle of 66◦ for Innsbruck on the 21st of June
(summer solstice) and a minimum solar altitude angle of 30◦ at the end
of the experiment (25th of October). Hence, during summer, the top
sensor was in direct sunlight for most of the day and the exposure angle
attained up to 66◦ . This is considered the main reason why the top sensor
recorded the highest amount of total insolation during the course of this
experiment (590 kW m− 2; Table 1). The sensor facing SE on the other
hand, is exposed to direct sunlight for many hours daily as well, but for
the majority of the experiment the exposure angle was low (e.g. 33◦ on
the 21th of June) because of the high apparent position of the sun during
summer. The exposure angle for the SE sensor increased significantly
towards autumn and was 66◦ on October 25th due to the much flatter
apparent arc-like path of the sun at that time of the season. Because of
such an increase in the exposure angle, on October 22nd the SE sensor
received a higher maximum insolation compared to the top sensor
(Fig. 1b). In our experiment the insolation was recorded during the
summer season only rather than an entire year. Hence, the insolation
record for the winter season is missing and incomplete for the spring and
autumn months. This explains why the total amount of insolation
determined for the SE-facing sensor and thus the SE facing rock panel
was only 335 kW m− 2 (Table 1).
The total insolation is also dependent on the local meteorological
conditions. High cloud coverage blocks direct insolation and thus de
creases the amount of total insolation, leaving diffuse (scattered) inso
lation as the only source of incoming solar radiation. On heavily
overcast days, scattered light reaches the sensors rather uniformly from
all directions and thus the sensor aspect does not play a major role
anymore. This is documented in Fig. 1c and d, where heavy cloud
coverage in the afternoon of July 11th (Fig. 1c) and morning of July 12th
(Fig. 1d) diminished the insolation differences for all sensors. The
exception is the upward facing top sensor, which received diffuse light
but from a non-truncated hemispheric field of view, whereas all
vertically-oriented sensors facing SE, SW, NE or NW, received light from
a truncated hemisphere (i.e. the lower half of the hemispheric field of
view is missing). Another consequence of a high cloud coverage is the
shift of wavelengths towards infra-red. Compared to a sunny day, the
spectrum on a cloudy day consists of a higher proportion of near infrared light because of a lack of incoming direct sunlight due to shadow
ing from the clouds as well as back-scattered solar radiation from Earth’s
surface by the cloud cover.
The local topography is an additional major factor controlling the
amount of aspect-specific direct insolation. This is especially relevant in
an inner alpine setting such as the Inn valley, and thus for our experi
ment. The Inn valley is trending approximately NNE - SSW, and sunrise
and sunset in Innsbruck on June 21th (longest day during experiment)
occur at 53◦ and 307◦ azimuth, while on October 25th (shortest day
during experiment) sunrise and sunset happen at 107◦ and 253◦ azimuth,
respectively (Tiris, 2021); SOM 6). Particularly high azimuth values at
sunsets during summer months are the reason for the high insolation
values measured by the pyranometer oriented to the northwest – direct
sunlight reaches the sensor right before sunset. These large differences
of azimuth values between summer and autumn are caused by the
seasonally changing arc path of the sun as well as topographic effects of
local mountain ranges. Topography of the neighboring mountains also
cause a later sunrise and earlier sunset at certain times (see SOM 6).
In summary, we find that the aspect-specific total insolation is the
result of a complex interplay between at least four major parameters:
total exposure time, exposure angle, local meteorological conditions and
topography.
4.2. Dependency of bleaching depth of OSL and IRSL profiles on rock
opacity
Data shown in Fig. 4(b) confirms that bleaching depth significantly
correlates with the colour of the rock (R2 = 0.55) in the tested sandstone
samples. This correlation suggests that the opacity of the rock exerts a
more important control on the bleaching depth of our sandstone samples
than insolation. Insofar these results are congruent with the model of
Sohbati et al. (2012a,b).
By contrast, the equigranular and fine-grained texture of the granite
samples does not provide any predominantly lighter or darker areas.
Consequently, no relationship between the rock colour and bleaching
depth could be observed (compare Fig. 4d and f), with R2 values of 0.17
and 0.08, respectively). These samples, thus, do not allow an assessment
of the relationship between μ and bleaching depth, since μ is relatively
consistent between cores.
4.3. Dependency of bleaching depth of OSL and IRSL profiles on
insolation
The homogeneous texture and the small difference of colour hue in
the granite compared to the sandstone allows an isolated view on the
σ φ0 parameter and its impact on the formation of the bleaching front.
In the case of the vertically oriented NW, SE and SW granite samples,
the bleaching depth shows some relationship with the total insolation.
However, for the IR50 and pIR225 signals, the bleaching depth can be
deeper in cores that were exposed to low total insolation than in samples
that were exposed to higher total insolation. This is obvious, when
comparing the bleaching depths of the cores from the SW and hori
zontally facing granite samples; even though the horizontal sensor was
exposed to 50% more sunlight than the southwest sensor, the southwest
facing sample is bleached deeper than the top sample (Fig. 4c and e). In
addition, the sample that was oriented to the NE is bleached deeper than
the sample that was oriented to the NW, even though it was exposed to
less total insolation. These findings suggest that scattered or indirect
light is not as effective in bleaching luminescence signals as direct
sunlight is and that the bleaching rate in rock surfaces is strongly
influenced by the angle at which sunlight strikes the rock surface.
4.4. Dependency of bleaching depth of OSL and IRSL profiles on incidence
angle between the sun and the rock surface
In addition to the aspect-specific duration of insolation and the rock
opacity (μ), a factor that has a high impact on the φ0 parameter in the
bleaching process is the incidence angle between the sun and the rock
surface over the entire period of exposure to the sun. High incidence
angles (close to 90◦ ) are more efficient in bleaching than low incidence
angles (close to 0◦ ). In all the samples we investigated, the bleaching
depth strongly correlates with the mean incidence angle during the
experiment period (Fig. 5a and b). In summary, this means that for a
given exposure duration, direct sunlight would bleach more deeply than
indirect or scattered light. This implies that the azimuth and inclination
at which bleaching is most effective will vary for every study location;
for example, in the northern hemisphere, a south-facing rock surface
that is inclined at an angle equal to the geographical latitude will be
most efficient for bleaching. For dating purposes, these results indicate
that calibration surfaces should have the same exposure aspect
(including shadowing effects from local topography) as the target
8
S. Fuhrmann et al.
Radiation Measurements 153 (2022) 106732
unknown age dating surfaces, so that the bleaching profiles will be as
similar as possible. A simple way of achieving this is to collect the target
surface and return later to collect the sampling scar, which would have a
precisely known exposure age and an identical lithology and exposure
aspect as the target dating sample, thereby making it a best-case cali
bration sample.
Acknowledgements
Many thanks to Tanguy Racine and Benjamin Lehman for the fruitful
discussions about data modelling and data analysis. We also thank the
Department of Atmospheric and Cryospheric Sciences of the University
of Innsbruck for providing the pyranometers. Intercomparison data were
kindly provided by the Austrian National Weather Services (ZAMG).
Finally we thank an anonymous reviewer for constructive feedback on
the manuscript.
4.5. Timescales
This experiment covers a period of 4 summer months (June–Oc
tober). In summer months, the zenith angle of the sun is lower than in
winter months. Because of this, the median incidence angles we
observed for the vertically oriented samples during our experiment were
generally lower than they would be if the experiment had lasted for an
entire year. If the experiment had lasted an entire year, we would expect
that the observed differences in incident angle dependency of the
bleaching depth would be further aggravated. The horizontal samples
would be exposed longer to sunlight coming from low angles, while the
vertically oriented SE and SW samples would be illuminated from (more
bleaching effective) high incidence angles for longer. This implies that
there are seasonal cycles for the effectiveness of bleaching for a given
rock surface (i.e., the bleaching effectiveness at a given site will change
throughout the year according to season and orientation of the rock
surface). From a RSeD application perspective, these results indicate
that calibration surfaces should be exposed for at least a year and should
be collected in approximately year increments, so that the calibration
surface is not biased by any given season’s insolation angle.
Appendix A. Supplementary data
Supplementary data to this article can be found online at https://doi.
org/10.1016/j.radmeas.2022.106732.
References
Apogee, 2020. SP-110 Pyranometer: owner’s manual. Retrieved 15. Feb. 2020 from.
/>Banerjee, D., Murray, A.S., Bøtter-Jensen, L., Lang, A., 2001. Equivalent dose estimation
using a single aliquot of polymineral fine grains. Radiat. Meas. 33 (1), 73–94.
/>Bøtter-Jensen, L., Thomsen, K.J., Jain, M., 2010. Review of optically stimulated
luminescence (OSL) instrumental developments for retrospective dosimetry. Radiat.
Meas. 45 (3), 253–257. />Brill, D., Klasen, N., Brückner, H., Jankaew, K., Scheffers, A., Kelletat, D., Scheffers, S.,
2012. OSL dating of tsunami deposits from Phra Thong Island, Thailand. Quat.
Geochronol. 10, 224–229. />Buylaert, J.-P., Jain, M., Murray, A.S., Thomsen, K.J., Thiel, C., Sohbati, R., 2012.
A robust feldspar luminescence dating method for Middle and Late Pleistocene
sediments. Boreas 41 (3), 435–451. />Chapot, M.S., Sohbati, R., Murray, A.S., Pederson, J.L., Rittenour, T.M., 2012.
Constraining the age of rock art by dating a rockfall event using sediment and rocksurface luminescence dating techniques. Quat. Geochronol. 13, 18–25. https://doi.
org/10.1016/j.quageo.2012.08.005.
Cunningham, A.C., Wallinga, J., 2010. Selection of integration time intervals for quartz
OSL decay curves. Quat. Geochronol. 5 (6), 657–666. />quageo.2010.08.004.
Freiesleben, T., 2021. Developing and Testing Models for Rock Surface Dating Using
Optically Stimulated Luminescence. Technical University of Denmark.
Fuhrmann, S., 2021. Python Code to Calculate Incident Angle and Extra-terrestrial Solar
Radiation on Inclined Surfaces. Github Repository. Retrieved 22.11.2021 from.
/>Gliganic, L.A., Meyer, M.C., May, J.-H., Aldenderfer, M.S., 2021. Direct dating of lithic
surface artifacts using luminescence. Sci. Adv. 7 (23) />sciadv.abb3424.
Gliganic, L.A., Meyer, M.C., Sohbati, R., Jain, M., Barrett, S., 2019. OSL surface exposure
dating of a lithic quarry in Tibet: laboratory validation and application. Quat.
Geochronol. 49, 199–204. />Greilich, S., Glasmacher, U.A., Wagner, G.A., 2005. Optical dating of granitic surfaces.
Archaeometry 47 (3), 645–665. />x.
Huntley, D.J., Godfrey-Smith, D.I., Thewalt, M.L.W., 1985. Optical dating of sediments.
Nature 313, 105–107. />Jenkins, G.T.H., Duller, G.A.T., Roberts, H.M., Chiverrell, R.C., Glasser, N.F., 2018.
A new approach for luminescence dating glaciofluvial deposits - high precision
optical dating of cobbles. Quat. Sci. Rev. 192, 263–273. />quascirev.2018.05.036.
Laskaris, N., Liritzis, I., 2011. A new mathematical approximation of sunlight attenuation
in rocks for surface luminescence dating. J. Lumin. 131 (9), 1874–1884. https://doi.
org/10.1016/j.jlumin.2011.04.052.
Lehmann, B., Herman, F., Valla, P.G., King, G.E., Biswas, R.H., . Evaluating post-glacial
bedrock erosion and surface exposure duration by coupling in-situ OSL and 1⁰Be
dating. Earth Surf. Dynam. Discuss. 1–38,
2019. />Liritzis, I., 2011. Surface dating by luminescence: an overview. Geochronometria 38 (3),
292–302. />Liu, J., Cui, F., Murray, A.S., Sohbati, R., Jain, M., Gao, H., Li, W., Li, C., Li, P., Zhou, T.,
Chen, J., 2019. Resetting of the luminescence signal in modern riverbed cobbles
along the course of the Shiyang River, China. Quat. Geochronol. 49, 184–190.
/>Meyer, M.C., Gliganic, L.A., Jain, M., Sohbati, R., Schmidmair, D., 2018. Lithological
controls on light penetration into rock surfaces – implications for OSL and IRSL
surface exposure dating. Radiat. Meas. 120, 298–304. />radmeas.2018.03.004.
Murray, A.S., Wintle, A.G., 2000. Luminescence dating of quartz using an improved
single-aliquot regenerative-dose protocol. Radiat. Meas. 32 (1), 57–73. https://doi.
org/10.1016/s1350-4487(99)00253-x. />article/pii/S135044879900253X.
5. Conclusion
In our controlled exposure experiment the influence of φ0 (photon
flux at the rock surface) has been quantified empirically. Our data
confirms that the bleaching depth is dependent on the light attenuation
coefficient (μ) and, for vertically oriented samples, on the amount of
total insolation. However, we also observed that bleaching rate in rock
surfaces is strongly related to the incidence angle at which sunlight hits
the rock surface. This hereto neglected variable may have a substantial
impact on the accuracy of calibration in RSeD. In order to accurately
calculate exposure ages of rock surfaces, σ φ0 and μ must be estimated
correctly. For this, it is imperative to use the same lithology for the
calibration sample as the sample itself. We strongly advise to find a piece
of calibration sample that is of the same lithology and with identical
rock properties (e.g. colour hue (μ)) as the dating sample. Our results
suggest that for correct estimation of σφ0 , the spatial orientation (azi
muth and inclination) of the calibration sample must match the dating
sample as closely as possible. The approach of using the sampling scar as
a calibration surface (Gliganic et al., 2019) is an optimal way of doing
this – the calibration surface will have an identical azimuth and inci
dence angle as the target sample.
There will be seasonal cycles in the effectiveness of bleaching
depending on the geographical location and the orientation of the rock
sample; therefore, we suggest calibration samples should be left in year
increments so that no season is preferred, though the more years a
surface is exposed, the less the seasonal differences in bleaching will
matter. When trying to date an unknown age surface, a calibration
surface exposed for ~18 months (e.g., 2 winters and 1 summer such as
Gliganic et al., 2019) is unlikely to yield an estimate of σφ0 that would be
appropriate for accurately modelling the target surface.
Declaration of competing interest
The authors declare that they have no known competing financial
interests or personal relationships that could have appeared to influence
the work reported in this paper.
9
S. Fuhrmann et al.
Radiation Measurements 153 (2022) 106732
Simkins, L.M., Simms, A.R., DeWitt, R., 2013. Relative sea-level history of Marguerite
Bay, Antarctic Peninsula derived from optically stimulated luminescence-dated
beach cobbles PANGAEA. />Simms, A.R., DeWitt, R., Kouremenos, P., Drewry, A.M., 2011. A new approach to
reconstructing sea levels in Antarctica using optically stimulated luminescence of
cobble surfaces. Quat. Geochronol. 6 (1), 50–60. />quageo.2010.06.004.
Sohbati, R., Murray, A., Jain, M., Buylaert, J.-P., Thomsen, K., 2011. Investigating the
resetting of OSL signals in rock surfaces. Geochronometria 38 (3), 249–258. https://
doi.org/10.2478/s13386-011-0029-2.
Sohbati, R., Murray, A.S., Buylaert, J.-P., Almeida, N.A.C., Cunha, P.P., 2012a. Optically
stimulated luminescence (OSL) dating of quartzite cobbles from the Tapada do
Montinho archaeological site (east-central Portugal). Boreas 41 (3), 452–462.
/>Sohbati, R., Murray, A.S., Chapot, M.S., Jain, M., Pederson, J., 2012b. Optically
stimulated luminescence (OSL) as a chronometer for surface exposure dating.
J. Geophys. Res. Solid Earth 117 (B09202), 1–7. />2012jb009383.
Tiris, 2021. Sonnengangberechnung Tirol. Retrieved 12. 04. 2021 from. ol.
gv.at/web/index.cfm.
Whiteman, C.D., Allwine, K.J., 1986. Extraterrestrial solar radiation on inclined surfaces.
Environ. Software 1 (3), 164–169. />
Olefs, M., Baumgartner, D.J., Obleitner, F., Bichler, C., Foelsche, U., Pietsch, H.,
Rieder, H.E., Weihs, P., Geyer, F., Haiden, T., Schă
oner, W., 2016. The Austrian
radiation monitoring network ARAD – best practice and added value. Atmos. Meas.
Tech. 9 (4), 1513–1531. />Ou, X., Roberts, H., Duller, G., Gunn, M., Perkins, W., 2018. Attenuation of light in
different rock types and implications for rock surface luminescence dating. Radiat.
Meas. 120, 305–311. />Polikreti, K., 2007. Detection of ancient marble forgery: techniques and limitations.
Archaeometry 49 (4), 603–619. />x.
Polikreti, K., Michael, C.T., Maniatis, Y., 2003. Thermoluminescence characteristics of
marble and dating of freshly excavated marble objects. Radiat. Meas. 37 (1), 87–94.
/>science/article/pii/S1350448702000884.
Rhodes, E.J., 2011. Optically stimulated luminescence dating of sediments over the past
200,000 years. Annu. Rev. Earth Planet Sci. 39, 461–488. />annurev-earth-040610-133425.
Schindelin, J., Arganda-Carreras, I., Frise, E., Kaynig, V., Longair, M., Pietzsch, T.,
Preibisch, S., Rueden, C., Saalfeld, S., Schmid, B., Tinevez, J.-Y., White, D.J.,
Hartenstein, V., Eliceiri, K., Tomancak, P., Cardona, A., 2012. Fiji: an open-source
platform for biological-image analysis. Nat. Methods 9 (7), 676–682. https://doi.
org/10.1038/nmeth.2019.
10