Spectroscopic investigations of infrared-radiofluorescence (IR-RF) for equivalent dose estimation
Bạn đang xem bản rút gọn của tài liệu. Xem và tải ngay bản đầy đủ của tài liệu tại đây (4.23 MB, 8 trang )
Radiation Measurements 153 (2022) 106733
Contents lists available at ScienceDirect
Radiation Measurements
journal homepage: www.elsevier.com/locate/radmeas
Spectroscopic investigations of infrared-radiofluorescence (IR-RF) for
equivalent dose estimation
´lez *, Markus Fuchs
Mariana Sontag-Gonza
Department of Geography, Justus Liebig University, Giessen, Germany
A R T I C L E I N F O
A B S T R A C T
Keywords:
Radiofluorescence
IR-RF
Spectroscopy
K-feldspar
Luminescence dating
QEMSCAN
Infrared radiofluorescence (IR-RF) is a technique with the potential to date sediment deposition beyond 1000 Gy.
However, the total IR-RF signal is composed of several emissions whose separate characteristics are still poorly
understood. We obtained RF emission spectra for two sediment samples dominated by K-feldspar in the wave
lengths ~600–1000 nm over a wide dose range of up to 4000 Gy to discuss possible effects of neighbouring
emissions on the conventional IR-RF De estimation via a photomultiplier tube, which yields a signal integration
over a wavelength range of more than 30–40 nm. The studied samples included a modern age and a fieldsaturated one to assess the emissions’ characteristics at different dose ranges. For these samples, we find no
significant influence of neighbouring emissions to the De obtained from the wavelength range typically used for
IR-RF.
1. Introduction
possibility of a small but not insignificant signal contribution from
neighbouring emissions at both higher and lower wavelengths, i.e.,
further into the IR and at red wavelengths. The latter is reportedly un
stable (Trautmann et al., 1998; Krbetschek et al., 2000), so special
consideration should be given to its possible overlap with the main
IR-RF peak.
Trautmann et al. (1998) identified such red RF peaks in five feldspar
samples of different mineralogy with variable signal intensity in com
parison with other RF peaks in the IR to UV range. Unlike the IR-RF
emission, the red emission signal grows with increasing dose (Traut
mann et al., 1998; Krbetschek et al., 2000; Schilles, 2002; Erfurt and
Krbetschek, 2003). By fitting the RF spectrum of a laboratory-dosed
K-feldspar sample (500 Gy additive dose), Krbetschek et al. (2000)
showed that the tail of the red emission centred at ~1.77 eV (700 nm)
extends at least until 1.38 eV (900 nm) and, so, would be picked up in
IR-RF measurements targeting the main IR emission. Similar observa
tions were made by Schilles (2002), who added that the characteristics
of the red RF emission peak can be sample-dependent, with relatively
high variability between four K-feldspar samples: fitting with Gaussian
functions yielded peak centres ranging 1.65–1.73 eV (751–717 nm) and
standard deviations ranging 0.04–0.13 eV (the IR-RF peaks of these
samples were somewhat narrower, ranging 0.03–0.07 eV). Part of this
variability might arise from the presence of not only one, but two
overlapping red RF emission peaks, at 1.68 and 1.77 eV (738 and 700
Radiofluorescence (RF) is the luminescence occurring during expo
sure of a mineral to ionizing radiation. The infrared (IR) RF emission of
potassium (K) feldspar can be used as a dating technique to establish the
time since sediment deposition (Trautmann et al., 1998; 1999a; 1999b).
This technique has two main advantages over other common
luminescence-based dating techniques: a datable range an order of
magnitude higher than that of the optically stimulated luminescence of
quartz and a higher signal stability (i.e., no loss of signal due to the
phenomenon of ‘anomalous fading’) than the infrared stimulated lumi
nescence of K-feldspar (e.g., Murari et al., 2021b). However, determi
nation of IR-RF ages from samples with independent age controls has
had only mixed success (e.g., Degering and Krbetschek, 2007; Wagner
et al., 2010; Buylaert et al., 2012; Frouin et al., 2017; Kreutzer et al.,
2018; Murari et al., 2021a). Potential reasons for this include insuffi
cient correction for sensitivity changes, sample-specific signal instability
or interference between different RF signals. Investigation of the latter
possibility is the focus of this work.
Whereas the IR-RF signal obtained from the ~1.43 eV (865 nm)
emission is broadly reported to be thermally and athermally stable,
based on laboratory experiments (e.g., Krbetschek et al., 2000; Traut
mann et al., 2000; Frouin et al., 2017) and successful dating of Middle
Pleistocene age deposits (e.g., Wagner et al., 2010), there is a known
* Corresponding author.
E-mail address: (M. Sontag-Gonz´
alez).
/>Received 7 December 2021; Received in revised form 19 February 2022; Accepted 25 February 2022
Available online 28 February 2022
1350-4487/© 2022 Elsevier Ltd. All rights reserved.
M. Sontag-Gonz´
alez and M. Fuchs
Radiation Measurements 153 (2022) 106733
nm, respectively), as suggested by fitting RF spectra measured at 7 K of
one K-feldspar sample (Kumar et al., 2018).
There can also be a signal overlap of the targeted IR emission with
one of longer wavelength. While such an emission was first described by
Erfurt and Krbetschek (2003) centred on 910 nm (1.36 eV) to improve
the fit quality of a broad asymmetric peak in the IR range of their RF
spectra, subsequent measurements at 7 K (where peaks are narrower)
have confirmed its presence and described its dose response as being
very similar to that of the main IR-RF emission (Kumar et al., 2018;
Riedesel et al., 2021). The seven low-temperature K-feldspar samples
measured in these studies display a range of peak positions and widths.
The emission peaks described by Erfurt and Krbetschek (2003) as being
centred at 1.43 and 1.36 eV (865 and 910 nm), i.e. the main IR-RF
emission and a possibly contaminating one, respectively, presumably
correspond to the newly described emission peaks whose peak centres
range 1.40–1.42 eV (885–874 nm) and 1.30–1.35 eV (953–917 nm),
respectively.
Further investigations on the emissions neighbouring the main IR-RF
peak are needed to assess their possible effects on equivalent dose (De)
estimation for dating. In this paper, we obtain RF spectra of two Kfeldspar samples of known ages and compare the De obtained from the
different wavelength ranges associated with the discussed RF peaks. IRRF De values have previously been obtained for these samples (Table 1):
(i) a modern sample yielded a De value not consistent with zero, sug
gesting a residual dose of ~20 Gy for IR-RF measurements and (ii) a
sample of geologic age yielded a finite De value (i.e., not saturated),
suggesting the onset of field-saturation occurs earlier than expected, at
~1000–1500 Gy (Murari et al., 2021a). A better understanding of the
spectroscopic composition of the IR-RF signal might help elucidate the
reported luminescence behaviours.
mineralogical characterization of the samples at the CSIRO Australian
Minerals Research Centre, Western Australia. Samples were prepared
following previously published methods (Meyer et al., 2013), which
included impregnating the grains in resin, polishing and carbon-coating.
Mineralogical maps were created by (i) scanning an electron beam over
the resin block and detecting the resulting X-ray emissions with
energy-dispersive detectors and (ii) determining the chemical compo
sition of each pixel by comparing the X-ray spectrum with a database of
characteristic spectra of known mineral phases using a peak integral
method.
Both samples are dominated by K-feldspar (88.8–96.2 wt%), with
small proportions of other minerals, e.g., albite, quartz or muscovite, as
detailed in Table 2.
2.3. Instrumental setup for luminescence measurements
RF measurements were performed on a lexsyg research device
(Freiberg Instruments GmbH; Richter et al., 2013) containing an annular
beta source (90Sr/90Y; Richter et al., 2013) calibrated with a standard
quartz sample. We assume an uncertainty of 5% for this calibration. RF
was detected by a Hamamatsu H7421-50 photomultiplier tube (PMT)
filtered through band-pass filters centred at 850 nm (FWHM = 40 nm) or
710 nm (FWHM = 10 nm), respectively named Chroma D850/40 and FB
710/10. Alternatively, RF was filtered through a FELH 500 nm long pass
filter and then transmitted through a fibre optic light guide to a built-in
spectrometer constituted by an Andor Shamrock 163 Czerny-Turner
type spectrograph containing a diffraction grating with 300 lines/mm
and a blaze wavelength of 500 nm coupled to an Andor Newton DU920P
back-illuminated charge-coupled device (CCD) camera. Pixel positions
were wavelength-calibrated using a third-degree polynomial fit of 10
fluorescent light emission peaks between 588 and 976 nm. The
wavelength-dependent spectrometer efficiency was calibrated accord
ing to the efficiencies declared by the manufacturers of the long pass
filter, the fibre optic attachment lens, the CCD camera, the spectrograph
mirror coatings and grating. RF was always measured at 70 ◦ C, following
2. Material and methods
2.1. Sample selection and preparation
Two samples of different geological provenances were selected to
test for differences in their luminescence behaviour (Table 1) and were
prepared following standard procedures to extract the K-feldspar frac
tion, as detailed elsewhere (Murari et al., 2021a). Sample Gi326 origi
nates from a Triassic sandstone near Bayreuth, Germany and has an
expected dose of ~500 000 Gy, (Murari et al., 2021a). Sample Gi361
(also called LUM1225 in Murari et al. (2021a) and CUD 1-E in Kunz et al.
(2010)) was taken from a modern coastal dune in Cuddalore, south-east
India. This sample was prepared by the Leibniz Institute for Applied
Geophysics (LIAG Hannover, Germany) and its age was determined by
quartz optically stimulated luminescence (OSL) to be 61 ± 5 a (De =
0.10 ± 0.01 Gy; Kunz et al., 2010).
Medium-sized aliquots (~4 mm) each containing hundreds of coarse
grains of 90–200 μm (Gi326) or 150–200 μm (Gi361) in diameter were
mounted on stainless steel cups with silicone oil.
Table 2
Mineralogical sample composition determined by QEMSCAN. The classifications
‘alkali feldspar’ and ‘plagioclase’ refer to a mineral composition between the
endmembers in a ternary system.
2.2. Mineralogical characterization
An automated system of quantitative evaluation of minerals by
scanning electron microscopy (QEMSCAN©; FEI Company) was used for
Mineral
Gi361 (wt%)
Gi326 (wt%)
Feldspar series
Endmember K-feldspar
Alkali feldspar
Endmember albite
Plagioclase
Quartz
Muscovite
Biotite/Phlogopite
Kaolinite
Pyroxene
Fe Aluminosilicate
Fe Silicate
Amphibole
Rutile/Anatase
Ilmenite
Ti-mineral trap
Others
97.7
96.2
0.2
1.1
0.2
0.8
0.3
0.2
0.1
0.0
0.8
0.0
0.0
0.0
0.0
0.0
0.0
94.1
88.8
1.1
4.2
0.0
3.6
1.2
0.0
0.2
0.7
0.0
0.0
0.0
0.1
0.0
0.1
0.0
Table 1
Sample details.
Code
Size (μm)
Location
Context
IR-RF De (Gy)a
Reference
Gi361
Gi326
150–200
90–200
Cuddalore, SE India
Bayreuth, Germany
Modern coastal dune
Triassic sandstone
18.6 ± 9.7
1259 ± 179
Murari et al. (2021a) as LUM1225; Kunz et al. (2010) as CUD 1-E
Murari et al. (2021a)
a
Previous IR-RF De estimates obtained in Giessen using the same luminescence reader as in this work equipped with a PMT and 850 nm (FWHM = 40 nm)
interference filter (Murari et al., 2021a).
2
M. Sontag-Gonz´
alez and M. Fuchs
Radiation Measurements 153 (2022) 106733
Frouin et al. (2017). Each measured channel corresponds to 10 and 19 s
integration time for detection with the PMT and the spectrometer,
respectively. Samples were bleached using the built-in “solar simulator”
with emissions in the following wavelengths using the power output
shown in brackets: 365 nm (9 mW), 462 nm (55 mW), 525 nm (47 mW),
590 nm (32 mW), 625 nm (100 mW), and 850 nm (84 mW). The relative
intensities of the different LEDs correspond to those suggested by Frouin
et al. (2015).
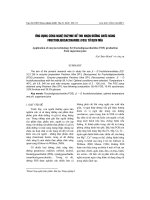
~300 Gy and then a saturating signal increase until the end of the
measurement at ~4000 Gy (Fig. 1e). Sample Gi361 only displays the
saturating increasing signal (Fig. 1d).
The behaviour observed for sample Gi326 can be explained by the
superposition of two different emissions. From the PMT measurements
alone, we cannot assess what emission causes the decreasing signal at
~710 nm, as it could originate from an emission at this wavelength
(both emissions of relatively similar brightness) or from the tail of a
brighter emission at higher or lower wavelengths. Spectroscopic mea
surements might elucidate this issue.
2.4. Spectral data analysis
4. RF spectra
Instrumental background was removed from RF spectra by sub
tracting at each pixel position the mean counts (n = 2500 channels)
obtained in the measurement of an empty disc. No dose dependent
signal was observed in the background measurement. Outliers caused by
cosmic rays or other background radiation (visible as sharp peaks in the
spectra) were removed using two procedures. First, the R function
apply_CosmicRayRemoval() (Kreutzer, 2020) contained in the Lumi
nescence package (Kreutzer et al., 2021) was applied iteratively a total
of six times, repeating the option ‘smooth’ (a running median of length 3
following Tukey (1977)) along the time axis and then the wavelength
axis. Second, we iteratively removed data points whose first derivative
on the wavelength axis (calculated using the absolute difference quo
tient) exceeded a threshold of 10% of the 90% quantile of the entire RF
measurement. Removed data points were replaced by the mean of data
points on either side. The efficiency correction was applied using the R
function apply_EfficiencyCorrection() (Kreutzer and Friedrich, 2021).
Conversion of the wavelength to energy scale occurred through the R
function convert_Wavelength2Energy() (Kreutzer, 2021a).
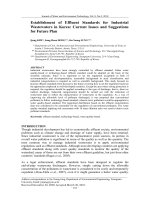
RF spectra were obtained for three aliquots of each sample following
a standard protocol (Table 3). After background and cosmic ray removal
(see section 2.4), the energy spectrum of each channel was fitted with a
sum of four Gaussian functions between 1.31 eV (950 nm) and 1.91 eV
(650 nm), to focus on the red-IR range and avoid the etaloning effect at
high wavelengths. Sums of between two and six Gaussians were also
tested, but four yielded the best visual fit with the measured data and
was the model with fewest components which gave an R2 value of >0.98
for both samples. Fitting occurred in two steps. First, the function was
fitted to each spectrum of the regenerative dose measurement allowing
for variation of the peak centres, widths and amplitudes. The resulting
median peak centres and widths were then fixed for each aliquot (i.e.,
4× peak centres and widths for each regenerative dose measurement). In
the next step, the spectrum of each channel of the natural and of the
regenerative dose measurements was fitted allowing only for variation
of the peak amplitude. Representative fit examples are shown for both
samples in Fig. 2a and b. Overall, the fits lead to low fit residuals, but we
note that for sample Gi326, and to a lesser extent for Gi361, there is a
slight dose-dependency between 0 and ~750 Gy (Fig. 2c and d).
In addition to the four fitted peaks, there also appears to be an IR-RF
3. PMT decay shapes
The RF emissions of both samples were characterised using PMT
measurements in two wavelength ranges to capture the main IR-RF
emission and a possibly contaminating red RF emission, respectively:
(i) ~825–875 nm using an 850/40 nm band-pass filter and (ii)
~700–720 nm using a 710/10 nm band-pass filter. RF was measured
after bleaching previously measured aliquots for 25 000 s with the “solar
simulator” and then waiting an additional 2 h. The IR-RF emissions of
the two samples follow similar dose responses up to 4000 Gy regener
ative dose, though that of sample Gi326 decreases faster, as shown in
Fig. 1a–c. In contrast, the emissions around 710 nm differ starkly be
tween the samples, with an initial signal decay for sample Gi326 up to
Table 3
Radiofluorescence (RF) measurement protocol. RF was detected with a
spectrometer.
Step
Treatment
Purpose
1
2
3
4
5
Preheat at 70 ◦ C for 900 s
RF at 70 ◦ C for 30 000 s
“Solar simulator” bleaching for 25 000 s
Pause for 2 h
RF at 70 ◦ C for 65 000 s
Stabilise temperature
Obtain natural dose curve
Fully remove signal
Reduce phosphorescence
Obtain regenerative dose curve
Fig. 1. Regenerative dose response curves obtained using a PMT and either (a, b, c) an 850/40 nm or (d, e, f) a 710/10 nm filter for two samples: (a, d) Gi361
(orange) and (b, e) Gi326 (blue). (c, f) show the same data as in previous plots on a logarithmic time scale and normalised to the highest signal intensity. Different
aliquots were used for each measurement.
3
M. Sontag-Gonz´
alez and M. Fuchs
Radiation Measurements 153 (2022) 106733
Fig. 2. RF spectra of samples (a) Gi361 and (b) Gi326 taken after 1000 Gy regenerative dose, fitted with a sum of four Gaussian functions (green curve) from 1.31 eV
(950 nm) to 1.91 eV (650 nm). The fit residuals across the whole regenerative dose measurement series (3250 spectra), normalised to the maximum RF signal of each
channel, are shown in (c) for Gi361 and in (d) for Gi326.
emission centred at ~1.25–1.30 eV (950–990 nm). However, due to the
high noise in this wavelength range and to the limit of our calibration
being at 976 nm, we did not attempt to fit a function to it. Should there
indeed be a peak in this wavelength range, its tail would overlap with
those of the other two IR peaks.
The two-step fitting procedure ensures all channels of a measure
ment have the same peak centres and widths, allowing dose response
curves to be built from the amplitudes of each peak and ensuring that the
natural and regenerative dose response curves are directly comparable.
However, by applying the median peak parameters of the regenerative
dose curve to fit the natural dose one, this method is blind to possible
sensitivity changes between the natural and regenerative dose response
curves. Therefore, as a reliability check, the natural dose measurement
should also be fitted allowing for variation of the peak centres, widths
and amplitudes and the results compared to the peak parameters ob
tained from the regenerative dose spectra. Here, variations of 0–6 nm
and 0.00–0.01 nm were observed for the median peak centres and
widths, respectively, suggesting there was no significant change be
tween the RF emissions in the natural and regenerative measurements.
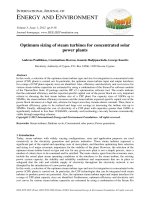
Representative dose response curve examples are shown for one
aliquot of each sample in Fig. 3a and b. As expected, the signals from the
two IR-RF peaks (light blue and navy blue curves) decrease with
increasing dose for both samples. However, whereas the amplitudes
from both red RF peaks of sample Gi361 increase with dose, those of
sample Gi326 are more complicated. The peak amplitude at 795 nm
(brown curve; regenerative dose) has an initial decrease until a few
hundred Gy, after which the signal appears saturated, and the peak
amplitude at 680 nm (red curve; regenerative dose) follows a similar
pattern as observed in the PMT measurement at ~710 nm (see Fig. 1e),
with an initial decay and then a rise. This suggests that the 4-peak model
is insufficient to describe this spectrum, possibly because of the presence
of strongly overlapping additional peaks with opposite behaviour with
respect to dose. It should, thus, only be regarded as a rough approxi
mation for this sample.
The signal proportions of the individual emissions relative to the
total signal in the wavelength range that would be measured using a
PMT and an 850/40 nm filter (considering their wavelength-dependent
efficiencies) are shown in Fig. 3c and d. Since the different emissions
have different behaviours with dose, the relative proportion of the red
emissions at 680–800 nm increases in relation to the IR emissions with
increasing dose, but even after 4000 Gy regenerative dose, they corre
spond to at most 4–5% of the total signal. Due to the low filter trans
mission and PMT efficiency at high wavelengths, the 917–919 nm peak
has only a minute contribution of ~0.1%. Additionally, we observe only
small differences of <0.5% relative signal contribution of the different
peaks between the natural and regenerative dose measurements of
sample Gi361 (Fig. 3c, bottom), indicating insignificant wavelengthdependent sensitivity changes; since this is a modern sample, the dose
ranges should be directly comparable between natural and regenerative
dose measurements.
5. Influence on IR-RF De
Despite the small proportion of the neighbouring RF emissions
relative to the main IR-RF peak, the former might lead to inaccuracies in
De estimation, especially due to the changing signal contribution at
different doses. We investigated this possibility by calculating the De
values in two ways: either using the amplitudes of the fitted functions or
from the total signal integration at different wavelengths.
4
M. Sontag-Gonz´
alez and M. Fuchs
Radiation Measurements 153 (2022) 106733
Fig. 3. (a, b) Natural and regenerative dose response
curves of the amplitudes of the four fitted Gaussian
functions of one representative aliquot of (a) Gi361
and (b) Gi326. The peak centre wavelengths are
stated for each peak. (c, d) The signal proportion from
natural and regenerative doses of the four functions
to the total signal that would be transmitted in the
conventionally measured wavelength range with a
PMT and an 850/40 nm filter is shown in absolute
values (main plots) and in percentages (bottom plots)
for samples (c) Gi361 and (d) Gi326.
5.1. Spectrum fitting
We obtained De values for the two fitted IR peaks of each of three
aliquots per sample by sliding the natural dose curves onto the corre
sponding regenerative dose curves obtained in section 4 horizontally
and vertically (‘slide’ method) to account for sensitivity changes using
the R function analyse_IRSAR.RF() (Kreutzer, 2021b). An example of De
estimation is shown in Fig. 4 for the main IR-RF peak of one aliquot of
sample Gi326; example dose response curves are shown in Fig. 3a and b
for all peaks.
Whereas the long natural dose measurement of 30 000 s (equivalent
to ~2000 Gy) was useful in section 4 to compare the emission contri
butions between the natural and regenerative dose curves, using the full
natural dose measurement length for De estimation would limit the
obtainable De to ~2300 Gy, since during the sliding algorithm the nat
ural dose curve cannot slide further than the end of the regenerative
dose curve (i.e., after sliding, no “tail” of the natural dose curve is
allowed). Only the portion of the natural dose signal measured between
200 s and 10 000 s (~13 and 670 Gy) was used to assess the fit in the
sliding algorithm. Removal of the initial channels, as suggested by
Buylaert et al. (2012), avoids the effect of a possible ‘initial rise’ com
mon in IR-RF signals (summarised in Murari et al., 2021b) and removal
of the final channels increases the upper dating limit to ~3700 Gy. The
remaining channels not used for fitting can still be used to visually assess
the fit (shown in grey in Fig. 4).
Considering the three aliquots of sample Gi361, the higherwavelength IR emission (919 nm) leads to a weighted mean De value
of 46.2 ± 10.9 Gy, whereas the lower wavelength IR emission (876–879
nm) leads to a weighted mean De of − 11.1 ± 2.3 Gy. Negative IR-RF De
values have been reported previously and are explained by an incom
plete bleaching with the “solar simulator” relative to the natural
Fig. 4. Spectroscopic RF De estimation using the 874 nm peak amplitude of one
aliquot of sample Gi326. The De (indicated by the red dashed line) is obtained
by sliding the natural dose measurements (blue circles) on the regenerative
dose measurements (black crosses) until an optimal fit between the curves is
reached. The extent of vertical slide for sensitivity change correction is shown
as a blue arrow between dashed lines. The right-hand y-axis shows the signal
intensity relative to the saturation of the regenerative dose measurement. The
dashed grey line indicates the initial saturation of the natural signal.
5
M. Sontag-Gonz´
alez and M. Fuchs
Radiation Measurements 153 (2022) 106733
bleaching (Buylaert et al., 2012). Interestingly, previous PMT-De esti
mates obtained for this sample in eight laboratories range 15.1 ± 1.4 to
59.5 ± 8.1 Gy (Murari et al., 2021a), suggesting the PMT system, in
which ~95% of the transmitted signal comes from 830 to 875 nm, might
yield an average of the two overlapping IR peaks with different
bleachabilities.
For sample Gi326, the two IR-RF peaks yield indistinguishable (at
1σ) weighted mean De values of 1583.4 ± 376.8 Gy (917 nm) and
1458.9 ± 165.7 Gy (874–875 nm). These are slightly higher than the
PMT-De previously obtained in Giessen of 1259 ± 179 Gy, but
compatible with the IR-RF De range obtained for this sample by seven
other laboratories of 1081 ± 117 to 1539 ± 438 Gy (Murari et al.,
2021a). As can be seen in Fig. 4, the portion of the natural dose curve not
used for fitting has a substantially worse agreement with the regenera
tive dose curve than the portion used for fitting. We also tested using the
whole natural curve in the fitting procedure, which led to a good fit for
the whole curve and increased the resulting De to 1644.2 ± 224.2 Gy
(917 nm) and 1725.7 ± 143.7 Gy (874–875 nm). To maintain compa
rability with the work of Murari et al. (2021a), who only measured the
initial 10 000 s (~750 Gy at time of measurement), here and in the next
section we focus on the results using the shorter measurement range, but
point out that these results suggest sensitivity changes occur during the
natural dose measurement for both IR peaks.
We also calculated the proportion of saturation of the natural signal
of both IR peaks for all aliquots. We first normalised the RF dose
response curve of each peak, so that the beginning and end of the
regenerative dose curve were set to zero and 100%, respectively, rep
resenting the fully-bleached and saturated states. We defined the zerosaturation signal intensity as the maximum RF signal value within the
first 100 channels of the regenerative dose measurement, since the first
measurement channel isn’t necessarily the highest, due to, e.g., a
possible ‘initial rise’ of the signal. The signal intensity at full-saturation
was chosen to be the median RF signal of the 100 last channels of the
regenerative dose measurement to account for the measurement un
certainty of individual channels.
The relative saturation of each channel of the natural dose mea
surement was then determined for each peak by normalising the
sensitivity-corrected natural dose curve (i.e., considering the vertical
offset that leads to the best fit in the ‘slide’ method) with the same pa
rameters as the corresponding regenerative dose curve. The final rela
tive saturation of the natural signal (dashed grey line in Fig. 4) was then
defined as the minimum relative saturation percentage in the first 15
channels of the natural measurement to account for the possibility of an
‘initial rise’.
The IR-RF signals of the two samples were expected to be at opposite
extremes in terms of signal saturation. Indeed, the mean saturation of
the natural RF signal of Gi326 was 86% for both IR peaks (average of
three aliquots for each peak) and that of Gi361 was 8% (917 nm peak)
and − 7% (876–879 nm peak), following the pattern described for the De
values estimated for these peaks.
5.2. Total signal integration
The continuous measurements of the spectrometer also allow for
investigations into signal saturation and De calculation to be made
across the whole measured wavelength range without any of the as
sumptions necessary for fitting regarding the number and nature of
emissions (Fig. 5).
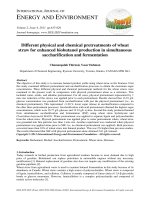
The natural signal saturation was calculated for each wavelength
using the same normalisation as described in section 5.1 for wavelengths
with decreasing RF dose response curves. In the case of wavelengths
with increasing RF dose response curves, the minimum RF signal (within
the first 100 channels) and the median RF signal (within the last 100
channels) were set to 0 and 100% saturation, respectively. Examples of
dose response curves are given in Fig. S1 for various wavelengths
(saturation shown on right-hand axes).
The natural IR-RF signal saturation obtained in this manner has a
similar behaviour to that estimated from spectrum fitting. At wave
lengths in the range 820–920 nm the relative saturation of the natural
signal of Gi361 is below (but consistent with) zero and that of Gi326
Fig. 5. Wavelength-resolved RF natural signal satu
ration and De for samples (a, c, e) Gi361 and (b, d, f)
Gi326. (a,b) Proportion of the initial natural RF signal
(after vertical sliding) relative to the regenerative
signal saturation. The average of three aliquots per
sample is shown as black and grey lines for reliable
and unreliable wavelength ranges, respectively. The
blue shaded regions indicate the range of values ob
tained for the three aliquots. (c, d) De values were
obtained via horizontal and vertical sliding of the
natural curve onto the regenerative curve at each
wavelength. The blue shaded regions indicate the
standard errors. The wavelength range transmitted in
a conventional PMT and either 850/40 or 900/100
nm filter combination is shown shaded red and or
ange, respectively (right-hand y-axis). For compari
son, (e,f) show the emission spectra of one aliquot of
each sample at 4333 Gy regenerative dose normalised
to the highest intensity as well as the four fitted
Gaussian functions (shaded grey).
6
M. Sontag-Gonz´
alez and M. Fuchs
Radiation Measurements 153 (2022) 106733
ranges ~80–90% saturation (Fig. 5a and b).
We calculated weighted mean De values for each wavelength using
the same horizontal and vertical sliding procedure as in section 5.1. At
the wavelength ranges observed with a PMT and the filters typically
used in lexsyg research (850/40 nm) and Risø systems (Chroma D900/
100 nm; Lapp et al., 2012) (red and orange shading in Fig. 5), the De
values of samples Gi361 and Gi326 are relatively constant and similar to
those obtained for the main IR peak (874–879 nm) in section 5.1. This De
plateau region extends until ~930 nm, thus also covering the wave
length range of the second IR peak, though we note that the 874–879 nm
peak still constitutes ~50% of the signal integration at this wavelength
range.
Striking for both samples is a peak in De values at ~790 nm, which
coincides with one of the fitted red emissions (note that these De esti
mations use the integrated signal and not the fitted functions). A high
degree of saturation of up to 100% is also observed for both samples,
indicating this wavelength range is unreliable for dating due to a small
dose-dependency of the RF signal (see also Fig. S1e). The tail of this high
De ‘peak’ is still present in the first few nanometres of the PMT and 850/
40 nm filter transmission range, especially for sample Gi326 (Fig. 5d). In
fact, in the laboratory comparison of Murari et al. (2021a), the only
laboratory using the PMT and 900/100 nm filter (which only transmits
in slightly higher wavelengths than the 850/40 nm filter; see red and
orange shading in Fig. 5) yielded De values on the lower end (but still
within 1σ) of the range obtained by the other seven laboratories for both
samples.
The wavelength range corresponding to the second red emission, at
680–700 nm, yields relatively low De values of ~350–650 Gy for the
geologically old sample Gi326, in keeping with the expectation that
there is a thermally unstable red emission (Trautmann et al., 1998;
Krbetschek et al., 2000). The relative natural saturation at this wave
length range is consistent with zero (Fig. 5b), indicating a substantial
instability, but the analysis is complicated by the non-monotonic
behaviour of sample Gi326 at this wavelength range (see Figs. S1b
and d).
measurements at cryogenic temperatures would be needed to investi
gate this possibility, something currently not possible with our device.
The small signal proportion of the red emissions relative to the IR
ones (Fig. 3c and d), amounting to at most 5% of the total signal at the
wavelength range measured with a conventional PMT system, suggests
that they would not significantly alter the IR-RF De values. This view is
supported by a ‘De plateau’ in the wavelengths 830–900 nm for both
samples (Fig. 5). However, it could theoretically be possible that other
samples have different signal intensity ratios between the red and IR
emissions, in which case the red emissions could potentially contribute
significantly to the total signal. According to our results, contribution
from the emission at ~1.56–1.59 eV (774–797 nm) would lead to
overestimated IR-RF De values, something which has been reported for
two polymineral samples with high red-RF to IR-RF ratios (Heydari
et al., 2021). Use of alternative band-pass filters, such as the 900/100
nm one, should be further investigated even for samples with relatively
high IR-RF signals (see section 5.2).
Unlike in OSL dating, where it has been suggested to only consider De
values below 86% saturation as reliable (Wintle and Murray, 2006),
there is no conventionally used saturation threshold in IR-RF dating.
Here, the mean signal saturation in the wavelength ranges of 810–850
and 850–890 nm differs by only ~2% (88% and 86% saturation,
respectively), which might appear insignificant, whereas the resulting
mean De values differ by ~400 Gy (~1876 and 1460 Gy, respectively).
Due to the density of measurements, the errors associated with De values
remain relatively low even close to signal saturation, but the uncertainty
associated with the sensitivity correction is more difficult to ascertain, so
it may be useful to establish such a threshold for IR-RF dating.
7. Conclusions
Spectroscopic RF measurements of two sedimentary K-feldspar
samples suggest that for these samples the influence of neighbouring RF
emissions of smaller wavelength only has a small contribution to the
total signal detected in conventional PMT measurements and does not
lead to a change in De. As previously reported for one K-feldspar sedi
ment sample (Kumar et al., 2018), we also find that the second, smaller
IR emission at ~1.35 eV (917–921 nm) has a very similar dose response
(see Fig. 3a and b) and resulting De (see section 5.1) as the main IR
emission at 1.41–1.42 eV (874–879 nm), so it could potentially be of
interest to use a wavelength range further into the IR (<900 nm) for
IR-RF measurements of samples with a higher proportion of contami
nating red emission(s).
6. Discussion
As in previous spectroscopic work, the main visible IR peak was best
fitted by a sum of two peaks, with peak centres ranging 1.41–1.42 eV
(876–879 nm) and 1.35 eV (919–921 nm) for the three aliquots of Gi361
and ranging 1.42 eV (874–875 nm) and 1.35 eV (917–918 nm) for the
three aliquots of Gi326. The values for both samples are very similar and
also match well previously reported IR-RF peaks at 1.40–1.42 eV
(874–885 nm) and 1.30–1.35 eV (917–953 nm) (Kumar et al., 2018;
Riedesel et al., 2021). Therefore, our results also support the view that
the main IR-RF peak is not centred at 865 nm but rather at 880 nm, and
as a consequence the choice of band pass filter for PMT measurements
should be reviewed, as one centred at 850 nm may not be optimal for
detection of this IR-RF signal.
For sample Gi361, a small peak was observable in the red RF range
(Fig. 2a), but it was necessary to assume the presence of two peaks in this
range to obtain a good fit: at 1.80–1.83 eV (676–688 nm) and at
1.59–1.60 eV (774–782 nm). For sample Gi326, there was no obvious
red RF peak even at relatively high doses (see Fig. 2b), but, similarly,
two peaks were necessary for a reasonable fit: at 1.82–1.83 eV (678–681
nm) and at 1.56–1.57 eV (792–797 nm). Especially given the hetero
geneous material in sedimentary samples, we consider the presence of
multiple peaks leading to an almost linear spectrum in the red-orange
range a plausible explanation. It is supported by measurements at
cryogenic temperatures, which described peaks centred at 1.68 and
1.77 eV (738 and 700 nm) for one K-feldspar sample (Kumar et al.,
2018). The possibility of other such small peaks in the IR cannot be ruled
out and could contribute to the high background of IR-RF PMT mea
surements (i.e., why continued irradiation does not lead to zero RF, as
shown in Fig. 1c). However, high-resolution spectroscopic
Declaration of competing interest
The authors declare that they have no known competing financial
interests or personal relationships that could have appeared to influence
the work reported in this paper.
Acknowledgements
The authors were supported by the German Research Foundation
(MSG and MF: DFG FU417/36-1; MF: DFG FU417/19-1). Sumiko Tsu
kamoto is thanked for providing sample Gi361. Peter Austin (CSIRO) is
thanked for the QEMSCAN measurements. Geoff Duller and an anony
mous reviewer are thanked for their constructive comments, which
greatly improved this manuscript.
Appendix A. Supplementary data
Supplementary data to this article can be found online at https://doi.
org/10.1016/j.radmeas.2022.106733.
7
M. Sontag-Gonz´
alez and M. Fuchs
Radiation Measurements 153 (2022) 106733
References
Comprehensive Luminescence Dating Data Analysis. R package version 0.9.11. https
://CRAN.R-project.org/package=Luminescence.
Kumar, R., Kook, M., Murray, A.S., Jain, M., 2018. Towards direct measurement of
electrons in metastable states in K-feldspar: do infrared-photoluminescence and
radioluminescence probe the same trap? Radiat. Meas. 120, 7–13. />10.1016/j.radmeas.2018.06.018.
Kunz, A., Frechen, M., Ramesh, R., Urban, B., 2010. Luminescence dating of late
Holocene dunes showing remnants of early settlement in Cuddalore and evidence of
monsoon activity in south east India. Quat. Int. 222, 194–208. />10.1016/j.quaint.2009.10.042.
Lapp, T., Jain, M., Thomsen, K.J., Murray, A.S., Buylaert, J.-P., 2012. New luminescence
measurement facilities in retrospective dosimetry. Radiat. Meas. 47, 803–808.
/>Meyer, M.C., Austin, P., Tropper, P., 2013. Quantitative evaluation of mineral grains
using automated SEM–EDS analysis and its application potential in optically
stimulated luminescence dating. Radiat. Meas. 58, 1–11. />radmeas.2013.07.004.
Murari, M.K., Kreutzer, S., Frouin, M., Friedrich, J., Lauer, T., Klasen, N., Schmidt, C.,
Tsukamoto, S., Richter, D., Mercier, N., Fuchs, M., 2021a. IR-RF of K-feldspar: an
interlaboratory comparison. Geochronometria 48, 105–120. />10.2478/geochr-2021-0007.
Murari, M.K., Kreutzer, S., King, G., Frouin, M., Tsukamoto, S., Schmidt, C., Lauer, T.,
Klasen, N., Richter, D., Friedrich, J., Mercier, N., Fuchs, M., 2021b. Infrared
radiofluorescence (IR-RF) dating: a review. Quat. Geochronol. 64, 101155. https://
doi.org/10.1016/j.quageo.2021.101155.
Richter, D., Richter, A., Dornich, K., 2013. LEXSYG - a new system for luminescence
research. Geochronometria 40, 220–228. />Riedesel, S., Kumar, R., Duller, G.A.T., Roberts, H.M., Bell, A.M.T., Jain, M., 2021. Siteselective characterisation of electron trapping centres in relation to chemistry,
structural state and mineral phases present in single crystal alkali feldspars. J. Phys.
D Appl. Phys. 54, 385107. />Schilles, T., 2002. Die Infrarot-Radiolumineszenz von Feldspă
aten und ihr Einsatz in der
Lumineszenzdatierung. PhD thesis. Ruprecht-Karls-Universită
at Heidelberg,
Germany.
Trautmann, T., Krbetschek, M.R., Dietrich, A., Stolz, W., 1998. Investigations of feldspar
radioluminescence: potential for a new dating technique. Radiat. Meas. 29, 421–425.
/>Trautmann, T., Dietrich, A., Stolz, W., Krbetschek, M.R., 1999a. Radioluminescence
dating: a new tool for quaternary geology and archaeology. Naturwissenschaften 86,
441–444. />Trautmann, T., Krbetschek, M.R., Dietrich, A., Stolz, W., 1999b. Feldspar
radioluminescence: a new dating method and its physical background. J. Lumin. 85,
45–58. />Trautmann, T., Krbetschek, M.R., Dietrich, A., Stolz, W., 2000. The basic principle of
radioluminescence dating and a localized transition model. Radiat. Meas. 32,
487–492. />Tukey, J.W., 1977. Exploratory Data Analysis. Addison-Wesley, Reading, MA.
Wagner, G.A., Krbetschek, M., Degering, D., Bahain, J.-J., Shao, Q., Falgu`
eres, C.,
Voinchet, P., Dolo, J.-M., Garcia, T., Rightmire, G.P., 2010. Radiometric dating of
the type-site for Homo heidelbergensis at Mauer, Germany. Proc. Natl. Acad. Sci. Unit.
States Am. 107, 19726–19730. />Wintle, A.G., Murray, A.S., 2006. A review of quartz optically stimulated luminescence
characteristics and their relevance in single-aliquot regeneration dating protocols.
Radiat. Meas. 41, 369–391. />
Buylaert, J.-P., Jain, M., Murray, A.S., Thomsen, K.J., Lapp, T., 2012. IR-RF dating of
sand-sized K-feldspar extracts: a test of accuracy. Radiat. Meas. 47, 759–765.
/>Degering, D., Krbetschek, M.R., 2007. 11. Dating of interglacial sediments by
luminescence methods. In: Sirocko, F., Claussen, M., S´
anchez Go˜
ni, M.F., Litt, T.
(Eds.), Developments in Quaternary Sciences, the Climate of Past Interglacials.
Elsevier, pp. 157–171. />Erfurt, G., Krbetschek, M.R., 2003. Studies on the physics of the infrared
radioluminescence of potassium feldspar and on the methodology of its application
to sediment dating. Radiat. Meas. 37, 505–510. />Frouin, M., Huot, S., Mercier, N., Lahaye, C., Lamothe, M., 2015. The issue of laboratory
bleaching in the infrared-radiofluorescence dating method. Radiat. Meas. 81,
212–217. />Frouin, M., Huot, S., Kreutzer, S., Lahaye, C., Lamothe, M., Philippe, A., Mercier, N.,
2017. An improved radiofluorescence single-aliquot regenerative dose protocol for
K-feldspars. Quat. Geochronol. 38, 13–24. />quageo.2016.11.004.
Heydari, M., Gu´erin, G., Zeidi, M., Conard, N.J., 2021. Bayesian luminescence dating at
Gh¯
ar-e Boof, Iran, provides a new chronology for Middle and upper paleolithic in the
southern Zagros. J. Hum. Evol. 151, 102926. />jhevol.2020.102926.
Krbetschek, M.R., Trautmann, T., Dietrich, A., Stolz, W., 2000. Radioluminescence
dating of sediments: methodological aspects. Radiat. Meas. 32, 493–498. https://doi.
org/10.1016/S1350-4487(00)00122-0.
Kreutzer, S., 2020. apply_CosmicRayRemoval( ): function to remove cosmic rays from an
RLum.Data.Spectrum S4 class object. Function version 0.3.0, 2020. In: Kreutzer, S.,
Burow, C., Dietze, M., Fuchs, M.C., Schmidt, C., Fischer, M., Friedrich, J. (Eds.),
Luminescence: Comprehensive Luminescence Dating Data Analysis. R package
version 0.9.7.
Kreutzer, S., 2021a. convert_Wavelength2Energy( ): emission spectra conversion from
wavelength to energy scales. Function version 0.1.1, 2021. In: Kreutzer, S.,
Burow, C., Dietze, M., Fuchs, M.C., Schmidt, C., Fischer, M., Friedrich, J.,
Mercier, N., Philippe, A., Riedesel, S., Autzen, M., Mittelstrass, D., Gray, H.J. (Eds.),
Luminescence: Comprehensive Luminescence Dating Data Analysis. R package
version 0.9.15. />Kreutzer, S., 2021b. analyse_IRSAR.RF( ): analyse IRSAR RF measurements. Function
version 0.7.8, 2021. In: Kreutzer, S., Burow, C., Dietze, M., Fuchs, M.C., Schmidt, C.,
Fischer, M., Friedrich, J., Mercier, N., Philippe, A., Riedesel, S., Autzen, M.,
Mittelstrass, D., Gray, H.J. (Eds.), Luminescence: Comprehensive Luminescence
Dating Data Analysis. R Package Version 0.9.15.
g/package=Luminescence.
Kreutzer, S., Friedrich, J., 2021. apply_EfficiencyCorrection( ): function to apply spectral
efficiency correction to RLum.Data.Spectrum S4 class objects. Function version
0.2.0, 2021. In: Kreutzer, S., Burow, C., Dietze, M., Fuchs, M.C., Schmidt, C.,
Fischer, M., Friedrich, J., Mercier, N., Philippe, A., Riedesel, S., Autzen, M.,
Mittelstrass, D., Gray, H.J. (Eds.), Luminescence: Comprehensive Luminescence
Dating Data Analysis. R package version 0.9.15.
g/package=Luminescence.
Kreutzer, S., Duval, M., Bartz, M., Bertran, P., Bosq, M., Eynaud, F., Verdin, F.,
Mercier, N., 2018. Deciphering long-term coastal dynamics using IR-RF and ESR
dating: a case study from M´
edoc, south-west France. Quat. Geochronol. 48, 108–120.
/>Kreutzer, S., Burow, C., Dietze, M., Fuchs, M.C., Schmidt, C., Fischer, M., Friedrich, J.,
Mercier, N., Riedesel, S., Autzen, M., Mittelstraß, D., Gray, H.J., 2021. Luminescence:
8