Further investigations towards luminescence dating of diatoms
Bạn đang xem bản rút gọn của tài liệu. Xem và tải ngay bản đầy đủ của tài liệu tại đây (6.18 MB, 9 trang )
Radiation Measurements 156 (2022) 106803
Contents lists available at ScienceDirect
Radiation Measurements
journal homepage: www.elsevier.com/locate/radmeas
Further investigations towards luminescence dating of diatoms
P. Morthekai a, *, P. Tiwari a, M.K. Murari b, P. Singh a, c, B. Thakur a, M.C. Manoj a, S.N. Ali a,
V.K. Singh a, K. Kumar a, J. Rai a, N. Dubey d, P. Srivastava e
a
Birbal Sahni Institute of Palaeosciences, 53 University Road, Lucknow, India
National Geochronology Facilities, Inter-University Accelerator Centre (IUAC), New Delhi, India
c
Department of Geology, Banaras Hindu University, Varanasi, India
d
Addis Ababa Science and Technology University, Addis Ababa, Ethiopia
e
Department of Geology, University of Lucknow, Lucknow, India
b
A R T I C L E I N F O
A B S T R A C T
Keywords:
Diatoms
Frustules
Luminescence dating
Diatomite
Vembanad wetland
Mahanadhi
Following up on previous attempts to date diatom frustules, further investigations were made on 1) extracting
diatom frustules devoid of inorganic luminescent grains, 2) developing an equivalent dose estimating protocol
based on the diatomite luminescence characterization, and 3) testing the applicability of this protocol on two
lacustrine profiles. Diatom frustules were extracted in such a way that they are almost devoid of non-biogenic
polymineral grains, confirmed by field emission scanning electron microscope (FE-SEM) observation and en
ergy dispersive X-ray (EDX) analysis. The presence of opal was confirmed by X-ray diffraction (XRD) spectro
metric analysis. The optimized luminescence signal that could be used for equivalent dose estimation was blue
stimulated UV emission with a preheat temperature of 200 ◦ C. The thermoluminescence glow curve peaking at
245 ◦ C might be the source of this signal. In this study the characteristic dose was found to be ~1500 Gy. Two
sediment profiles were explored for luminescence dating, fading rates and a-values were found different between
profiles. This discrepancy can be resolved 1) by measuring luminescence characteristics across different regions,
or/and 2) by using species-specific luminescence measurements. This attempt has yielded an encouraging set of
luminescence ages, with diatom frustule ages comparable to fine grain polymineral ages.
1. Introduction
of diatom frustules) experiences luminescence quenching (Shin et al.,
1996). Moreover, the long-term stability is reduced due to relatively
larger anomalous fading rate in amorphous materials compared to
crystalline ones (Hayes et al., 2019; Rieser and Edsall, 2004). The second
issue is the technical difficulty of extracting diatom frustules from
inorganic luminescent minerals like quartz and feldspar.
Even though earlier studies suggested that the diatoms do not have
many useful dosimetric properties (Berger and Easterbrook, 1988; Hayes
et al., 2019), other studies have shown that they produce luminescence
signals (Cornett and Cornett, 2010; Hayes et al., 2019). Optically stim
ulated luminescence (OSL; blue stimulated UV emission measured at
125 ◦ C after preheating to 260 ◦ C) was measured on the commercially
available diatomaceous earth (deposits of exoskeleton material formed
by the death of a large concentrated diatom population) yielded an
unbleached dose of 180 Gy (Hayes et al., 2019). These researchers re
ported a prominent TL peak at 300 ◦ C and a small peak at 120 ◦ C using a
heating rate of 5 ◦ C.s− 1. In another attempt (Cornett and Cornett, 2010),
arctic and alpine lake sediment diatoms were extracted using acid
Dating siliceous biogenic materials such as diatom is advantageous in
some geological settings where there are no other datable materials such
as calcium carbonates or organic materials for the radiocarbon method
(Anderson et al., 2002; Andrews et al., 1999; Sulpis et al., 2018), or little
or unsuitable quartz/feldspar for luminescence method (Cabanes et al.,
2011; Madella and Lancelotti, 2012; ODP, 2007; Tr´
eguer et al., 1995).
There are attempts to date 1) sillafin which is a protein intrinsic to
diatom frustules (Hatt´
e et al., 2008), 2) other organic compounds such
as long-chain polyamines entrapped in diatom frustules during silicifi
cation (Ingalls et al., 2004), 3) phytolith occluded carbon (Zuo and Lu,
2019) using the radiocarbon method. The luminescence method was
also attempted on diatom frustules (Berger and Easterbrook, 1988;
Cornett and Cornett, 2010; Hayes et al., 2019; Rieser and Edsall, 2004).
Previous attempts to date diatom frustules have been hampered by two
main difficulties. The first one is a conceptual issue based on an un
founded suspicion that amorphous material like opaline silica (make up
* Corresponding author.
E-mail address: (P. Morthekai).
/>Received 17 December 2021; Received in revised form 21 May 2022; Accepted 24 May 2022
Available online 2 June 2022
1350-4487/© 2022 Elsevier Ltd. All rights reserved.
P. Morthekai et al.
Radiation Measurements 156 (2022) 106803
digestions with aqua regia and hydrogen peroxide. OSL was measured
without preheating and at a lower stimulation temperature (30 ◦ C) in
ultraviolet (UV) after blue stimulation. In these earlier attempts, 1) no
infra-red stimulated luminescence (IRSL) was observed, 2) OSL signals
were brought down to 10% after 30 min of natural sunlight exposure (in
Ontario, Canada), and 3) two OSL components were fitted to the
measured OSL decay curve (Cornett and Cornett, 2010). In another
refined attempt, diatom species-specific luminescence dating was con
ducted on, 1) ~35 ka old (26–55 ka) freshwater diatom ooze (Cyclo
tellastelligera), and 2) ~120 ka (115–130 ka) old marine diatom ooze
(Thalassiothrixlongissima), but the complete data is yet to be published
as a full research paper (Rieser and Edsall, 2004).
Learning from earlier attempts to date diatom frustules using the
luminescence method, we further investigate the dating potential of
diatom frustules by 1) refining the method to extract diatom frustules
free of conventional abiotic luminescing minerals such as quartz and
feldspar, 2) studying its luminescence characteristics to arrive at a
protocol to estimate equivalent dose and, 3) applying the findings to
date two sedimentary deposits. This study will provide the methodo
logical aspect of diatom frustule dating.
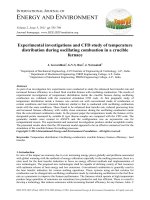
shown in Fig. 1. The first two stages entailed removing carbonates and
organic materials from the sediments using 1 N HCl and 30% H2O2
respectively. Stage 3 involved extracting the clay particles by treating
them with 5% sodium hexametaphosphate (SHP) overnight. The
floating clay particles were pipetted out. Stage 4 involved cleaning the
settled fraction with distilled water before storing it in sodium poly
tungstate with a specific density of 2.3 g cm− 3. Settling of grains was
expedited by applying a gentle centrifugal force at 1500 rpm for 15 min
using a centrifuge tube of 50 ml. The floating portion was pipetted out
and cleaned with distilled water, and oven-dried. This procedure is
slightly a modified one of Morley et al. (2004).
After the extraction of diatom frustules, fine grain polymineral was
separated from MN and MT samples by treating with 0.01 N sodium
oxalate which deflocculates the finer grains and the associated coarser
grains. Using Stokes’ settling time difference, 4–11 μm grains were
separated by allowing them to settle between 1.5 min and 15 min in the
ethanol column. These grains were mixed in acetone and allowed to
deposit in cleaned scratched Al discs that were placed inside individual
flat bottom glass vials of 6 cm height (Morthekai and Ali, 2014). Diatom
frustules were extracted and deposited in Al discs as mentioned above.
2. Materials and methods
2.2.2. Testing of diatom frustules free of non-biogenic luminescing materials
The geochemical and mineralogical compositions of the extracted
diatom frustules were tested using energy dispersive X-ray analysis
(EDX; also known as energy dispersive analysis, EDS) and X-ray
diffraction spectrometric analysis (XRD) respectively. The EDX mea
surements were carried out on the identified spots (EDS Spots) using a
field emission scanning electron microscope (FE-SEM). A Schottky-type
field emission (T-FE) gun was used as the electron gun probe. It has a 1.5
nm beam width at an accelerating voltage of 1 kV in GB mode. It is a
JOEL JSM 7610f model of Joel India Pvt. Ltd. Energy dispersive X-ray
measurements were carried out at liquid nitrogen temperature and the
EDX spectra were collected at a resolution of 127 eV.
The PANalytical Xpert’3 Powder with Cu as the anode material was
used to measure the diffraction pattern of the samples (diatom frustules
and inorganic polymineral fine grains of size 4–11 μm) deposited on the
Al discs. The diffraction pattern was measured from 2θ = 5◦ –80◦ with a
time step of 18.870 s, at room temperature. The measured diffraction
spectra were analyzed using powdR, an R package (Butler and Hillier,
2020), and the rockjock_mixtures data set (Eberl, 2003) was used to
quantify the mineral concentrations present in the samples. Opal_282,
Opal_264, Opal_253, Intermediate_Microcline, Orthoclase, and Albite_
Cleavelandite were considered as the possible minerals that are present
in the sample, and corundum was considered as the standard mineral.
The presence of quartz grains was checked by comparing the shapes
of the measured photon arrival time distribution of diatom frustules and
quartz. The photon arrival time distribution (PATD) of diatom frustules
was measured using time-resolved luminescence (TRL) detecting system
attached to Risoe TL/OSL Reader DA-20 (Lapp et al., 2009). The stim
ulation was achieved by pulsed blue LEDs (470 ± 20 nm) using ON and
OFF times of 10 μs and 30 μs respectively. The total stimulation time was
200 s and hence 5 million pulses with a pulse period of 40 μs were used.
The emitted photons were collected using PMT EMI 9835QA through a
7.5 mm Hoya U-340 filter.
2.1. Sample details
Two categories of samples were used in this study. A natural diato
mite deposit was collected from Lake Ashenge, Ethiopia and this is the
first category. The diatom frustules that were extracted from this sample
was used to characterize the luminescence properties such as stability
(both thermal and a-thermal), bleachability, and dose-response. No age
estimation was done for this sample.
The second category of samples was used to apply the luminescence
dating method to the diatom extracts, and compare the ages with other
independent ages. There are two sets of samples in the second category.
One set of samples (MN series) was a revisit of radiocarbon-dated 200
cm deep sedimentary sequence from the margin of Mahanadi river near
Chhuipali village, Bargarh district, Odisha (Tripathi et al., 2013). The
fine-grain polymineral (abiotic sediment) and diatom frustules of this
series are called MNS and MND respectively. The sediment samples used
in this study are recent depositions with a moderate to a high degree of
mottling and are essentially unconsolidated to semi-consolidated,
allowing the sediment to be found in chunks rather than loosely asso
ciated (Fig. S1). The sediment type is defined by sandy to silty loams and
has a high humus content (Tripathi et al., 2013). Samples were collected
not in opaque metallic pipes but as chunks at depths of 70 cm, 120 cm,
and 180 cm from the top. The age of diatom frustules are validated
against the available conventional radiocarbon age.
The second set of samples (MT series) belongs to a 100 cm deep core
retrieved from Mundro Thuruth, Ashtamudi Lake, Kollam, Kerala.
Similarly, the fine-grain polymineral (abiotic sediment) and diatom
frustules of this series are called MTS and MTD respectively. Four
samples were collected at 20 cm, 36 cm, 50 cm, and 80 cm from the top
of the core. As there is no other independent age control for this series,
luminescence-based diatom frustule ages are compared to fine-grain
polymineral ages.
2.2.3. Equivalent dose estimation
The equivalent dose (De) of diatom frustules was measured using a
SAR procedure that was adapted from that of quartz dating (Murray and
Wintle, 2003). Preheat that was used in the SAR procedure is discussed
in Section 3.2.7. The De of the fine grain polymineral sample was
measured using the SAR procedure with preheat temperature of 200 ◦ C
for a holding time of 60 s, before IRSL measurement (Banerjee et al.,
2001; Blair et al., 2005). The measured IRSL was majorly contributed by
feldspar grains. Fading rate (g-value, %/decade) was measured using the
SAR procedure (Auclair et al., 2003) and the fading correction was done
using Huntley and Lamothe method (2001).
2.2. Methods and instrument details
2.2.1. Extraction of diatom frustules
The MN samples were collected in chunks and the outer light
exposed layer of a minimum of 5 cm was removed. The inner light un
exposed portion was used further. The MT samples were collected in
PVC pipe vertically as a core. The core was halved inside the dark lab
oratory and sampled at four depths. A 3 mm thick sample that was in
touch with PVC pipe was removed. The diatom frustules from these light
unexposed samples and the diatomite were extracted in four stages as
2
P. Morthekai et al.
Radiation Measurements 156 (2022) 106803
Fig. 1. Diatom frustules extraction procedure in four stages.
All the luminescence measurements were made using an automated
Risø TL-OSL-DA-20 reader that was equipped with an EMI 9835QA
photomultiplier tube, blue (470 ± 20 nm), IR (870 ± 40 nm), and violet
(405 nm; violet laser + interference filter [AHF F39-404, 5 mm] + glass
filter [AHF GG 395–12.5]) stimulation sources (Bøtter-Jensen et al.,
2010; Lapp et al., 2015). The emitted UV photons were detected either
using a 7.5 mm Hoya U-340 (blue stimulation) or AHF F39-340
Bright-Line HC 340/26 2 mm filter (violet stimulation). Beta particle
irradiations were carried out using an on-plate 90Sr/90Y beta source and
it deliver a dose rate of 0.071 Gy s− 1.
significantly. Alpha efficiency was calculated by comparing the lumi
nescence induced by known beta and alpha dose. Three required pa
rameters to calculate a-value are equivalent beta dose, the flux of alpha
particles, and alpha exposure time. The formula that was used to
calculate a-value is ‘a-value = [De,β/(13 x N x α)]’, where De,β is an
equivalent beta dose (Gy), N is alpha particle flux from 241Am (#.min− 1.
mm− 2) in a vacuum, and α is alpha irradiation time (min).
3. Results and discussion
3.1. Performance assessment of the diatom frustules extraction procedure
2.2.4. Dose rate estimation
The concentrations of U, Th and K in the bulk sediment were
measured using gamma spectrometry. The samples were crushed, sealed
in airtight plastic boxes, and stored to achieve secular equilibrium. After
a month of storage, concentrations of U, Th, and K were calculated by
comparing the concentration of the aforesaid long-lived radioactive el
ements with that of a standard NUSSY (Preusser and Kasper, 2001).
Canberra-made reverse electrode coaxial Ge detector (REGe; GR-2018
model) with a 16,000 channels multichannel analyzer (DSA-LX) was
used to detect the gamma-ray photons. Background counts were reduced
by keeping the detector at liquid nitrogen temperature and within the 2
cm thick Perspex shield that is kept within a 5 cm thick lead bricks
chamber. Uranium concentration was calculated from the arithmetic
mean of concentration of its radioactive daughters 226Ra (186 keV),
214
Pb (295.2 keV), and 214Bi (609.3 keV, 1120.3 keV, and 1700 keV).
Similarly, thorium concentration was calculated from its radioactive
daughters 212Pb (238.6 keV), 228Ac (911.1 keV), and 208Tl (2614.5 keV).
The photopeak at 1460 keV was used to calculate the concentration of
potassium. The concentrations of U, Th, and K were converted into dose
rate (Adamiec and Aitken, 1998) after considering the water content,
alpha efficiency (a-value), beta attenuation factors (Mejdahl, 1979), and
cosmic ray dose (Prescott and Hutton, 1994) using online Dose Rate and
Age Calculator (DRAC v1.2) (Durcan et al., 2015).
As the diatom frustules are of different shapes with a hollow inside,
essentially the ionizing radiation deposits their energy only in the
thinner walls (5–50 μm). Since the dose deposition occurs only in the
walls of diatom frustules whose thickness is comparable to the pene
tration depth of alpha particles (~25 μm), alpha efficiency (a-value)
becomes an important parameter that influences the dose rate
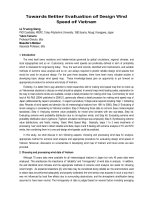
The presence of non-biogenic luminescing minerals such as quartz or
feldspar was examined on the diatom frustules mounted discs. The
samples were mounted and examined using FE-SEM. The samples were
dominated by different diatom assemblages (Fig. 1 a-d). There were a
few occurrences of phytoliths and sponge spicules (Fig. 2 e, f and Fig. S2
d, f). This could be because the samples have not been sieved at any
stage (less than 10 μm). Generally, broken diatoms would be of the size
less than 10 μm and the larger diatoms are bigger than 75 μm size. EDX
measurements suggest that oxygen was the most abundant element in
diatomite (60–70%), phytolith (65–70%), and sponge spicules (70%),
with Si accounting for the remaining 25–30% (Fig. S2 b,d-h). These
observations support the fact that the samples are predominantly of
SiO2.
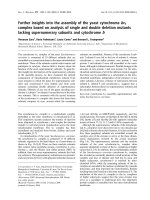
XRD spectra were measured on the Al discs that had 1) diatom
frustules from the diatomite sample, 2) diatom frustules from sediment
(MND1), and 3) polymineral grains (4–11 μm) extracted from the
sediment sample (MNS1). XRD was measured on the Al disc itself and it
has 4 prominent peaks at 2θ values of 38.52 ◦ C, 44.76 ◦ C, 65.14 ◦ C, and
78.26 ◦ C. Background (Al disc spectra) subtracted XRD spectra of diat
omite, diatom (MND1), and sediment (MNS1) are given with the posi
tion of opal in the spectra (Fig. 3a and S3). These XRD spectra were
analyzed, and it was found that the concentration of opal was 76% in
both diatomite and diatom, but only 55% in sediment. Feldspar’s con
centration was found to be 20% in both diatomite and diatom, and 42%
in sediment.
The shape of photon arrival time distribution (PATD) of quartz and
feldspar is different (Ankjærgaard et al., 2010). Blue light stimulated
TRL (TR-OSL) was measured on the irradiated (35 Gy) and preheated
3
P. Morthekai et al.
Radiation Measurements 156 (2022) 106803
Fig. 2. SEM images of extracted diatom frustules from diatomite sample. Along with diatom assemblages (a. Epithermia, b. Cyclotellaocellata, c. Cyclotellameneghiana,
d. Navicula sp.), phytoliths (e) and sponge spicules (f) were also present in the samples. Mix of benthic (a & d) and planktonic (b & c) diatom species were there.
(200 ◦ C for 10 s) diatomite sample with 10 μs as ON time, and 30 μs as
OFF time for 200 s (Fig. 3b). The shape of TRL of quartz exhibit a slow
rise during the ON time and a slow decay since the LED is OFF with a
decay constant of ~35 μs (Chithambo and Galloway, 2000). Although
the observed TRL’s shape resembles to that of feldspar (Ankjærgaard
et al., 2009), the significantly lower intensity of IRSL (Fig. 4b) suggests
TRL has arisen from opaline diatom frustules themselves, not from
feldspar grains.
There was a mix of benthic and planktonic species from diatomite,
MN series and MT series of samples. Only the proportion was different.
For MN series, there was an 80% benthic diatoms, and MT series
constituted 89% benthic diatoms.
characterized.
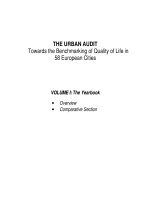
3.2.1. Thermoluminescence glow curves
The extracted diatom frustules from the diatomite were given ~3.5
Gy. The Tmax -Tstop method was used to know whether a measured TL
peak is single or continuous (McKeever, 1980). The temperature at
which the TL (up to 400 ◦ C @ 1 ◦ C/s) shows its first maximum (Tmax)
was plotted against Tstop which is similar to preheat temperature that
varied from 50 ◦ C to 350 ◦ C at an interval of 20 ◦ C (Fig. 4a). Before every
Tstop, the aliquot was given 3.5 Gy. This plot shows that there is a
quasi-continuous TL peak around 200 ◦ C that arises not from a single
electron trap but a distribution of it.
3.2.2. Prominent luminescence signal
One aliquot of the diatomite sample was given a 350 Gy dose and
preheated to 200 ◦ C. IR stimulated signals were measured at a temper
ature of 30 ◦ C (IRSL) for 40 s. After IRSL, the sample was again pre
heated to 200 ◦ C to avoid any IR photo-transferred signal, and blue
3.2. Dosimetric characteristics
In this section, basic luminescence properties such as the shape of the
TL glow curve, prominent optically stimulated luminescence signal, the
source of luminescence, bleaching, and fading behavior are
Fig. 3. a) Background (XRD spectra measured on Al disc) subtracted XRD spectra of diatomite, diatom frustules extracted from MN series samples, and its sediment
counterpart. Only the cropped (2θ from 15◦ to 35◦ ) spectra were shown for better visibility, although measurement was done from 5◦ to 80◦ . Fitted spectra for
quantification were shown in Fig. S2 b) Photon arrival time distribution (PATD) plot derived from the time-resolved luminescence data.
4
P. Morthekai et al.
Radiation Measurements 156 (2022) 106803
Fig. 4. Luminescence characteristics of extracted diatom frustules from diatomite sample. The Tmax -Tstop plot was measured on an aliquot of irradiated (3.5 Gy)
diatom frustule (a). An aliquot of diatom frustules was given 350 Gy and preheated to 200 ◦ C before the measurement of b) various luminescence signals (IR, Blue,
and Violet stimulated luminescence), c) remaining TL signals, and d) OSL signals at different stimulation temperatures (the error is sqrt(N) where is N is photon
counts). Bleachability (e) and fading (f) characteristics were also tested. The error in the data point reflects the relative error from L/T that is converted to dose. Note:
The TL glow curve with No B-UV measurement in (c) was taken from the data of (a) before IR, Blue and Violet stimulated luminescence signals were measured. That
is why the remaining TL signals after B-UV @ 50 ◦ C are apparently higher.
stimulated signal (BSL) was measured at a temperature of 30 ◦ C for 40 s
and preheated to 200 ◦ C. Then violet light stimulated signal (VSL) was
measured at a temperature of 30 ◦ C for 40 s. Among these three signals,
BSL was prominent (Fig. 4b).
142 Gy and preheated to 200 ◦ C for 10 s. A prompt OSL measurement
was carried out using blue stimulation at 125 ◦ C for 40 s. Another OSL
measurement was made with a delay of 38 h between the end of beta
irradiation and the measurement. Visibly no fading occurred in 38 h
since the cessation of irradiation (Fig. 4f). Four aliquots of diatomite
were used to measure g-value (%/decade) using the SAR procedure
(Auclair et al., 2003). An average value of 1.5 ± 2.6% per decade was
calculated, and that too suggests a non-fading luminescence signal in
diatomite.
3.2.3. Source of OSL signal
TL was measured on the irradiated (350 Gy) and preheated (200 ◦ C)
diatomite sample, and after OSL measurements at 50 ◦ C, 100 ◦ C, and
150 ◦ C (Fig. 4c). The TL peak was observed at a temperature of ~245 ◦ C.
The OSL measurements were lowering that TL peak intensity. Presence
of TL signal even after measurement of OSL at high temperature (150 ◦ C)
confirms hard to bleach signal. So, the source of OSL signals from
diatomite is the TL glow curve peaking at 245 ◦ C.
3.2.7. Refined protocol for equivalent dose estimation
The remaining OSL signal after progressive preheating of the irra
diated diatomite aliquot to temperature from 70 ◦ C to 350 ◦ C at an in
terval of 40 ◦ C was measured (Fig. 5a). The OSL depletion rate was
higher at the preheat temperature of 230 ◦ C. Earlier studies measured
OSL (blue light stimulation and UV photons detection) of diatom frus
tules at 1) 30 ◦ C without preheating (Cornett and Cornett, 2010), and 2)
125 ◦ C after preheating to 220 ◦ C (Hayes et al., 2019). The second study
used the SAR procedure which is similar to quartz OSL dating (Hayes
et al., 2019; Murray and Roberts, 1998). We refined their protocol based
on the luminescence characteristics that are studied above. The preheat
temperature was chosen to be 200 ◦ C, with a holding time of 30 s
(Fig. 5b), and this low holding time (30 s) was chosen arbitrarily.
A laboratory given dose of 361 Gy was recovered by the above
protocol with 10 ± 4% over-estimation (399 ± 14 Gy). The character
istic dose (D0) of 750 Gy was estimated using a single saturating expo
nential to the constructed dose response curve (Fig. 5c). This suggests
that it is feasible to date diatom frustules that are typically 400 ka old (2
x D0 = 1500 Gy) using a dose rate ranging from 3 to 5 Gy.ka− 1. As dose
recovery suggests, the dose values of diatom frustules might have been
overestimated by 10%.
3.2.4. Optimizing the stimulation temperature
The set of OSL signals measured at a temperature of 50 ◦ C, 100 ◦ C,
and 150 ◦ C as discussed in the section above was used to optimize the
stimulation temperature. Compared to 50 ◦ C, the OSL signal measured at
a temperature of 150 ◦ C was larger by 23% (Fig. 4d). Higher stimulation
temperature didn’t change the shape of the OSL decay curve but only the
intensity (inset). This observation also implies that the substance being
measured is not quartz. Because in quartz OSL thermal quenching
(Pagonis et al., 2010; Wintle, 1975) rather than thermal assistance, has
been observed.
3.2.5. Bleachability
A single aliquot of diatomite was given a dose of 142 Gy and exposed
to sunlight for <5 s, 10 s, and 2 h, before equivalent dose measurements
using SAR were carried out. Two hours of sun exposure reduced the
given 142 Gy dose to 1.0 ± 0.3 Gy i.e., 99% reduction (Fig. 4e). Hence
the luminescence signals are bleachable and allow the reworked (hence
exposed to sunlight) diatom frustules to be dated.
3.3. Age estimation and comparison
3.2.6. Fading behavior
Another key characteristic to be aware of is athermal instability. To
investigate this phenomenon, an aliquot of diatomite was given a dose of
The aliquot acceptance criteria were 10% of unitary recycling ratio,
10% of test dose error, 10% recuperation of natural signal for both
5
P. Morthekai et al.
Radiation Measurements 156 (2022) 106803
Fig. 5. Percentage of remaining OSL signal after different preheating temperatures (a). Protocol revised based on the luminescence characteristics (b) and the
measured dose-response curve using protocol (c). 360 Gy was administered to the naturally bleached diatomite and 399 ± 14 Gy was recovered using this protocol.
(0.078 #.min− 1.mm− 2) in a vacuum of 4 g cm− 2. The a-value of diatom
frustules extracted from diatomite was calculated to be 0.041 ± 0.008
(average of 4 aliquots) and the a-values of MN (range from 0.021 to
0.033) and MT (0.063–0.072) series are given in Table 1.
There are two sets of variables that need to be considered when
comparing the ages of diatom frustules and fine grain polymineral. The
first contrast was observed in fading rate of diatom samples measured
from MN series (no fading) and MT series (10.2 ± 2.4%/decade) (Fig. 7a
and b). The second contrasting set of values is alpha efficiency (a-value).
The a-values of diatom frustules (range: 0.052–0.065) are double the
values of sediment (0.021–0.033) of MN series, whereas there is a small
difference between the a-values of diatom frustules (0.068–0.077) and
sediment (0.063–0.072) of MT series. Compared to MN series samples,
the a-values of MT series samples are larger.
For MN series, the ages of fine grain polymineral were smaller than
that of diatom frustules by 83% (Fig. 8a). Further, both the ages of fine
grain polymineral and diatom frustules were showing underestimation
to the published conventional radiocarbon ages by 95% and 67%
respectively (Fig. 8a). It may be true that the radiocarbon ages are
overestimated by the ‘old dead’ carbon mix with the sample. It was
checked by a non-zero radiocarbon age resulting from a linear extrap
olation of radiocarbon ages to the modern depth. An extrapolated age of
675 years for the modern sediment suggest the radiocarbon ages are
reliable, and the observed underestimation of luminescence ages was
beyond this small radiocarbon age offset. The absence of non-zero De
estimates and a systematic difference in De (6 ± 2 Gy; Fig. 6a) between
the diatom frustules and fine grain polymineral samples suggest that it is
unlikely the samples would have been either fully or heterogeneously
bleached to a similar level either in the field or in the laboratory. The
discussion on the possibility of bleaching is necessary because the
samples were not collected in OSL pipes but as chunks (Fig. S1). So,
cause(s) for the underestimation of luminescence ages of both fine grain
polymineral and diatom frustule is not clear with the available data.
For the MT series, except for the top sample other three ages of
diatom frustules are comparable to that of fine grain polymineral. Age
estimates of diatom frustules are systematically larger than polyminerals
by a percentage difference of 27% (except the top sample, MTD 1) in the
MT series. The errors are large with an average percentage error of 43%
and 44% for diatom frustules and fine grain polyminerals, respectively
(Fig. 8b). For MTS 2, the large error (120 ± 100 years; 83%) is due to the
large spread in the beta equivalent dose (1.4 ± 4.1 Gy; 3 aliquots) and
the dose rate (5.6 ± 3.3 Gy.ka− 1; 59% error). The age of the diatom
frustule of MTD 4 is larger than that of polymineral and the large spread
in the De (50%) implies that older allochthonous diatom frustules which
were transported from elsewhere. Recently increasing sand mining ac
tivities in the nearby area (northern and eastern side of the lake) would
diatom frustules, and fine grain polymineral from both MN and MT se
ries. For the MT series, the average recuperation was 22 ± 13% and 31
± 8% of all the samples (n = 4) of diatom frustules and fine grain pol
ymineral, respectively. An illumination (blue LED for 200 s at 240 ◦ C)
step before every regeneration dose reduced the recuperation to 0.6 ±
0.7% and 12 ± 8% respectively. This illumination step was not required
for MN series as an average recuperation was observed for diatom
frustules (5.6 ± 1.5) and fine grain polymineral (3.9 ± 2.7%). The doseresponse curves of diatom frustules and fine-grain polymineral of both
MN and MT series were standardized. The Ln/Tns of diatom frustules and
fine-grain polymineral are shown at the left and right sides the stan
dardized dose-response curve (Fig. 6a and b).
Alpha efficiency (a-value) was calculated by comparing the lumi
nescence induced by known beta and alpha dose. Four aliquots of
diatom frustules were exposed to alpha particles for 4 min which yielded
an equivalent beta dose of 1.40 ± 0.05 Gy. The flux of alpha particles
from the source at BSIP (Risoe ID is Num368) was calculated to be 0.65
± 0.12 #.min− 1.mm− 2 by comparing with the alpha source at PRL
Fig. 6. Standardized dose-response curves of diatom frustules and fine-grain
polymineral of both MN and MT series. Ln/Tns of diatom frustules and finegrain polymineral are shown left and right side of the standardized doseresponse curve.
6
P. Morthekai et al.
Radiation Measurements 156 (2022) 106803
Table 1
Measured concentrations of U, Th, and K, a-value, equivalent dose (De), g-value (%/decade), and the estimated dose rate values and fading corrected ages (Agefc) for
both diatom and sediment from Mahanadi basin (MN series; 21◦ 44′ N, 83◦ 33′ E) and Vembanad Wetland (MT series; 9◦ 35′ N, 76◦ 25′ E) samples. Over-dispersion (OD)
and accepted number of aliquots (n) are also provided. Water content was assumed to be 10 ± 2% for both diatom frustules and fine grain polymineral of all the
samples.
Sample code
Depth (cm)
U (ppm)
Th (ppm)
K (%)
a-value
MND 1
MNS 1
MND 2
MNS 2
MND 3
MNS 3
MTD 1
MTS 1
MTD 2
MTS 2
MTD 3
MTS 3
MTD 4
MTS 4
180
3.9 ± 0.4
27.5 ± 2.3
3.3 ± 0.1
120
5.7 ± 1.0
34.7 ± 0.6
2.2 ± 0.1
70
6.5 ± 0.7
39.4 ± 3.9
2.7 ± 0.1
80
11 ± 7
31 ± 21
0.7 ± 0.1
50
2.8 ± 0.6
26.3 ± 16.2
1.7 ± 0.1
36
3.5 ± 0.9
20.9 ± 1.9
1.4 ± 0.1
20
4.4 ± 1.3
25.7 ± 11.9
2.4 ± 0.1
0.021 ±
0.052 ±
0.030 ±
0.065 ±
0.033 ±
0.065 ±
0.072 ±
0.075 ±
0.063 ±
0.068 ±
0.069 ±
0.077 ±
0.066 ±
0.071 ±
0.015
0.008
0.019
0.005
0.016
0.007
0.004
0.055
0.003
0.205
0.001
0.059
0.004
0.022
Dose rate (Gy.ka− 1)
De (Gy)
OD (%) (n)
g-value (%/dec.)
Agefc (a)
6.2
7.2
6.5
7.9
7.6
9.1
7.4
8.4
5.0
5.6
4.6
5.1
6.2
6.8
6.6
1.3
9.6
1.6
4.7
0.7
1.3
1.2
0.5
0.8
0.7
0.7
2.0
0.6
12 (7)
11 (12)
9 (7)
17 (11)
48 (7)
12 (12)
9 (5)
7 (6)
21 (6)
7 (6)
11 (6)
11 (6)
17 (6)
9 (6)
2.0 ± 0.8
5.1 ± 1.1
0.1 ± 1.1
6.3 ± 1.7
1.0 ± 1.0
5.1 ± 1.3
11.0 ± 0.5
8.1 ± 0.3
13 ± 1
7.7 ± 0.1
7.7 ± 1.1
7.3 ± 0.4
10 ± 1
7.7 ± 0.2
620 ± 400
80 ± 10
1480 ± 180
240 ± 80
1060 ± 140
230 ± 20
290 ± 120
190 ± 60
130 ± 50
120 ± 100
120 ± 40
100 ± 45
500 ± 320
90 ± 30
± 0.3
± 0.3
± 0.4
± 0.3
± 0.5
± 0.4
± 1.9
± 2.6
± 1.0
± 3.3
± 0.4
± 0.8
± 0.8
± 0.9
± 0.8
± 0.1
± 1.0
± 0.5
± 3.0
± 0.1
± 0.3
± 0.1
± 0.1
± 0.1
± 0.1
± 0.2
± 1.0
± 0.1
Fig. 7. Fading behavior of both diatom frustules and the respective fine grain polymineral sediment extracted from a) Mahanadi basin samples and b) Vembanadu
Wetland samples. Polymineral sediment samples were showing a systematic anomalous fading behavior whereas diatom exhibited a contrast fading behavior.
Fig. 8. Comparison of sediment (polymineral ages) and diatom ages of a) Mahanadi basin (MN series), and b) Vembanadu Wetland (MT series). Conventional
radiocarbon ages are also shown for Mahanadi basin samples.
have disturbed the subsurface sediments and the relatively lighter
diatom frustules (2.3 g cm− 3) compared to the co-deposited fine-grain
polymineral would have been transported to the study site from the
disturbed site (Nair et al., 2020). The higher concentrations of Th in both
the Mahanadhi basin (Bastia et al., 2020; Veerasamy et al., 2020) and
Kerala Coast, Vembanad Wetland (Derin et al., 2012; Iyer, 2015;
Overstreet, 1967) are within the observed values from these regions. The
observed large error in Th concentration of the first two samples of the
7
Radiation Measurements 156 (2022) 106803
P. Morthekai et al.
MT series is because of the difference in count rate among radioactive
daughters of 232Th (212Pb, 228Ac, and 208Tl), and it is beyond the scope of
this paper to investigate further.
Anderson, J.B., Shipp, S.S., Lowe, A.L., Wellner, J.S., Mosola, A.B., 2002. The antarctic
ice sheet during the last glacial maximum and its subsequent retreat history: a
review. Quat. Sci. Rev. 21, 49–70.
Andrews, J.T., Domack, E.W., Cunningham, W.L., Leventer, A., Licht, K.J., Jull, A.J.T.,
DeMaster, D.J., Jennings, A.E., 1999. Problems and possible solutions concerning
radiocarbon dating of surface marine sediments, Ross sea, Antarctica. Quat. Res. 52,
206–216.
Ankjærgaard, C., Jain, M., Kalchgruber, R., Lapp, T., Klein, D., McKeever, S.W.S.,
Murray, A.S., Morthekai, P., 2009. Further investigations into pulsed optically
stimulated luminescence from feldspars using blue and green light. Radiat. Meas. 44,
576–581.
Ankjærgaard, C., Jain, M., Thomsen, K.J., Murray, A.S., 2010. Optimising the separation
of quartz and feldspar optically stimulated luminescence using pulsed excitation.
Radiat. Meas. 45, 778–785.
Auclair, M., Lamothe, M., Huot, S., 2003. Measurement of anomalous fading for feldspar
IRSL using SAR. Radiat. Meas. 37, 487–492.
Banerjee, D., Murray, A.S., Bøtter-Jensen, L., Lang, A., 2001. Equivalent dose estimation
using a single aliquot of polymineral fine grains. Radiat. Meas. 33, 73–94.
Bastia, F., Equeenuddin, S.M., Roy, P.D., Hern´
andez-Mendiola, E., 2020. Geochemical
signatures of surface sediments from the Mahanadi river basin (India): chemical
weathering, provenance, and tectonic settings. Geol. J. 55, 5294–5307.
Berger, G.W., Easterbrook, D.J., 1988. Dating Quaternary Events by Luminescence,
Dating Quaternary Sediments. Geological Society of America, 0.
Blair, M.W., Yukihara, E.G., McKeever, S.W.S., 2005. Experiences with single-aliquot
OSL procedures using coarse-grain feldspars. Radiat. Meas. 39, 361–374.
Bøtter-Jensen, L., Thomsen, K., Jain, M., 2010. Review of optically stimulated
luminescence (OSL) instrumental developments for retrospective dosimetry. Radiat.
Meas. 45, 253–257.
Butler, B., Hillier, S., 2020. powdR: Full Pattern Summation of X-Ray Powder Diffraction
Data.
Cabanes, D., Weiner, S., Shahack-Gross, R., 2011. Stability of phytoliths in the
archaeological record: a dissolution study of modern and fossil phytoliths.
J. Archaeol. Sci. 38, 2480–2490.
Chithambo, M.L., Galloway, R.B., 2000. On luminescence lifetimes in quartz. Radiat.
Meas. 32, 621–626.
Cornett, J.A., Cornett, R.J., 2010. A new technique for paleolimnology: dating sediments
using the optically stimulated luminescence signal from diatom frustules. SIL
Proceedings 1922–2010 30, 1649–1652.
Derin, M.T., Vijayagopal, P., Venkatraman, B., Chaubey, R.C., Gopinathan, A., 2012.
Radionuclides and radiation indices of high background radiation area in ChavaraNeendakara placer deposits (Kerala, India). PLoS One 7, e50468.
Durcan, J.A., King, G.E., Duller, G.A.T., 2015. DRAC: dose rate and age calculator for
trapped charge dating. Quat. Geochronol. 28, 54–61.
Eberl, D.D., 2003. User Guide to RockJock - A Program for Determining Quantitative
Mineralogy from X-Ray Diffraction Data.
Hatt´
e, C., Hodgins, G.W.L., Jull, A.J.T., Bishop, B., Tesson, B., 2008. Marine chronology
based on 14C dating on diatoms proteins. Mar. Chem. 109, 143–151.
Hayes, R.B., O’Mara, R.P., Hooper, D.A., 2019. Initial tl/osl/epr considerations for
commercial diatomaceous earth IN retrospective dosimetry and dating. Radiat.
Protect. Dosim. 185, 310–319.
Huntley, D.J., Lamothe, M., 2001. Ubiquity of anomalous fading in K-feldspars and the
measurement and correction for it in optical dating. Can. J. Earth Sci. 38,
1093–1106.
Ingalls, A.E., Anderson, R.F., Pearson, A., 2004. Radiocarbon dating of diatom-bound
organic compounds. Mar. Chem. 92, 91–105.
Iyer, M., 2015. Origin of thorium deposits in Kerala beach sands. Radiat. Protect.
Environ. 38, 98–101.
Lapp, T., Jain, M., Ankjærgaard, C., Pirtzel, L., 2009. Development of pulsed stimulation
and Photon Timer attachments to the Risø TL/OSL reader. Radiat. Meas. 44,
571–575.
Lapp, T., Kook, M., Murray, A.S., Thomsen, K.J., Buylaert, J.P., Jain, M., 2015. A new
luminescence detection and stimulation head for the Risø TL/OSL reader. Radiat.
Meas. 81, 178–184.
Madella, M., Lancelotti, C., 2012. Taphonomy and phytoliths: a user manual. Quat. Int.
275, 76–83.
McKeever, S.W.S., 1980. On the analysis of complex thermoluminescence. Glow-curves:
resolution into individual peaks. Phys. Status Solidi 62, 331–340.
Mejdahl, V., 1979. Thermoluminescence dating: beta-dose attenuation IN quartz grains.
Archaeometry 21, 61–72.
Morley, D.W., Leng, M.J., Mackay, A.W., Sloane, H.J., Rioual, P., Battarbee, R.W., 2004.
Cleaning of lake sediment samples for diatom oxygen isotope analysis.
J. Paleolimnol. 31, 391–401.
Morthekai, P., Ali, S.N., 2014. Luminescence dating using quartz -for end-users.
Gondwana Geol. Mag. 291, 1–10.
Murray, A.S., Roberts, R.G., 1998. Measurement of the equivalent dose in quartz using a
regenerative-dose single-aliquot protocol. Radiat. Meas. 29, 503–515.
Murray, A.S., Wintle, A.G., 2003. The single aliquot regenerative dose protocol: potential
for improvements in reliability. Radiat. Meas. 37, 377–381.
Nair, S.L., Swathy, K.P.S., Ravindran, P., Varghese, T.I., 2020. A Critical Examination of
the Flooding and its Impact on the Munro Island in Southwest India, 21525.
Odp, 2007. Ocean Drilling Program - Final Technical Report (1983 - 2007.
Overstreet, W.C., 1967. The Geologic Occurrence of Monazite, Professional Paper- ed.
Pagonis, V., Ankjærgaard, C., Murray, A.S., Jain, M., Chen, R., Lawless, J., Greilich, S.,
2010. Modelling the thermal quenching mechanism in quartz based on time-resolved
optically stimulated luminescence. J. Lumin. 130, 902–909.
3.4. Way forward
While good comparability of ages of polyminerals and diatom frus
tules of the MT series (3/4 samples) is encouraging, it also calls for a
detailed investigation and some are highlighted here. Even though
avoiding phytoliths and sponge spicules is difficult, sieving out less than
10 μm siliceous particles during extraction may reduce their influence
on luminescence measurements. Considering the thin hollow nature of
diatom frustules, a detailed study on the dose rate to the frustules is
needed. Simulation on the dose deposition may be of great help in this
regard. Working with variety of diatom frustules from different
ecological settings might explain the observed difference in alpha effi
ciency and fading rate. Species-specific luminescence measurements will
aid in determining if luminescence characteristics vary due to differ
ences in diatom species.
4. Summary
Diatom frustules were extracted in such a way that the extracted
frustules are almost devoid of non-biogenic routinely used polymineral
grains. The luminescence signal was similar to that of quartz (stimula
tion: blue, and detection: UV) with preheating temperature of 200 ◦ C.
This signal might arise from a broad TL glow curve peaking at 245 ◦ C.
The De measurement protocol was adopted from that of quartz and
refined. The characteristic dose was observed to be 750 Gy using the
protocol. The dose recovery was within 10% but exhibited an over
estimation. When applied the refined dose estimating protocol to two
sedimentary profiles, fading rates and a-values were found different
between profiles. The sedimentary profile from Mahanadhi River basin
seems to suffer from dose rate issue. Another profile from Vembanad
Wetland have yielded three fourth comparable ages between diatom
frustules and fine grain polymineral. The observed contrasting results
between the profiles in terms of fading rate and alpha efficiency may be
understood 1) by measuring luminescence characteristics across
different regions, 2) or/and using species-specific luminescence mea
surements, and thus warrant detailed study.
Declaration of competing interest
The authors declare that they have no known competing financial
interests or personal relationships that could have appeared to influence
the work reported in this paper.
Acknowledgment
We thank our Director for providing facilities and encouragement
(BSIP/RDCC/Publication No. 67/2021–2022). M.K. Murari is finan
cially supported by Ministry of Earth Science reference number [MoES/
P.O.(Seismic) 8(09)-Geochron/2012]. We acknowledge Ishwar Shukla
for helping us in luminescence sample preparation, Dr. Subhoth Kumar
for helping us during SEM and EDX measurements, and Prof. Suchinder
Sharma (Amity University, Mohali) for discussion.
Appendix A. Supplementary data
Supplementary data to this article can be found online at https://doi.
org/10.1016/j.radmeas.2022.106803.
References
Adamiec, G., Aitken, M.J., 1998. Dose-rate conversion factors: update. Ancient TL 16,
37–50.
8
P. Morthekai et al.
Radiation Measurements 156 (2022) 106803
Prescott, J.R., Hutton, J.T., 1994. Cosmic ray contributions to dose rates for
luminescence and ESR dating: large depths and long-term time variations. Radiat.
Meas. 23, 497–500.
Preusser, F., Kasper, H.U., 2001. Comparison of dose rate determination using highresolution gamma spectrometry and inductively coupled plasma-mass spectrometry.
Ancient TL 19, 19–23.
Rieser, U., Edsall, D., 2004. OSL Dating of Diatoms: A Potential Application of an
Established Chronometric Method. AGU Fall Meeting Abstracts.
Shin, J.H., Serna, R., Hoven, G.N.v.d., Polman, A., , Sark, W.G.J.H.M.v., Vredenberg, A.
M., 1996. Luminescence quenching in erbium-doped hydrogenated amorphous
silicon. Appl. Phys. Lett. 68, 46–48.
Sulpis, O., Boudreau, B.P., Mucci, A., Jenkins, C., Trossman, D.S., Arbic, B.K., Key, R.M.,
2018. Current CaCO3 dissolution at the seafloor caused by anthropogenic CO2. Proc.
Natl. Acad. Sci. Unit. States Am. 115, 11700–11705.
Tr´eguer, P., Nelson, D.M., Bennekom, A.J.V., DeMaster, D.J., Leynaert, A., Qu´eguiner, B.,
1995. The silica balance in the world ocean: a Reestimate. Science 268, 375–379.
Tripathi, S., Basumatary, S., Singh, V., Bera, S., Nautiyal, C., Thakur, B., 2013.
Palaeovegetation and climate oscillation of western Odisha, India: a pollen databased synthesis for the Mid-Late Holocene. Quat. Int. 325.
Veerasamy, N., Sahoo, S.K., Inoue, K., Arae, H., Fukushi, M., 2020. Geochemical
behavior of uranium and thorium in sand and sandy soil samples from a natural high
background radiation area of the Odisha coast, India. Environ. Sci. Pollut. Control
Ser. 27, 31339–31349.
Wintle, A.G., 1975. Thermal quenching of thermoluminescence in quartz. Geophys. J.
Int. 41, 107–113.
Zuo, X., Lu, H., 2019. Phytolith radiocarbon dating: a review of previous studies in China
and the current state of the debate. Front. Plant Sci. 10.
9