Báo cáo khoa học: Revisiting the 13C-label distribution of the non-oxidative branch of the pentose phosphate pathway based upon kinetic and genetic evidence doc
Bạn đang xem bản rút gọn của tài liệu. Xem và tải ngay bản đầy đủ của tài liệu tại đây (443.93 KB, 13 trang )
Revisiting the 13C-label distribution of the non-oxidative
branch of the pentose phosphate pathway based upon
kinetic and genetic evidence
Roelco J. Kleijn, Wouter A. van Winden, Walter M. van Gulik and Joseph J. Heijnen
6 Department of Biotechnology, Delft University of Technology, Delft, the Netherlands
Keywords
8 13C labeling; metabolic flux analysis;
pentose phosphate pathway; transaldolase;
transketolase
Correspondence
1 R. J. Kleijn, Department of Biotechnology,
Delft University of Technology, Julianalaan
67, 2628BC Delft, the Netherlands
Fax: +31 15 2782355
Tel.: +31 15 2785025
E-mail:
2 Website: />(Received 24 June 2005, accepted 8 August
2005)
doi:10.1111/j.1742-4658.2005.04907.x
The currently applied reaction structure in stoichiometric flux balance models for the nonoxidative branch of the pentose phosphate pathway is not
in accordance with the established ping-pong kinetic mechanism of the
enzymes transketolase (EC 2.2.1.1) and transaldolase (EC 2.2.1.2). Based
upon the ping-pong mechanism, the traditional reactions of the nonoxidative branch of the pentose phosphate pathway are replaced by metabolite
specific, reversible, glycolaldehyde moiety (C2) and dihydroxyacetone moiety (C3) fragments producing and consuming half-reactions. It is shown
that a stoichiometric model based upon these half-reactions is fundamentally different from the currently applied stoichiometric models with respect
to the number of independent C2 and C3 fragment pools in the pentose
phosphate pathway and can lead to different label distributions for 13C-tracer experiments. To investigate the actual impact of the new reaction structure on the estimated flux patterns within a cell, mass isotopomer
measurements from a previously published 13C-based metabolic flux analysis of Saccharomyces cerevisiae were used. Different flux patterns were
found. From a genetic point of view, it is well known that several microorganisms, including Escherichia coli and S. cerevisiae, contain multiple
genes encoding isoenzymes of transketolase and transaldolase. However,
the extent to which these gene products are also actively expressed remains
7 unknown. It is shown that the newly proposed stoichiometric model allows
study of the effect of isoenzymes on the 13C-label distribution in the nonoxidative branch of the pentose phosphate pathway by extending the halfreaction based stoichiometric model with two distinct transketolase
enzymes instead of one. Results show that the inclusion of isoenzymes
affects the ensuing flux estimates.
During the past decade, 13C-labeling based metabolic
flux analysis (MFA) has increasingly been used to
understand the effect of genetic alterations [1,2], changes in external conditions [3,4] and different nutritional
regimes [5,6] on the metabolism of micro-organisms.
13
C-labeling based MFA relies on the feeding of
C-labeled substrate to a biological system, allowing
the labeled carbon atoms to distribute over the metabolic network, and subsequently measuring the
13
C-label distributions of intracellular and ⁄ or secreted
13
Abbreviations
C2, glycolaldehyde moiety; C3, dihydroxyacetone moiety; e4p, erythrose 4-phosphate; f6p, fructose 6-phosphate; fbp, fructose
3;4;5 1,6-bisphosphate; g1p, glucose 1-phosphate; g6p, glucose 6-phosphate; g3p, glyceraldehyde 3-phosphate; MFA, metabolic flux analysis;
p5p, pentose pool consisting of ribulose 5-phosphate, ribose 5-phosphate and xylulose 5-phosphate; PPP, pentose phosphate pathway; r5p,
ribose 5-phosphate; s7p, sedoheptulose 7-phosphate; SSres, sum of squared residuals; S2res, estimated error variance; TA, transaldolase;
TK, transketolase; TPP, thiamine pyrophosphate; x5p, xylulose 5-phosphate.
4970
FEBS Journal 272 (2005) 4970–4982 ª 2005 FEBS
R. J. Kleijn et al.
Tracing
compounds by means of NMR spectroscopy or MS.
The flux patterns within a metabolic network model
can be calculated by iteratively fitting simulated
13
C-label distributions for a chosen set of metabolic
fluxes to the measured 13C-label distributions [7].
Apart from MFA, the information richness of
13
C-labeling data also permits verification of the topology of metabolic network models. Furthermore, shortcomings in the stoichiometry of the metabolic network
can be localized and alterations to the model can be
hypothesized and validated [5,8,9].
A part of the metabolic network that has received
relatively little attention from the MFA community
with respect to model validation is the pentose phosphate pathway (PPP). This is rather surprising because
the PPP plays several key roles in the cell metabolism.
Apart from supplying the cell with precursors for
amino acid and nucleotide biosynthesis, it also plays a
crucial role in maintaining the cytosolic NADP+ ⁄
NADPH balance. In order to maintain this balance,
the flux through the oxidative branch of the PPP is
usually much larger than the drain on PPP metabolites
for the biosynthesis of building blocks, resulting in a
significant recycling and redistribution of the carbon
atoms via the nonoxidative branch. Incorrectly mapped
carbon atom distributions, owing to, for example, an
incomplete or incorrect metabolic model, can lead to
erroneously predicted label distributions (and consequently flux estimates) for 13C-tracer experiments.
Practically all stoichiometric flux balance models of
the nonoxidative branch of the PPP consist of three
reversible reactions, namely two transketolase (TK)
(EC 2.2.1.1) catalyzed reactions (r.1 and r.2) and one
transaldolase (TA) (EC 2.2.1.2) catalyzed reaction (r.3)
[6,1014]:
TK
x5p ỵ r5p $ s7p ỵ g3p
TK
x5p ỵ e4p $ f 6p ỵ g3p
TA
s7p þ g3p $ f 6p þ e4p
ðr.1Þ;
ðr.2Þ;
ðr.3Þ:
van Winden et al. [15] argued that the nonoxidative
branch of the PPP consists of more reactions than the
three conventional reactions shown above. Supporting
evidence from the literature was presented, indicating
that six additional reactions can take place [16–19]. Furthermore, van Winden et al. [5] demonstrated that the
incorporation of these reactions in the metabolic network model of Penicillium chrysogenum significantly
increased the goodness-of-fit to measured 13C-label distribution data and also resulted in a changed flux distribution. The six additional reactions consist of five
stoichiometric neutral reactions, two of which are
FEBS Journal 272 (2005) 4970–4982 ª 2005 FEBS
13
C in the pentose phosphate pathway
catalyzed by TA (r.8 and r.9) and three of which are catalyzed by TK (r.5, r.6 and r.7), and one additional
reversible TK-catalyzed reaction (r.4). Although the stoichiometric neutral reactions have no effect on the mass
balances set up over the system, they do influence the
labeling pattern of the metabolite pools and thus need
to be incorporated into the metabolic network for
13
C-based flux estimations [18,20]. The structure of reactions r.1–9 is such that a carbon fragment is transferred
from one substrate to another, yielding two products.
From hereon any nonoxidative PPP reactions abiding
by this structure are denoted as traditional reactions:
TK
f 6p ỵ r5p $ e4p ỵ s7p
TK
g3p ỵ x5p ! x5p ỵ g3p
TK
f 6p ỵ e4p ! e4p ỵ f 6p
TK
r5p ỵ s7p ! s7p ỵ r5p
TA
f 6p ỵ g3p ! g3p ỵ f 6p
TA
e4p ỵ s7p ! s7p ỵ e4p
r.4ị;
r.5ị;
r.6ị;
r.7ị;
r.8ị;
r.9ị:
In this article, results of genetic and kinetic studies into
the nonoxidative branch of the PPP are analyzed and
used to obtain a more realistic stoichiometric flux balance model. Based upon the kinetic mechanism of TA
and TK, an alternative reaction structure for tracing
the distribution of 13C through the nonoxidative
branch of the PPP is proposed. It is shown that a stoichiometric flux balance model, based upon this new
reaction structure, is fundamentally different from the
current models with respect to 13C-label distribution
and, consequently, can yield different flux patterns.
Moreover, the new reaction structure facilitates the
estimation of the metabolic fluxes from the 13C-labeling data as the result of a smaller number of parameters. Following genetic evidence, the presence of
isoenzymes for TK and TA is incorporated to further
refine the stoichiometric model. The effect of these
model alterations on the estimated 13C-based flux patterns is examined using a recently published MFA for
Saccharomyces cerevisiae based upon mass isotopomer
measurements of 13C-labeled primary metabolites [21].
Theory
Kinetic mechanism of the nonoxidative branch
of the PPP
The enzymes TK and TA catalyze the transfer of twoand three-carbon fragments from a ketose donor to an
4971
Tracing
13
C in the pentose phosphate pathway
R. J. Kleijn et al.
aldose acceptor. TK performs this glycolaldehyde (C2)
transfer using a tightly bound thiamine pyrophosphate
(TPP) as cofactor. The second carbon atom of the
thiazole ring of TPP readily ionizes to give a carbanion, which can react with the carbonyl group of the
ketose substrates: xylulose 5-phosphate (x5p), fructose
6-phosphate (f6p) or sedoheptulose 7-phosphate (s7p).
The phosphorylated part of the ketose substrate splits
off, leaving a negatively charged C2 attached to TPP.
Resonance forms keep the glycolaldehyde unit
attached to TPP until a suitable acceptor has been
found in the form of ribose 5-phosphate (r5p), erythrose 4-phosphate (e4p) or glyceraldehyde 3-phosphate
(g3p) [22]. In contrast to TK, TA does not contain a
prosthetic group. Instead, a Schiff base is formed
between the carbonyl group of the ketose substrate
(f6p, s7p) and the e-amino group of a lysine residue of
the active site of the enzyme, leading to the formation
of either g3p or e4p while leaving behind the bound dihydroxyacetone (C3). The nitrogen atom of the Schiff
base (similar to the nitrogen atom in the thiazole ring
of TK) stabilizes the dihydroxyacetone unit using resonance forms until a suitable aldose (g3p, e4p) acceptor is bound [22].
The kinetic mechanism employed by both enzymes
has been characterized as a reversible ping-pong mechanism [23–25]. Bi-bi reactions use this mechanism to
shuttle molecule fragments from one compound to
A
K
A
another, epitomized by the fact that the first substrate is
released from the holoenzyme before the second substrate binds. For the enzymes TK and TA this implies
that the cleaved phosphorylated fragment of the ketose
substrate is first detached from the enzyme before the
stabilized carbon fragment (glycoaldehyde for TK and
dihydroxyacetone for TA) is donated to a suitable
aldose acceptor. This mechanism is in conflict with the
traditional reactions. The structure of the traditional
reactions is such that a C2 or C3 fragment is transferred
from one specific donor to one specific acceptor molecule. This reaction structure is in agreement with a
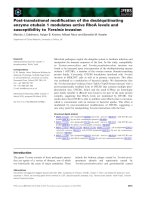
so-called ordered sequential kinetic mechanism. The difference between a sequential and a ping-pong kinetic
mechanism is illustrated in Fig. 1. Whereas the correct
ping-pong mechanism for TK and TA was adopted by
several researchers in the 1990s to construct detailed
kinetic models [20,26–28], this has been largely overlooked by the metabolic engineering community.
In accordance with the ping-pong mechanism
employed by TA and TK, the traditional reactions of
the nonoxidative branch of the PPP can be represented
as metabolite specific, reversible C2 and C3 fragments
producing and consuming half-reactions for each of
the metabolites s7p, f6p, x5p, r5p, e4p and g3p (r.10–
14). Note that the C2 and C3 fragments remain bound
to the holoenzyme (E) until they are transferred to an
acceptor:
A
K
C
K
E
E
I
C
C
K
C
E
K
A
K
C
A
E
C
A
E
E
A
K
C
K
II
E
A
E
K
K
C
A
E
4972
C
C
E
K
C
E
A
A
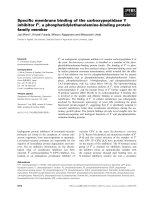
Fig. 1. Schematic representation of the two
kinetic mechanisms used for modeling the
transketolase- and transaldolase-catalyzed
reactions of the pentose phosphate pathway: (I) ping-pong mechanism and (II)
(ordered) sequential mechanism. Depicted
are the ketose substrate (K), the aldose
acceptor (A), the transferred carbon-fragment (C), and the enzyme ⁄ cofactor complex
(E).
FEBS Journal 272 (2005) 4970–4982 ª 2005 FEBS
R. J. Kleijn et al.
Tracing
TK
x5p $ g3p ỵ E C2
TK
f 6p $ e4p ỵ E C2
TK
s7p $ r5p þ E À C2
TA
f 6p $ g3p þ E À C3
TA
s7p $ e4p ỵ E C3
r.10ị;
r.11ị;
r.12ị;
r.13ị;
r.14ị:
Using the above half-reactions, a C2 fragment-producing reaction (e.g. x5p fi g3p + E ) C2) can be
coupled to a C2 fragment-consuming reaction (e.g.
e4p + E ) C2 fi f6p), leading to one of the traditional
reactions (in this case r.2: x5p +e4p fi f6p + g3p).
In total, 13 different combinations of half-reactions
are possible: the three C2 fragment-donating half-reactions can be combined with three C2 fragment-accepting half-reactions, and the two C3 fragment-donating
half-reactions can be combined with the two C3 fragment-accepting half-reactions, leading to the three
conventional reactions (r.1–3) and the six additional
reactions (r.4–9).
Interestingly, the half-reactions r.10–14 can be used
to show that a stoichiometric model for the nonoxidative branch of the PPP, based upon traditional reactions r.1–3, is, in essence, incomplete. In order to
perform these three reactions in forward and backward
directions, all five proposed half-reactions (r.10–14) are
needed. The reversibility of the traditional reactions
was argued by Follstad et al. [29], a claim supported
by most textbooks [22,30]. However, recombination of
the half-reactions into their traditional counterparts
leads to nine reversible reactions (r.1–9), as shown in
the previous paragraph. Therefore, given the reversibility of the TK- and TA-catalyzed reactions, and their
demonstrated ping-pong mechanism, one has to conclude that in addition to traditional reactions r.1–3,
one should also incorporate the other six traditional
reactions (r.4–9) when constructing a stoichiometric
model for the nonoxidative branch of the PPP.
13
C in the pentose phosphate pathway
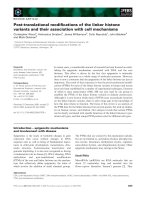
lead to only one C2 and one C3 fragment pool, from
which carbon fragments are retrieved and attached to
any suitable acceptor (Fig. 2). As the number of nonoxidative PPP reactions increases, application of the
traditional reactions leads to an increase in the number
of distinct C2 and C3 fragment pools. As a result of
these segregated pools, the 13C labeling of the C2 and
C3 fragments (and, consequently, the labeling of the
metabolites formed from these) can differ from the 13C
labeling of the single C2 and C3 fragment pools generated by the half-reactions.
Genetic organization of the nonoxidative branch
of the PPP
In recent years, the genes encoding the enzymes of the
nonoxidative branch of the PPP have been sequenced
and cloned for many micro-organisms. It was found
that several micro-organisms, including Escherichia coli
and S. cerevisiae, contain two TK genes, named tkl1
and tkl2 in S. cerevisiae [31,32] and tktA and tktB in
E. coli [33]. The combined fact that several microorganisms possess two TK genes and that most stoichiometric flux balance models of the nonoxidative
branch of the PPP contain only two TK-catalyzed
reactions (r.1–2), has led to the common misunderstanding that each reaction is catalyzed by a separate
TK (either tkl1 or tkl2). In several publications it is
assumed that the TK encoded by tkl1 ⁄ tktA specifically
Traditional vs. half-reactions: implications for
C-labeling
13
From a labeling point of view, the main difference
between modeling the stoichiometry of the nonoxidative branch of the PPP using either traditional reactions or half-reactions, is the number of independent
C2 and C3 fragment pools that each approach generates. The traditional reactions will lead to separate C2
and C3 fragment pools for each of the nine possible
reactions (r.1–9), while the half-reactions by definition
FEBS Journal 272 (2005) 4970–4982 ª 2005 FEBS
Fig. 2. Number of glycolaldehyde (C2) and dihydroxyacetone (C3)
fragment pools in the nonoxidative branch of the pentose phosphate pathway based upon a stoichiometric model constructed
from traditional reactions (I) and half-reactions (II). The number of
C2 and C3 fragment-producing reactions when applying the traditional reactions is denoted by n and m, respectively.
4973
Tracing
13
C in the pentose phosphate pathway
catalyzes the reversible reaction r.1, while the TK
encoded by tkl2 ⁄ tktB catalyzes the reversible reaction
r.2 [11,12,34–37]. In reality, the TK gene products in
S. cerevisiae and E. coli are isoenzymes, each of which
is capable of nonspecifically catalyzing both reactions
r.1 and r.2 in the nonoxidative branch of the PPP
[38–42]. As expected, the two isoenzymes of S. cerevisiae and E. coli show a strong resemblance with
respect to amino acid residues; homology was measured to be 71% [32] and 74% [33], respectively.
The presence of isoenzymes for TA has been studied
to a lesser extent. Microorganisms containing multiple
genes with TA activity do exist, an example being
E. coli, which contains two isoenzymes for TA (talA ⁄
talB) [38,40]. The talB gene of E. coli has been shown
to encode a functional TA [43], while the functionality
of the talA gene has not been shown, to date. S. cerevisiae contains one verified TA gene, named tal1 [44].
Recently, a hypothetical ORF for a possible second
TA was found [38,41].
Using this genetic information the stoichiometric
model for the nonoxidative branch of the PPP can be
further refined. Although homology between isoenzymes is normally quite high, differences in substrate
affinity are common [45]. If evidence for isoenzymes of
TK and ⁄ or TA exists, one can opt for a model with
two sets of half-reactions, in which each set of halfreactions models the transfer of the C2 or C3
fragments for one isoenzyme. As a result of this modification, a second set of C2 and C3 fragment pools is
created in the nonoxidative branch of the PPP. Note
that genetic evidence alone is not sufficient proof for
the actual expression of isoenzymes; this expression
should be verified under relevant culture conditions.
The literature shows that in S. cerevisiae, the activity
of the tkl2-encoded TK appears to be very low when
growing cells in batch on a synthetic mineral salts
medium with glucose as the carbon source [32]. Furthermore, deletion mutants of tkl2 showed no changed
phenotype, while deletion mutants of tkl1 were found
to have a slower growth rate [46]. A similar trend was
found for the isoenzymes of E. coli, where the tktAencoded TK and talB-encoded TA accounted for the
majority of the cellular activity [47–49].
Model construction and analysis
Using the five half-reactions (r.10–14), a new stoichiometric model for the combined glycolysis and PPP was
constructed, as shown in Fig. 3II (from hereon referred
to as the half-reaction model). Note that this model
does not yet take into account the presence of isoenzymes for TK and TA, as it only contains a single C2
4974
R. J. Kleijn et al.
and C3 fragment pool. As a comparison, Fig. 3I shows
the equivalent stoichiometric model based upon the
traditional reactions (henceforth called the traditional
model). Note that this model contains both the conventional nonoxidative PPP reactions (Fig. 3IA) as well
as the six additional reactions proposed by van Winden et al. [15] (Fig. 3IB). The traditional model has
previously been used to fit the metabolic fluxes of
P. chrysogenum and S. cerevisiae [5,21].
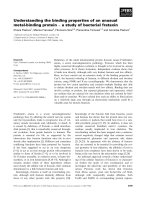
The half-reaction model of Fig. 3II covers the complete range of possible reactions, yet it significantly
reduces the number of free fluxes that have to be estimated from the 13C-labeling data during the flux fitting
procedure. The model contains 12 reactions (n1–n12)
and eight reversibilities, which are constrained by 10
mass balances over the intracellular metabolites in a
(pseudo) steady state. When normalizing the rates relative to the uptake rate of glucose, nine free fluxes
remain to be estimated from the 13C-labeling data. The
corresponding traditional model (Fig. 3I) contains 16
reactions (v1–v16) and seven reversibilities. Under
(pseudo) steady-state conditions, eight reaction rates
are fixed by mass balances over the intracellular
metabolites. Normalization of the fluxes to the glucose
uptake rate thus leaves 14 free fluxes.
The half-reaction model can be extended with a second set of half-reactions to account for the possible
presence of isoenzymes for TK (r.10–13) and ⁄ or TA
(r.14–15). This extension will increase the number of
free fluxes that have to be estimated from the 13C-labeling data. In the case of two actively expressed genes
for TK, this will result in five additional free fluxes
because the six additional half-reactions are constrained by one extra mass balance over the second C2
fragment pool. As a result, the total number of free
fluxes (14) equals the number of free fluxes in the traditional model.
Results and Discussion
Traditional vs. half-reaction model: three
theoretical cases
To illustrate the difference in 13C-labeling distribution
when using either traditional reactions or half-reactions to model the nonoxidative branch of the PPP,
three simplified metabolic networks were formulated
(cases 1–3). Note that the three networks are oversimplified and are solely used to clarify the difference in
13
C-label distribution that can occur between the two
different modeling approaches.
For case 1 consider the traditional model of Fig. 3,
but now containing only the conventional nonoxidative
FEBS Journal 272 (2005) 4970–4982 ª 2005 FEBS
R. J. Kleijn et al.
Tracing
13
C in the pentose phosphate pathway
Fig. 3. Traditional (I) and half-reaction (II)
stoichiometric flux balance models for the
13 upper glycolysis and PPP. The nonoxidative
pentose phosphate pathway reactions of
the traditional model are split up into the
three conventional reactions (r.1–3) (IA) and
the six additional reactions (r.4–9) (IB).
Closed arrows denote the direction of the
forward flux in the case of reversible
reactions.
PPP reactions (Fig. 3IA). The reversibilities of the three
bidirectional nonoxidative PPP reactions and the three
bidireactional glycolytic reactions are set at zero, such
that the PPP overall converts three p5p molecules (i.e. a
pentose pool consisting of ribulose 5-phosphate, ribose
5-phosphate and xylulose 5-phosphate) into two f6p
molecules and one g3p molecule. Consequently, only
the forward reactions of the PPP (v8f, v9f, v14f) and the
glycolysis (v2f, v3f, v5f) are active. Analogous to the traditional model, only the forward glycolytic reactions
are included in the half-reaction model (n5f, n3f and
n2f). Using the relations in Appendix I, the active nonoxidative PPP reaction rates in the traditional model
are converted to the corresponding rates in the halfreaction model, resulting in substantial throughput for
half-reactions n8f, n9b, n10b, n11b and n12f. Investigation
of the acceptor and the donor of the C2 fragment in
both models shows that the traditional model contains
FEBS Journal 272 (2005) 4970–4982 ª 2005 FEBS
two C2 fragment pools created by reactions v8f and v9f,
while the half-reaction model by definition contains one
single C2 fragment pool that is solely formed by reaction n8f (Fig. 4). However, both C2 fragment pools in
the traditional model are formed by the cleavage of p5p
and can thus be lumped into a single pool, resulting in
identical C2 fragment pools for both modeling approaches. Examination of the origin of the C3 fragment
pools shows that both models contain only one C3 fragment-producing reaction, both with s7p as the donor
(v14f, n12f). So, in essence, both models described in this
case contain one C2 and one C3 fragment pool. As a
result, the redistribution of 13C atoms in the PPP is
identical for both models.
For case 2 consider the same traditional model as
used in case 1, supplemented with the stoichiometric
neutral exchange reaction for e4p and f6p (v12 in
Fig. 3IB). In the half-reaction model this means an
4975
Tracing
13
C in the pentose phosphate pathway
R. J. Kleijn et al.
Fig. 4. Route traversed by the glycolaldehyde (C2) fragments of the transketolasecatalyzed reactions present in the simplified
traditional model (I) and half-reaction model
(II) of cases 1 and 2 (see the main text).
The colored spheres represent the carbon
atoms from which the C2 fragment is constructed. A different 13C labeling of the C2
fragment is denoted by a different color.
Consequently, the 13C labeling of the top
two-carbon fragments of the p5p and f6p
depicted in this figure is different.
increase in n9f and n9b (see Appendix I). As a result of
this additional reaction, C2 fragments are now also
produced from f6p, thus increasing the number of C2
fragment pools in the traditional model to three
(Fig. 4). The absence of bidirectional reactions makes
it impossible for the three C2 fragment pools, originating from either p5p or f6p, to efface their labeling
differences. A different labeling of f6p (in comparison
to p5p) therefore by necessity leads to two unique C2
fragment pools in the traditional model. The half-reaction model inherently contains one single C2 fragment
pool that comprises all distinct C2 fragment pools of
the traditional model, as shown in Fig. 4. From this
single pool a C2 fragment is randomly retrieved and
attached to any suitable acceptor. Consequently, the
top two carbon atoms of s7p synthesized in the halfreaction model can originate from either f6p or p5p,
while in the traditional model they can only originate
from p5p. In a 13C-labeling experiment with 100% 13C1
glucose this will result in the synthesis of unlabeled and
13
C1-labeled s7p for the half-reaction model, in contrast
to only unlabeled s7p for the traditional model.
For case 3 consider the same traditional and halfreaction model as used in case 2, but now with all
4976
bidirectional reactions set at maximum reversibility
(99.9%). Owing to this reversibility assumption, the
number of C2 fragment-producing reactions in the traditional model increases from two to four (v8f, v8b, v9f
and v9b). However, the high reversibility of the bidirectional reactions also ensures that the label distributions
of the C2 fragment pools (and also the C3 fragment
pools) are fully exchanged, effacing the differences in
labeling pattern amongst the separate pools. As a
result, no difference in isotopomer distribution is
observed between the two models under conditions of
high reversibility.
The three cases discussed above show that the difference in 13C-label distribution amongst the two modeling approaches becomes more pronounced as the
number of C2 and C3 fragment-producing reactions
increases, while high reaction reversibilities diminish
this difference. In reality the nonoxidative branch of
the PPP contains multiple C2 and C3 fragment-producing reactions, thereby in essence creating different
13
C-label distributions. As shown in case 3, these differences can be alleviated by high reversibilities for the
nonoxidative PPP reactions. Even though the reversibility of these reactions was argued by Follstad &
FEBS Journal 272 (2005) 4970–4982 ª 2005 FEBS
R. J. Kleijn et al.
9 Stephanopoulos [29], it remains questionable whether
these reversibilities are high enough to efface the difference in 13C-label distribution created by the multiple
C2 and C3 fragment-producing reactions.
Application of the half-reaction model: flux
patterns in S. cerevisiae
To investigate the actual difference in estimated flux
patterns when applying either the traditional model or
the half-reaction model shown in Fig. 3, measured
mass isotopomers of 13C-labeled primary metabolites
[21] were used to refit the fluxes in the glycolysis and
the PPP of S. cerevisiae CEN.PK113-7D. Similarly to
the previously published fit, only measured mass isotopomer fractions larger than 0.03 were included.
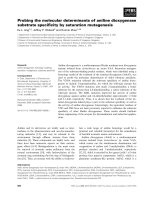
Figures 5I,II and Table 1 show the previously estimated flux patterns for the traditional model, as well as
the newly estimated flux patterns using the half-
Tracing
13
C in the pentose phosphate pathway
reaction model. In order to facilitate the comparison
of the two flux sets in Table 1, the flux estimates for the
traditional model have been converted into their corresponding half-reaction rates using the equations given in
Appendix I. The difference in flux pattern is evident,
although, in general, not very large. As expected, the
largest differences are found for the PPP split-ratio and
the fluxes of the nonoxidative branch of the PPP.
The minimized covariance-weighted sum of
squared residuals (SSres) in these fits was calculated
to be 20.9 and 6.5 for the half-reaction and traditional model, respectively. The SSres is distributed
according to a v2(n-p) distribution, with n-p being
the degrees of freedom equal to the number of independent data points (n ¼ 26) minus the number of
free parameters (P ¼ 14 and 9 for the traditional
and the half-reaction model, respectively). Given the
probabilities P[v2(12) > 6.5] ¼ 0.89 and P[v2(17) >
20.9] ¼ 0.23, it follows that within the 95%
Fig. 5. Fitted fluxes for the traditional model
(I), the half-reaction model (II) and the ‘double transketolase’ half-reaction model (III),
based upon the mass isotopomer measurements of 13C-labeled primary metabolites as
presented in van Winden et al. [21]. Fluxes
are normalized for the glucose-uptake rate.
Values outside parentheses denote the net
fluxes, while values inside parentheses
represent the exchange fluxes. Solid arrow14 heads denote the direction of the net flux.
FEBS Journal 272 (2005) 4970–4982 ª 2005 FEBS
4977
Tracing
13
C in the pentose phosphate pathway
R. J. Kleijn et al.
Table 1. Comparison of the flux estimates for the traditional and
half-reaction models presented in Fig. 5I,II. The pentose phosphate
pathway fluxes in the traditional model have been converted to
their corresponding fluxes in the half-reaction model using the
15 equations in Appendix I.
Reaction
no.
Fluxes in the
half-reaction
model
Converted fluxes
in the traditional
model
Relative
change
(%)
n1
n2 net
n2 exchange
n3 net
n3 exchange
n4
n5 net
n5 exchange
n6
n7
n8 net
n8 exchange
n9 net
n9 exchange
n10 net
n10 exchange
n11 net
n11 exchange
n12 net
n12 exchange
100
26
134
56
> 1000
65
65
221
121
18
9
4
)3
10
)6
124
)6
25
6
0
100
26
105
50
> 1000
63
63
194
119
24
13
10
)5
155
)8
4898
)8
24
8
0
0
0
21
11
–
3
3
13
2
36
48
> 100
67
> 100
38
> 100
38
4
38
0
confidence interval both models give statistically
acceptable flux estimates. Even though both models
are statistically acceptable, it must be noted that the
discrepancy between the measured and the fitted
mass isotopomers (SSres) is higher for the half-reaction model. One possible explanation for the higher
SSres in the half-reaction model is an overparameterization of the traditional model. In an overparameterized model, some parameters are actually used to fit
measurement errors, thereby underestimating the true
SSres [50]. To determine the extent of this overparameterization, the estimated error variance (s2 ) criterres
ion can be used:
SSres
:
s2 ¼
res
nÀp
This criterion minimizes the variance of the sum of
squared residuals by dividing the SSres of a model by
its degrees of freedom. As the traditional model contains more parameters than the half-reaction model,
this will result in a smaller denominator for s2 , thus
res
compensating for any possible overparameterization.
Nevertheless, the traditional model gives an s2 of 0.54
res
compared to 1.23 for the half-reaction model, implying
that the traditional model performs better from a statistical point of view.
4978
A second explanation for the higher SSres found
for the half-reaction model might be the presence of
isoenzymes for TK. As stated above, the genome of
S. cerevisiae contains two genes encoding a TK,
which adds a second C2 fragment pool to the metabolic network model. To test whether the introduction of an isoenzyme for TK in the metabolic
network model results in a better fit, the half-reaction model in Fig. 3 was expanded with a second set
of TK half-reactions (r.10–12) and subsequently used
to fit the measured mass isotopomer fractions of
S. cerevisiae. Figure 5III shows the estimated reaction
rates for the so-called ‘double TK’ half-reaction
model. The SSres for this model was 6.5, meaning
that this model also adequately fitted the measured
mass isotopomer fractions {P[v2(12) > 6.5] ¼ 0.89}.
Interestingly, exactly the same values for the minimized SSres and the number of free parameters (14)
were found for both the ‘double TK’ half-reaction
and the traditional model, making it impossible to
distinguish the two models using the s2 criterion.
res
Table 2 shows that the flux estimates for both models were also very similar. The resemblance between
the two models can be understood when one realizes
that both models, unlike the half-reaction model,
have the ability to create separate C2 fragment pools.
Considering the reported finding that tkl1 encodes
the majority of the TK activity in S. cerevisiae cells
grown in synthetic mineral medium on glucose, it
was not anticipated that the addition of a TK isoenzyme to the metabolic network model would result
in an increased goodness-of-fit. It must be noted that
the prevalence of the tkl1-encoded TK was measured
under excess glucose conditions, while the 13C-labeling experiment was performed in a chemostat under
glucose-limiting conditions.
Conclusion
This study shows that a good understanding of enzyme
genetics and kinetics is crucial for a correct 13C-label
distribution prediction in stoichiometric flux balance
models. When comparing two models of the nonoxidative branch of the PPP based, respectively, on the
traditional reactions and the kinetically derived halfreactions, it was demonstrated that the main difference
between the two reaction structures is the number of
independent C2 and C3 fragment pools present in the
stoichiometric model. Whereas the traditional reactions
lead to multiple independent pools, the half-reactions
result in only one C2 and one C3 fragment pool. This
difference in C2 and C3 fragment pools influences the
ensuing label distribution when conducting 13C-tracer
FEBS Journal 272 (2005) 4970–4982 ª 2005 FEBS
R. J. Kleijn et al.
Tracing
Table 2. Comparison of the flux estimates for the traditional and
the ‘double transketolase’ (‘double TK’) half-reaction model presented in Fig. 5II,III. The two separate fluxes for the transketolase-catalyzed half-reactions in the ‘double TK’ half-reaction model have
been summed to allow for comparison with the converted fluxes of
the traditional model shown in Table 1.
Reaction
no.
Converted fluxes
in the ‘double TK’
half-reaction model
Converted fluxes
in the traditional
model
Relative
change
(%)
n1
n2 net
n2 exchange
n3 net
n3 exchange
n4
n5 net
n5 exchange
n6
n7
n8 net
n8 exchange
n9 net
n9 exchange
n10 net
n10 exchange
n11 net
n11 exchange
n12 net
n12 exchange
100
26
103
50
> 1000
63
63
199
118
25
13
10
)5
100
)8
11
)8
24
8
0
100
26
105
50
> 1000
63
63
194
119
24
13
10
)5
155
)8
4898
)8
24
8
0
0
0
2
1
–
0
0
3
0
2
3
0
4
55
3
> 100
3
2
3
0
13
C in the pentose phosphate pathway
S. cerevisiae more accurate measurement techniques
are needed to discriminate between the different
stoichiometric models for the nonoxidative branch of
the PPP, in combination with genetic and biochemical
evidence on the number of active TK and TA isoenzymes under the experimental conditions used. In
spite of their practical similarity, clear differences
between the traditional and half-reaction models were
illustrated by means of three theoretical cases. Therefore, considering the established ping-pong mechanism
of TK and TA, we recommend the use of the halfreaction model when modeling the label distribution
in the nonoxidative PPP, bearing in mind that isoenzymes for TK and TA may exist.
Experimental procedures
Metabolic network model
Apart from the variations in the stoichiometric model of
the PPP discussed in this work, the other parts of the stoichiometric model used for fitting the fluxes of S. cerevisiae
were identical to those presented by van Winden et al. [21].
For simplicity reasons the consumption of metabolites for
the synthesis of biomass precursors and the reversible flux
towards storage carbohydrates are not shown in the metabolic network model depicted in Fig. 3, but these were
accounted for when fitting 13C-labeling data. The reversible
reactions in Fig. 3 were modeled as separate forward and
backward reactions and are referred to as net and exchange
fluxes, where:
experiments. An additional advantage of using halfreactions is the decreased number of free parameters
vnet ¼ vforward À vbackward
that have to be estimated by fitting 13C-labeling data
to the stoichiometric model.
vexchange ¼ minðvforward ; vbackward Þ
Mass isotopomer measurements from a previously
published study on S. cerevisiae were used to compare
Flux-fitting procedure
the traditional and half-reaction model depicted in
Fig. 3, resulting in statistically acceptable fits for both
The flux fitting procedure employed is described in detail
models. Different flux patterns were found for the
by van Winden et al. [21]. In short, the procedure uses the
two models, but no major rerouting of metabolic
cumomer balances and cumomer to isotopomer mapping
fluxes was observed. The incorporation of genetic
matrices introduced by Wiechert et al. [51] to calculate the
knowledge into the metabolic network model for the
isotopomer distributions of metabolites in a predefined
nonoxidative branch of the PPP introduced the possimetabolic network model for a given flux set. The flux set
bility of modeling the presence of isoenzymes for TK
that gives the best correspondence between the measured
and simulated 13C-label distribution is determined by nonand TA. Extending the half-reaction model from one
linear optimization and denoted as the optimal flux fit. All
to two autonomously functioning TK enzymes resulcalculations were performed in Matlab 6.1 (The Mathworks
ted in a doubling of the number of C2 fragment
pools. The fitting of measurement data to a ‘double 10 Inc., Natick, MA, USA).
TK’ half-reaction model yielded flux estimates and an
SSres that were similar to those of the traditional
Acknowledgements
model. The similarity of the flux estimates indicates
This work was financially supported by the Dutch
that the presence of isoenzymes reduces the difference
EET program (Project No. EETK20002) and DSM.
in 13C-label distribution between the two models and
impedes their discrimination. This shows that for
FEBS Journal 272 (2005) 4970–4982 ª 2005 FEBS
4979
Tracing
13
C in the pentose phosphate pathway
References
1 Wittmann C & Heinzle E (2002) Genealogy profiling
13
through strain improvement by using metabolic network
analysis: metabolic flux genealogy of several generations
of lysine-producing corynebacteria. Appl Environ Microbiol 68, 5843–5859.
2 Van Dien SJ, Strovas T & Lidstrom ME (2003) Quanti14
fication of central metabolic fluxes in the facultative
methylotroph Methylobacterium extorquens AM1 using
13C-label tracing and mass spectrometry. Biotechnol
Bioeng 84, 45–55.
15
3 Maaheimo H, Fiaux J, Cakar ZP, Bailey JE, Sauer U &
Szyperski T (2001) Central carbon metabolism of Saccharomyces cerevisiae explored by biosynthetic fractional
16
(13)C labeling of common amino acids. Eur J Biochem
11
268, 2464–2479.
4 Fiaux J, Andersson CIJ, Holmberg N, Bulow L, Kallio
17
PT, Szyperski T, Bailey JE & Wuthrich K (1999) C-13
NMR flux ratio analysis of Escherichia coli central carbon metabolism in microaerobic bioprocesses. J Am
18
Chem Soc 121, 1407–1408.
5 van Winden WA, van Gulik WM, Schipper D,
Verheijen PJT, Krabben P, Vinke JL & Heijnen JJ
(2003) Metabolic flux and metabolic network analysis of
Penicillium chrysogenum using 2D [C-13, H-1] COSY
19
NMR measurements and cumulative bondomer simulation. Biotechnol Bioeng 83, 75–92.
6 Gombert AK, dos Santos MM, Christensen B &
Nielsen J (2001) Network identification and flux quanti20
fication in the central metabolism of Saccharomyces cerevisiae under different conditions of glucose repression.
J Bacteriol 183, 1441–1451.
7 Wiechert W (2001) 13C metabolic flux analysis. Metab
21
Eng 3, 195–206.
8 Christensen B & Nielsen J (2000) Metabolic network
analysis of Penicillium chrysogenum using (13)C-labeled
glucose. Biotechnol Bioeng 68, 652–659.
9 Petersen S, de Graaf AA, Eggeling L, Mollney M,
Wiechert W & Sahm H (2000) In vivo quantification of
22
parallel and bidirectional fluxes in the anaplerosis of
Corynebacterium glutamicum. J Biol Chem 275, 35932–
23
35941.
10 Marx A, de Graaf AA, Wiechert W, Eggeling L &
Sahm H (1996) Determination of the fluxes in the cen12
tral metabolism of Corynebacterium glutamicum by
nuclear magnetic resonance spectroscopy combined with
24
metabolite balancing. Biotechnol Bioeng 49, 111–129.
11 Zhang HM, Shimizu K & Yao SJ (2003) Metabolic flux
analysis of Saccharomyces cerevisiae grown on glucose,
glycerol or acetate by C-13-labeling experiments. Biochem Eng J 16, 211–220.
12 Schmidt K, Nielsen J & Villadsen J (1999) Quantitative
25
analysis of metabolic fluxes in Escherichia coli, using
4980
R. J. Kleijn et al.
two-dimensional NMR spectroscopy and complete
isotopomer models. J Biotechnol 71, 175–189.
dos Santos MM, Gombert AK, Christensen B, Olsson
L & Nielsen J (2003) Identification of in vivo enzyme
activities in the cometabolism of glucose and acetate by
Saccharomyces cerevisiae by using 13C-labeled substrates. Eukaryotic Cell 2, 599–608.
Wittmann C & Heinzle E (2001) Application of
MALDI-TOF MS to lysine-producing Corynebacterium
glutamicum – a novel approach for metabolic flux analysis. Eur J Biochem 268, 2441–2455.
van Winden W, Verheijen P & Heijnen S (2001) Possible
pitfalls of flux calculations based on (13)C-labeling.
Metab Eng 3, 151–162.
Clark MG, Williams JF & Blackmore PF (1971) The
transketolase exchange reaction in vitro. Biochem J 125,
381–384.
Williams JF, Blackmore PF & Clark MG (1978) New
reaction sequences for the non-oxidative pentose phosphate pathway. Biochem J 176, 257–282.
Flanigan I, Collins JG, Arora KK, Macleod JK &
Williams JF (1993) Exchange-reactions catalyzed by
group-transferring enzymes oppose the quantitation and
the unraveling of the identity of the pentose pathway.
Eur J Biochem 213, 477–485.
Ljungdahl L, Wood HG, Couri D & Racker E (1961)
Formation of unequally labeled fructose 6-phosphate by
an exchange reaction catalyzed by transaldolase. J Biol
Chem 236, 1622–1625.
Berthon HA, Bubb WA & Kuchel PW (1993) 13C
n.m.r. isotopomer and computer-simulation studies of
the nonoxidative pentose-phosphate pathway of human
erythrocytes. Biochem J 296, 379–387.
van Winden WA, van Dam JC, Ras C, Kleijn RJ,
Vinke JL, van Gulik WM & Heijnen JJ (2005)
Metabolic-flux analysis of Saccharomyces cerevisiae
CEN.PK113–7D based on mass isotopomer measurements of (13)C-labeled primary metabolites. FEMS
Yeast Res 5, 559–568.
Stryer L (1995) Biochemistry, 4th edn. W.H. Freeman,
New York.
Horecker BL, Cheng T & Pontremoli S (1963) Coupled
reaction catalyzed by enzymes transketolase and transaldolase. II. Reaction of erythrose 4-phosphate and transaldolase–dihydroxyacetone complex. J Biol Chem 238,
3428–3431.
Kato N, Higuchi T, Sakazawa C, Nishizawa T, Tani
Y & Yamada H (1982) Purification and properties of
a transketolase responsible for formaldehyde fixation
in a methanol-utilizing yeast, Candida boidinii
(Kloeckera Sp), 2201. Biochim Biophys Acta 715,
143–150.
Wood T (1985) The Pentose Phosphate Pathway. Academic Press Inc., London.
FEBS Journal 272 (2005) 4970–4982 ª 2005 FEBS
R. J. Kleijn et al.
26 Sabate L, Franco R, Canela EI, Centelles JJ & Cascante
M (1995) A model of the pentose-phosphate pathway in
rat liver cells. Mol Cell Biochem 142, 9–17.
27 Mcintyre LM, Thorburn DR, Bubb WA & Kuchel PW
(1989) Comparison of computer simulations of the
F-type and L-type non-oxidative hexose-monophosphate
shunts with 31P-NMR experimental data from human
erythrocytes. Eur J Biochem 180, 399–420.
28 Melendez-Hevia E, Waddell TG & Montero F (1994)
Optimization of metabolism – the evolution of metabolic pathways toward simplicity through the game of
the pentose-phosphate cycle. J Theor Biol 166, 201–
219.
29 Follstad BD & Stephanopoulos G (1998) Effect of
reversible reactions on isotope label redistribution –
analysis of the pentose phosphate pathway. Eur J Biochem 252, 360–371.
30 Nelson DL & Cox MM (2000) Lehninger Principles of
Biochemistry, 3rd edn. Worth Publishers, New York.
31 Sundstrom M, Lindqvist Y, Schneider G, Hellman U &
Ronne H (1993) Yeast TKL1 gene encodes a transketolase that is required for efficient glycolysis and
biosynthesis of aromatic amino acids. J Biol Chem 268,
24346–24352.
32 Schaaff-Gerstenschlager I, Mannhaupt G, Vetter I,
Zimmermann FK & Feldmann H (1993) TKL2, a second transketolase gene of Saccharomyces cerevisiae.
Cloning, sequence and deletion analysis of the gene. Eur
J Biochem 217, 487–492.
33 Sprenger GA (1995) Genetics of pentose-phosphate
pathway enzymes of Escherichia coli K-12. Arch Microbiol 164, 324–330.
34 Siddiquee KA, Arauzo-Bravo MJ & Shimizu K (2004)
Metabolic flux analysis of pykF gene knockout Escherichia coli based on 13C-labeling experiments together
with measurements of enzyme activities and intracellular
metabolite concentrations. Appl Microbiol Biotechnol 63,
407–417.
35 Fiaux J, Cakar ZP, Sonderegger M, Wuthrich K,
Szyperski T & Sauer U (2003) Metabolic-flux profiling
of the yeasts Saccharomyces cerevisiae and Pichia stipitis. Eukaryot Cell 2, 170–180.
36 Zhao J & Shimizu K (2003) Metabolic flux analysis of
Escherichia coli K12 grown on C-13-labeled acetate and
glucose using GG-MS and powerful flux calculation
method. J Biotechnol 101, 101–117.
37 Sauer U, Lasko DR, Fiaux J, Hochuli M, Glaser R,
Szyperski T, Wuthrich K & Bailey JE (1999) Metabolic
flux ratio analysis of genetic and environmental modulations of Escherichia coli central carbon metabolism.
J Bacteriol 181, 6679–6688.
38 Kanehisa M & Goto S (2000) KEGG: Kyoto encyclopedia of genes and genomes. Nucleic Acids Res 28,
27–30.
FEBS Journal 272 (2005) 4970–4982 ª 2005 FEBS
Tracing
13
C in the pentose phosphate pathway
39 Forster J, Famili I, Fu P, Palsson BO & Nielsen J
(2003) Genome-scale reconstruction of the Saccharomyces cerevisiae metabolic network. Genome Res 13,
244–253.
40 Karp PD, Riley M, Paley SM & Pelligrini Toole A
(1996) EcoCyc: An encyclopedia of Escherichia coli
genes and metabolism. Nucleic Acids Res 24,
32–39.
41 Cherry JM, Adler C, Ball C, Chervitz SA, Dwight SS,
Hester ET, Jia YK, Juvik G, Roe T, Schroeder M et al.
(1998) SGD: Saccharomyces genome database. Nucleic
Acids Res 26, 73–79.
42 Daran-Lapujade P, Jansen MLA, Daran JM, van Gulik
W, de Winde JH & Pronk JT (2004) Role of transcriptional regulation in controlling fluxes in central carbon
metabolism of Saccharomyces cerevisiae – A chemostat
culture study. J Biol Chem 279, 9125–9138.
43 Sprenger GA, Schorken U, Sprenger G & Sahm H
(1995) Transaldolase-B of Escherichia coli K-12 – cloning of its gene, talB, and characterization of the
enzyme from recombinant strains. J Bacteriol 177,
5930–5936.
44 Schaaff I, Hohmann S & Zimmermann FK (1990)
Molecular analysis of the structural gene for yeast transaldolase. Eur J Biochem 188, 597–603.
45 Moss DW (1982) Isoenzymes. Chapman & Hall Ltd,
London.
46 Schaaff-Gerstenschlager I & Zimmermann FK (1993)
Pentose-phosphate pathway in Saccharomyces cerevisiae
– analysis of deletion mutants for transketolase, transaldolase, and glucose-6-phosphate-dehydrogenase. Curr
Genet 24, 373–376.
47 Iida A, Teshiba S & Mizobuchi K (1993) Identification
and characterization of the Tktb gene encoding a 2Nd
transketolase in Escherichia coli K-12. J Bacteriol 175,
5375–5383.
48 Zhao GS & Winkler ME (1994) An Escherichia coli
K-12 tktA tktB mutant deficient in transketolase activity
requires pyridoxine (vitamin B6) as well as the aromatic
amino acids and vitamins for growth. J Bacteriol 176,
6134–6138.
49 Schorken U, Thorell S, Schurmann M, Jia J, Sprenger
GA & Schneider G (2001) Identification of catalytically important residues in the active site of Escherichia coli transaldolase. Eur J Biochem 268, 2408–
2415.
50 Burnham KP & Anderson DR (2002) Model Selection
and Multimodel Inference: a Practical Information-Theoretic Approach, 2nd edn. Springer, New York.
51 Wiechert W, Mollney M, Isermann N, Wurzel M &
de Graaf AA (1999) Bidirectional reaction steps in
metabolic networks. III. Explicit solution and analysis
of isotopomer labeling systems. Biotechnol Bioeng 66,
69–85.
4981
Tracing
13
C in the pentose phosphate pathway
R. J. Kleijn et al.
Appendix I
Relations between the nonoxidative pentose phosphate pathway
(PPP) fluxes of the traditional model and the half-reaction model.
From the traditional and the half-reaction model of the nonoxidative
PPP depicted in Fig. 3, linear dependencies can be derived relating
16 the nonoxidative PPP fluxes of the two models. These nonredundant linear dependencies are given in A110.
n8f ẳ v8f ỵ v9f ỵ v11
A1ị
n8b ẳ v8b ỵ v9b ỵ v11
A2ị
n9f ẳ v9b ỵ v10f ỵ v12
A3ị
n9b ẳ v9f ỵ v10b ỵ v12
A4ị
n10f ẳ v8b ỵ v10b ỵ v13
A5ị
n10b ẳ v8f ỵ v10f ỵ v13
A6ị
n11f ẳ v14b ỵ v15
A7ị
n11b ẳ v14f ỵ v15
A8ị
n12f ẳ v14f ỵ v16
A9ị
n12b ẳ v14b ỵ v16
A10ị
4982
FEBS Journal 272 (2005) 49704982 ê 2005 FEBS