Containment model library of the Apros process simulation software: An overview of development and validation work
Bạn đang xem bản rút gọn của tài liệu. Xem và tải ngay bản đầy đủ của tài liệu tại đây (5.96 MB, 18 trang )
Progress in Nuclear Energy 116 (2019) 28–45
Contents lists available at ScienceDirect
Progress in Nuclear Energy
journal homepage: www.elsevier.com/locate/pnucene
Containment model library of the Apros process simulation software: an
overview of development and validation work
T
Ari Sildea,∗, Jukka Ylijokia, Esa Ahtinenb
a
b
VTT Technical Research Centre of Finland Ltd., VTT, P.O.Box 1000, FI-02044, Finland
Fortum Nuclear Services Ltd., Fortum Power and Heat Oy, Keilalahdentie 2-4, 02150, Espoo, Fortum HQ Campus Keilalahti, Finland
A R T I C LE I N FO
A B S T R A C T
Keywords:
Nuclear safety
Nuclear safety analyses
Containment modelling
Apros
Validation
Containment thermalhydraulics
The Apros CONtainment model library (ACON) is an add-on product of the Apros® (Advanced Process Simulation
Environment) Nuclear software cooperatively developed by VTT and Fortum. ACON is suitable for comprehensive simulation of containment phenomena during nuclear reactor design basis accidents and, to some extent,
severe accidents. The lumped parameter approach applied enables flexible modeling of various containment/
compartment systems. ACON is a suitable tool for both safety analysis use and accurate training simulator
purposes with real time calculation speed. The Apros containment model can be used fully separately, or a
containment simulation can be coupled with other thermal-hydraulic calculation to create a complete simulation
model of a power plant, including e.g. the reactor and turbine systems. Modeling of relevant engineering safety
features is also included.
The paper focuses on the modeling features of ACON and the related validation work which includes the
calculations of nearly 50 experiments performed in various test facilities. The validation methodology is discussed and the validation calculations are summarized as a validation matrix. The paper provides a detailed
presentation of selected validation cases, in which the main studied phenomena are related to general containment thermal-hydraulics, spray effects, blowdown modeling, steam condensation on a structure, steam
stratification in containment, and ice melting with associated natural circulation flow. Finally, an example of
applications is described. Severe accident containment phenomena are out of the scope of this paper.
The results of the validation demonstrate that Apros can be used for analyses of containment thermal-hydraulic behavior including related aspects of engineering safety systems in various containment geometries.
1. Introduction
The main objective of the paper is to highlight the features and
validation process of the nuclear power plant containment modeling of
the Apros® Nuclear (Advanced Process Simulation Environment) software developed in cooperation between VTT and Fortum. Apros is a
commercial simulation software utilized in over 25 countries worldwide (Apros, 2015; Silvennoinen et al., 1989). The Apros platform
provides an environment for configuring and running simulation
models of industrial processes, such as combustion and nuclear power
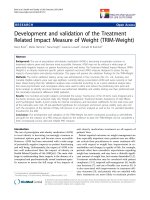
plants. The Apros CONtainment library (ACON) is part of the Apros
Nuclear package (Fig. 1).
The ACON library is developed mainly for analyzing containment
phenomena during nuclear reactor accidents, but the applied lumped
parameter approach also ensures a flexible modeling of various types of
containment/compartment systems outside the nuclear industry. ACON
∗
also includes the modeling capabilities for all relevant engineering
safety features and accident management hardware. One powerful
characteristic of Apros is that the containment calculation can be coupled (integrated) with a complete simulation model of a power plant,
including e.g. the reactor, turbine and automation systems, with their
interactions.
The main period of development of ACON was during the end of the
1990s, but some code modifications and enhancements were also made
later. Basic verification of the ACON models was performed mainly by
the code developers and involved different kinds of testing and code
reviews. The main validation process of ACON started in the early
2000s. Nearly 50 calculation cases concerning various experiments including the separate effect, coupled effect and integral tests have been
calculated so far (Silde, 2015). In addition, the validation and testing
include several code-to-code comparison exercises/benchmarks.
Corresponding author.
E-mail address: ari.silde@vtt.fi (A. Silde).
/>Received 8 November 2018; Received in revised form 26 February 2019; Accepted 17 March 2019
Available online 06 April 2019
0149-1970/ © 2019 The Authors. Published by Elsevier Ltd. This is an open access article under the CC BY-NC-ND license
( />
Progress in Nuclear Energy 116 (2019) 28–45
A. Silde, et al.
Fig. 1. Main features of the Apros simulation environment.
A = flow area [m2]
ρ = density of the mixture [kg/m3]
w = velocity of the mixture [m/s]
p = node pressure [Pa]
h = specific enthalpy of the mixture [J/kg]
t = time [s]
z = coordinate value [m]
Si, Sj, Sk = source term of mass, momentum and energy, respectively.
2. Overview of modeling features
2.1. General
The Apros containment code uses a so-called lumped parameter
approach. The compartments/rooms of the simulated containment can
be divided into an arbitrary number of homogeneous control volumes
(nodes) connected by flow paths (branches) for steam-gas mixture and
liquid water. A containment node consists of three separate phases: gas,
mist droplets and liquid water pool. The mist droplets may be formed
due to volumetric condensation (fog), or from the liquid share due to
the flashing process of blowdown water. Liquid droplets may also be
introduced by a boundary condition sources. The mist droplets are always in a thermalequilibrium with the gas phase, whereas the water
pool may be in a thermal non-equilibrium state in which the pool mass
and enthalpy (temperature) are solved to determine the pool properties.
The right-side terms of Eqs. (1)–(3) describe the sources of mass,
momentum and energy. In the mass equation, the source terms include
the additional mass flows into/from the system. The source term of the
momentum equation contains all pressure losses across the flow paths.
The enthalpy source term consists of all heat flows and the pressure
derivative with respect to time. The pressure derivative term appears in
the enthalpy source term, because the enthalpy is used instead of the
internal energy, i.e.
2.2. Governing equations
∂p
∂u
∂h
=
−v
∂t
∂t
∂t
The LP solution principle of ACON is a simplified form from the
approach used in the one-dimensional homogenous thermal-hydraulic
model of Apros (Hänninen, 1989). One simplification is that ACON does
not consider two-phase flow, i.e. the gas and liquid phases of the system
are solved separately and the interaction between phases takes place
only via heat and mass transfer processes through the interface inside
nodes.
The simulated thermal-hydraulic system is described with the differential equations for conservation of mass, momentum and energy.
Because the gas flow is homogeneous, the equations are applied for the
mixture flow, and therefore only three equations are used
(for mass)
∂Aρw
∂Aρ
= Si
+
∂z
∂t
(for momentum)
(for energy)
A∂p
∂Aρw
= Sj
+
∂z
∂t
∂Aρwh
∂Aρh
= Sk
+
∂z
∂t
(4)
3
where v is the specific volume [m /kg] and u is the specific internal
energy [J/kg].
Mass flow rate in the junctions between the nodes is calculated from
the momentum conservation equations. A uniform temperature in each
node is solved from the energy balances. For pressure solution, also the
mass balances are needed. The pressure, flows, and enthalpies of the
system are solve implicitly. Because all the terms, such as material
properties of water, steam and non-condensable gases cannot be calculated implicitly, the iteration procedure must be used. One simplification of the LP system is that the convection term ∂Aρw 2/ ∂z typical in
the conservation equation of momentum of one-dimensional flow
models is missing in Eq. (2). This simplification means in practice that
the momentum of flows is not transferred across the node.
In the implicit solution algorithm the pressures, flows and enthalpies of the flow system are solved implicitly. The commonly used
staggered mesh discretization scheme is employed. The integration
method applied is the implicit Euler. Because not all terms can be
calculated implicitly, the iteration procedure has been used (Hänninen,
1989).
(1)
(2)
(3)
where
29
Progress in Nuclear Energy 116 (2019) 28–45
A. Silde, et al.
plug inside the pipes.
Table 1
The most important phenomena modeled in ACON.
Modeling phenomenon/system
Steam/non-condensable gas mixture
thermodynamics (water vapor, O2, N2, H2, CO2,
He)
Water droplets (mist)
Intercell flow of gas, liquid sump water, droplets
Buoyancy effect in gas flow
Heat and mass transfer at different interfaces:
gas-structure, gas-ice, gas-sump, gas-droplets
Heat transfer at sump-structure interface
Thermal radiation heat transfer
Heat conduction inside heat structure
Condensate film flow on vertical structure
Ice condenser
Internal and external spray system
Water pool (sump):
homogenous or thermally stratified
Nodes with different shape
BWR suppression pool including vent pipes
Coupling of containment and other
thermalhydraulic calculation
Explicit sources and sinks: water vapor, liquid
water,
non-condensables, dry energy
Pump, valve, heat exchanger
Hydrogen combustion
Hydrogen recombiners
Hydrogen igniters
Fission products and aerosols
General concentration solution for FP's and
boron
2.3.3. Heat and mass transfer
The containment system includes various types of interfaces, where
heat and mass transfer are of importance and should, therefore be
modeled. Heat transfer between containment and other thermal-hydraulic system such reactor cooling system can also be modeled. The
principles of calculation for heat and mass transfer phenomena in
ACON are similar at all gas–surface interfaces such as on a structure,
ice, water pool, or droplets. Total heat transfer rate is the sum of convective heat transfer, latent heat flow caused by condensation/evaporation processes and radiative heat transfer. The calculation is based
on Nusselt's theory using the heat and mass transfer analogy. The
Nusselt number for both natural and forced convection flow is calculated, and as a default the higher of the two values is used in the heat
and mass transfer calculation. However, the user is allowed to override
the default assumption. In the mass transfer modeling, the so-called
mass diffusion theory, in which water vapor diffuses through the
boundary layer and condenses on the surface, is applied. Alternatively,
the Uchida correlation is available.
High vapor condensation rate reduces the thermal and mass layers
in size due to the suction effect of the condensation process (Corradini,
1983). The reduction in the boundary layer increases the heat and mass
transfer coefficients, which are also taken into account in ACON using
so-called Ackermann's approximate correction method (Ryti, 1968). In
the case of a gas–liquid interface, such as on water pool and spray
droplets, a separate interface temperature and its effect on steam partial
pressure is iteratively calculated due to its strong effect on heat and
mass transfer processes. The principal numerical method used in the
iteration of the interface temperature is the Secant method. If the trials
of the Secant iterations are unsuccessful, subsequent trials are conducted using the Regula-Falsi method.
At the gas–structure interface, the effect of condensate water film is
taken into account as a film resistance, or alternatively, its influence is
calculated in more detail using so-called water tracking model, in which
the water film is allowed to flow down from one structure to another.
Heat transfer between a flowing water film and a structure (e.g. wall
condensate, water film caused by external spray cooling) is calculated
using the theory presented by Covelli et al. (1982). The heat transfer
calculation at the “stagnant” liquid–structure interface (e.g. in a sump)
is based on Nusselt correlations for laminar and turbulent natural
convection in fluid (Ryti, 1968b).
Remarks
For water elevation
calculation
Discrete or continuous
AECL or Areva types
Can be simulated with
discrete burning model
Available only in Apros SA
package
FP's available only in Apros
SA
2.3. Modeled phenomena
The license of the basic ACON package includes the models associated with the general containment thermal-hydraulics, hydrogen behavior and related engineering safety features (Silde and Ylijoki, 2017)
(Table 1). Particular severe accident models, such as the behavior of
aerosols and fission products, are available only in the Apros SA
module, which requires a separate license.
2.3.1. Steam/non-condensable gas mixture thermodynamics
ACON calculates the thermodynamics of a gas mixture including
water vapor and six non-condensable gases (oxygen, nitrogen, hydrogen, helium, carbon monoxide and carbon dioxide). Air is represented by a mixture of oxygen and nitrogen. The gas space in each
node is perfectly mixed. Steam is treated as a real gas and the noncondensable gases comply the ideal gas law.
2.3.4. Sump and suppression pool
In the default approach, a water sump or a suppression pool consists
of a single-phase liquid having a uniform temperature. However, a user
can activate the so-called pool stratification model, in which the pool is
divided into two different vertical layers which have their own mass
and energy balances. The heat transfer between the water layers takes
place only through heat conductance. Mass flow between the layers
takes place if the mass inventory or density of the lowest layer changes.
2.3.2. Intercell flows
The flow of gas and liquid water between adjacent nodes is simulated by connecting the nodes with specific flow paths called branches
in the Apros terminology. The gas flow is driven by the pressure difference and the buoyancy effect. The flow loss coefficient may be a
constant value including all possible frictional and form loss terms
across the flow path, or alternatively, the loss coefficient can be internally calculated from a discharge coefficient according to the theory
of isentropic compressible flow. In the latter case, also chocked flow is
checked. Gas flow may also carry fog droplets from one node to another. Flow of liquid water between the adjacent sumps is calculated by
the Bernoulli mechanical energy balance equation.
Valve and pump components can be connected to branches in order
to drive and control both the gas and liquid water flows. The specific
model for suppression pool vent pipes calculates the vent clearing
processes including e.g. the acceleration and movements of a water
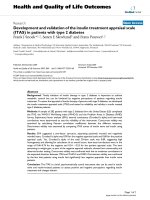
2.3.5. Blowdown and other sources
The ACON calculates the node thermodynamic conditions during
blowdown release with the pressure flash model, which allows the
blowdown fluid to flash into steam based on the total node pressure
(Fig. 2). The mass fraction of flashed steam is
xstm =
hbld − h′
h′′ − h′
(5)
where hbld is the specific enthalpy of fluid which enters the node, and h′′
and h′ are the specific enthalpies of saturated vapor and liquid water in
total pressure, respectively. An input parameter defines that part of the
liquid share, which is transferred directly to droplets (called the droplet
fraction and marked as X in Fig. 2). The rest of the liquid share goes
directly to the sump. Because the droplets are assumed to be in thermal
30
Progress in Nuclear Energy 116 (2019) 28–45
A. Silde, et al.
2.3.8. Node shape
If very exact calculation of water elevation inside a compartment is
required, an approach in which the nodes have a constant cross section
may not always be satisfactory in all geometries. ACON has the capability to define node geometry in three different ways: using a constant
cross section, a varied cross section area as a function of node height
and a varied node volume as a function of node height. With these
options, the water elevation in various containment geometries can be
solved precisely.
3. Validation process
3.1. General
Development of ACON started in the early 1990s when the principle
models and the “heart” of the solution system were coded. During the
2000s, the main work has proceeded by adding the modeling capabilities of engineering safety systems relevant to various containment
types and geometries. At this time, the preliminary validation process
was also initiated. Nearly 50 experiments performed in Finnish and
international test facilities have been calculated so far. In addition,
about 10 code-to-code comparison cases have been carried out. Most of
the validation calculations are performed in the framework of the
Finnish National Research Program, SAFIR, funded by the National
Nuclear Waste Management Fund (VYR) and VTT.
Fig. 2. Principles of modeling blowdown flashing.
equilibrium with the node atmosphere, their influence on node pressure
and temperature is minor. However, if the node atmosphere tends to
become superheated, droplets evaporate and drive the humidity towards the balance. The default value of the droplet fraction in ACON is
0.2, which means that 20% of the liquid share of blowdown is transferred to droplets. The default value is found to be suitable for most
typical blowdown situations. A user may modify the droplet fraction.
This is recommended e.g. in a case when subcooled water flows
“slowly” from systems (which are in equal pressure) to the containment. In this case, a droplet fraction of zero (or close to zero) may yield
the most reasonable results. It is always recommended that a user
should check the result's sensitivity to the droplet fraction if there is a
source of liquid blowdown.
3.2. Methodology
Verification of ACON ensures that the program is coded properly
and that it produces the intended results. The code developers mainly
perform the basic verification and preliminary code testing involving
the test calculations and code reviews. The aim of the validation calculations is to ensure and demonstrate that ACON has an appropriate
capability to simulate the containment thermal-hydraulic phenomena
and related effects of engineering safety systems and accident management hardware during accidents/incidents.
The ACON validation methodology contains two steps (Silde, 2015).
Firstly, the selected experiments conducted in test facilities are calculated in order to validate the code itself. Secondly, the validity of
changes made between the different code versions is checked by calculating always a certain set of experiments/transients with the new
code version, and by comparing the results to those obtained by the
earlier versions. The comparison demonstrates how the new modifications affect the code results and ensures that the changes made between
the versions are valid and do not include any errors or other undesirable
features. The both steps of the validation process include the calculations against the experimental data and the comparison calculations
(benchmarks) against the results of well-validated other codes. The
ideal aim of the validation would be that all validation cases are calculated with all code versions. Unfortunately, this is not possible due to
limited resources and time. Therefore, only the validation cases assumed to be the most representative are calculated in the version validation process. Some of the validation calculations are carried out as
blind-calculations, i.e. without knowing the experimental measurements beforehand, but the most calculations are carried out as openexercises. Both the code developers and pure code users have participated in the validation process in two different organizations, at VTT
and Fortum, in order to ensure that the validation calculations are
performed independently and objectively. One important aim of the
validation process has been to provide essential exercise and experience
to young code users, needed in applying the code to real plant applications.
The choice of suitable values for some critical input parameters may
have a remarkable influence on the simulation results. The input values
used in ACON validation calculations are mostly based on the best-estimate approach. If the best-estimate values are not known, the default
2.3.6. Spray systems
Modeling of both internal and external spray systems is included.
Operation of an internal spray system is simulated with the complete
mixing droplet model. The droplet temperature is assumed to be
otherwise uniform, except that the temperature of an infinitely thin
surface interface is solved iteratively due to its strong influence on heat
and mass transfer. Change of droplet size, temperature, material
properties, vertical and horizontal velocities and their effects on heat
and mass flow are updated during the fall. Five different classes with
different droplet sizes can be included. As default, all spray water is
injected to the atmosphere, but a user-specified part of the spray water
may be injected directly onto structure surfaces. Three different internal spray models with different accuracy levels are available.
The external spray modeling covers a one-dimensional calculation
of energy balance of external water film on the dome outside the
structure, where the temperature, thickness, velocity and heat transfer
coefficient of the water film are determined as a function of angular
position of the semi-hemispherical dome structure (Covelli et al., 1982).
The evaporation of water film is also considered.
2.3.7. Ice condenser
The ice condenser (IC) modeling is based on the Westinghouse-type
system/design. Ice is located in vertical cylindrical columns having a
user-specified diameter and height. Ice is assumed to be at a uniform
temperature, i.e. heat conduction inside the ice is not considered. Both
axial and radial ice melting are modeled. Different types of ice condenser doors are included. The positive pressure difference across the
lower inlet, intermediate and top deck doors of IC pushes them open.
The spring forces, gravity and inertia effect are also taken into account
in calculating the door movements.
31
Progress in Nuclear Energy 116 (2019) 28–45
A. Silde, et al.
Table 2 (continued)
Table 2
Validation matrix of the Apros containment code.
Experiment/benchmark
Experiment/benchmark
PANDA test ST4.1
CONAN experiment
EREC test no. 1
GEKO test series GEKO-E and
GEKO-F
IRSN CARAIDAS spray test
Marviken BWR experiment MXII (no. 18)
MISTRA containment spray
experiments MASP-1 and
MASP-2
MISTRA tests HM 2-1 and HM 32
MISTRA ISP-47
NUPEC experiment M-7-1 (ISP35)
PAR test calculation against the
AREVA data
PAR test calculation against the
AECL data
PPOOLEX test PCC-6
POOLEX tests STB-20 and STB21, PPOOLEX tests STR-9 and
STR-11
PPOOLEX test WLL-5-2
THAI experiment HM-2
THAI experiment TH24
PACOS Px1.2 test
Studied phenomena
Studied phenomena
- Steam condensation rate on a duct wall
- Local heat fluxes to a duct wall
- Forced convection heat and mass
transfer
- Pressure in bubbler condenser
containment
- Air mass concentration in SG box
- Gas temperatures in SG box, BC shaft,
BC air volume and air trap
- Water temperature in the water tray
- MELCOR comparison
- Total heat flow to the condenser
PANDA test T1.1
- Droplet diameter as a function of falling
height (condensation/evaporation on
droplets)
- Drywell and wetwell pressures
- Gas temperature of drywell and wetwell
- Water pool temperature in wetwell
- Air and steam mass flow from
- drywell into wetwell
- Pressure
- Gas temperatures
- Steam concentrations
- Steam condensation
- Gas temperature
- Helium concentrations (stratification)
- Effect of PARs on stratification
- Steam condensation on the walls
- Pressure
- Steam and helium concentration profile
(stratification)
- Gas temperature profile (stratification)
- Pressure
- Gas temperature
- Helium concentration in dome
- Spray effects
- Efficiency of AREVA type recombiners
-
Hydrogen concentration
Gas temperature
Recombination rate of PARs
Condensate flow rate in PCCS
Flow rate through the NCG line
Drywell and wetwell pressure
Water temperature in the PCC pool
Water temperature in wetwell pool
Steam mass fraction in PCCS
PCC pipe temperatures
Pool temperatures (stratification)
-
Steam condensation on a wall
Pressure
Gas temperatures
Wall temperature
Pressure
Gas temperatures
Hydrogen concentrations
(stratification)
Pressure
Gas temperatures
Steam concentrations (stratification)
Dissolution of concentration
Gas velocities
Dome pressure
Gas temperatures
Inner wall temperatures
Flow velocities
Spray effects
-
-
-
PANDA ISP-42
-
PPOOLEX test STR-4
COCOSYS benchmark
-
COCOSYS benchmark
-
COPTA BWR benchmark
-
TOSQAN sump test T201
TOSQAN spray test 101
VICTORIA no. 13
VICTORIA no. 29
VICTORIA no. 42
VICTORIA no. 50
HAMBO, GSIM benchmark
Pressure
Total cooling rate in cooler
Total cooling power of the cooler
Gas temperatures
Steam and helium concentration
profiles in vessel (stratification)
Steam and helium concentrations in the
cooler
Condensate mass in the cooler
Cooling water outlet temperature in the
cooler tubes.
Flow rate in PCCs feed line
Total PCC condensate flow rate in the
drain lines
PCCS drum temperatures
Drywell and wetwell pressures
Drywell and wetwell gas temperatures
Wetwell pool temperature
Steam and helium concentrations in
the drywells and wetwells.
Drywell pressure
Water mass in the wetwell
Helium concentration in the drywell
Pressure difference between the drywell
and wetwell
Liquid mass in the RPV
Gas temperature distribution in the
drywells and wetwells
Wall temperature in drywell 1
Water temperatures (stratification) in
the wetwells
Drywell and wetwell pressure
Drywell and wetwell gas temperature
Suppression pool layer temperatures
Sump evaporation rate
Pressure
Gas temperature
Pool temperature
Pressure
Gas temperature
Droplet size
Droplet falling velocity
Pressure
Gas temperatures
Natural circulation flow
Ice melting
Pressure
Gas temperatures
Natural circulation flow
Pressure
Gas temperatures
Natural circulation flow
(Ice melting)
Pressure
Gas temperatures
Natural circulation flow
Function (movements) of ice condenser
doors
Licensing calculations for Loviisa IC
containment (LLOCA, SLB sequences)
Pressure
Gas temperature
Suppression pool temperature
Pressure
Gas temperature
Suppression pool temperature
(continued on next page)
32
Progress in Nuclear Energy 116 (2019) 28–45
A. Silde, et al.
3.5. Examples of validation cases
Table 2 (continued)
Experiment/benchmark
SARNET 2 Generic Containment
benchmark
Studied phenomena
-
SUPLES benchmark
-
This section presents the results of selected validation cases including calculations for tests performed in the simple one-room test
facilities and in the multi-room geometries representative of BWR Mark
II, PWR large dry and PWR ice condenser containments. The main
studied phenomena of the described cases are related to general containment thermal-hydraulics, spray effects, blowdown modeling, steam
condensation on a structure, steam stratification in containment, and
ice melting with associated natural circulation flow.
Pressure
Gas temperatures
Relative humidity
Hydrogen concentrations
Pool water temperature
Mass and heat transfer rate at pool
surface
Pool surface temperature
Effect of radiation heat transfer
Effect of heat structure nodalisation
Gas flow pattern
Hydrogen recombination rate in PARS
Mass of steam and non-condensable
gases
Mass of fog droplets
Effects of fog droplets on pressurisation
Mass transfer to fog droplets due to bulk
condensation
Wall heat transfer contributions
(convection, radiation, condensation)
Heat transfer coefficient at wall and
pool surfaces
Wall temperature
Pressure
Gas temperature
Blowdown modeling
3.5.1. Single-droplet spray tests at the IRSN CARAIDAS facility
An example of separate effect tests are the single-droplet spray tests
conducted at the IRSN CARAIDAS facility (Malet and Vendel, 2009;
Malet et al., 2011). The tests address the condensation and evaporation
processes on mono-sized spray drops in a simple geometry. Hence, the
tests were focused on studying the droplet characteristics, not general
thermahydraulic behavior. The main aim of the Apros calculation was
to ensure that the mass transfer (condensation/evaporation) modeling
of the spray module is valid.
3.5.1.1. Test arrangements. The height and inner diameter of the
cylindrical facility are 5 m and 0.6 m, respectively. The atmospheric
pressure, temperature and relative humidity, and also initial drop size
have been varied test by test: 1 … 5.4 bar, 20 … 141.6 °C, 3.0 … 87%,
295 … 673 μm, respectively. Mono-sized spray droplets are injected
into the top of the facility. The test series consist of the evaporation and
condensation tests. In the evaporation tests, droplets are injected into
an atmosphere where the humidity is relatively low (20% or less), and
droplets evaporate continuously as they fall. In the condensation tests,
cold droplets are injected into an atmosphere of high humidity. Steam
condenses on drops in the early stage of drop fall, and the drop size
increases, whereas in the later stage during the fall the drops start
evaporating and the droplet size decreases. There are optical
measurements of drop size at three different elevations downwards
from the drop generator, i.e. the net condensation/evaporation mass of
droplets can be estimated. Steady-state thermodynamic conditions and
very good homogeneity along the height of the vessel were reached
during the tests.
values are used as often as possible. If the input deck used yields undesirable calculation results, sensitivity runs are carried out in order to
determine the main reasons for the deviations.
3.3. Validation matrix
The validation matrix of ACON is based on the Containment Code
Validation Matrix (CCVM) presented by the OECD/NEA/CSNI task
group (CSNI, 2014). CCVM describes a basic set of available experiments and related phenomena suitable for code validation. ACON's
validation matrix consists of the containment experiments categorized
as separate effect, integral, or combined effect tests according to CSNI
(2014). Certain separate phenomena are studied in the first type of
tests. In the integral tests, the main aim is to investigate the integral
behavior of the system. In the combined tests, the intention is to study
both separate effects and the integral behavior. In containment tests,
the gap between the “separate effect” and “integral” is not always so
straightforward (CSNI, 2014).
Only those phenomena ranked “major” (the most important) in
CCVM are included in the ACON validation matrix. Table 2 summarizes
the validation matrix of ACON describing the experiment under consideration, the code version used for the validation case and the main
features/phenomena studied. Also selected benchmark calculation
cases, in which the ACON results are compared to those of some other
codes are shown.
3.5.1.2. Calculation model and assumptions. Because the atmosphere in
the tests was well mixed, use of one-node nodalization is justified. A
high vapor condensation rate reduces thermal and mass transfer
boundary layers in size and the heat and mass transfer coefficients
increase due to the suction effect of the condensation process
(Corradini, 1983). By contrast, high evaporation rate decreases the
coefficients. These effects are considered in ACON by using the
Ackermann's approximate method to correct the heat and mass
transfer coefficients (Ryti, 1968). One aim of the calculations was
also to check the validity of the correction method.
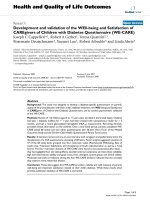
3.5.1.3. Calculation results. Comparison of calculation results to
measured drop size in two evaporation tests, in which the
evaporation rate was relatively low or high, is shown in Fig. 3. The
X-axis of the Figure illustrates the distance from the nozzle. Fig. 3 shows
calculations with and without Ackermann's correction. The results
indicate that when the vaporization rate was low, the droplet size
was slightly overestimated and the evaporation rate was
underestimated, particularly in the lower part of the facility
(Z = 4.39 m) (Silde, 2011). In the high-evaporation cases (such as
EVAP18), Apros predicted the droplet size extremely well at all
elevations of measurements. Furthermore, the disappearing of highly
evaporated drops could be modeled satisfactorily. If the evaporation
rate was high, the best agreement was achieved when using
Ackermann's correction, whereas in the low-evaporation cases the
correction had only a minor influence on the simulation results.
3.4. Documentation
Extensive documentation is an important part of the validation
procedure. The ACON model features, initial condition, relevant input
values used and the results of all validation calculations are documented in the research/project reports of VTT and Fortum. The ACON
user's guide provides the instructions and hints needed in constructing
the input of the simulation model. The code reference manual describes
the phenomenological (physical and chemical) models and related
equations implemented in ACON code (Silde and Ylijoki, 2017). A
successful code validation requires that the choice of physical model
options, default input values and used correlations including their validity ranges, are also justified and documented (Silde, 2004).
33
Progress in Nuclear Energy 116 (2019) 28–45
A. Silde, et al.
Fig. 3. Droplet diameter in the low evaporation test EVAP13 (left) and in the high evaporation test EVAP18 (right).
3.5.2. Liquid blowdown experiment MX-II (no. 18) at Marviken facility
The main aim of the validation task was to simulate overall thermalhydraulic behavior in a large-scale containment geometry during
blowdown in large break LOCA.
In condensation tests, a drop size increase due to condensation occurred within a fall distance of about 0.5 m, after which the drops
started evaporating and the drop size decreased.
Fig. 4 shows the calculation results in two condensation tests with a
low and a high condensation rate. The general trend was that Apros
predicted the drop size very well at a short distance Z = 2.51 m from
the spray generator. In the lower position, the drop size was slightly
overpredicted, because the drop evaporation rate was underpredicted.
However, the simulation results were mostly within the error bar of the
measurements. In the condensation tests, Ackermann's corrections had
no noticeable influence on the simulation results, because the mass
transfer rate was relatively small compared to that of the evaporation
tests. Simulation results of the pure condensation phase could not be
compared extensively to the test data, since only one drop size measurement was made in the part of the vessel where the condensation
occurred.
In order to assess droplet behavior near the injection location with
the best possible accuracy, the use of a small system time step (of the
order of 0.1 s or less) was recommended.
The results also leaded to the recommendation that the Ackermann's
correction should be always used in ACON simulations for spray cases.
The overall conclusions of the calculations of spray tests at the
Caraidas facility and the large dry NUPEC test facility (Ylijoki et al.,
2018; Harti, 2005) were that ACON is able to model the basic physics of
spray droplet heat and mass transfer phenomena reasonably well, and
that the model is suitable for simulation of containment spray systems
in real plant applications.
3.5.2.1. Test arrangements. The Marviken full-scale BWR test facility
includes a reactor pressure vessel, a discharge pipe to the containment,
drywell rooms of the containment building, a wetwell with the
suppression pool and vent pipes leading the gas into the wetwell
water pool (Fig. 5). When the pressure in the drywell increases as a
consequence of the primary coolant discharge, the steam-gas mixture
flows from room 104 via four down flow channels to the vent pipe
header (106) and finally via vent pipes to the wetwell pool. The total
volume of the drywell is 1978 m3, the volume of the wetwell pool is
561 m3 and the volume of the wetwell atmosphere is 1583 m3.
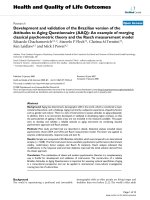
3.5.2.2. Calculation model and assumptions. The Marviken containment
building consists of several partly separated compartments, thus
forming a complex system of air-steam mixture flow paths. Therefore,
the drywell in the simulation model is divided into five separate volume
nodes (Fig. 6): DRY1, DRY2, DRR, DRY111 and DEAD. The area of the
28 open vent pipes is 1.98 m2. The walls and other massive solid
structures of the containment have been modeled with heat structures
(Hänninen, 2003).
Pressure and liquid temperature in the pressure vessel were 46.6 bar
and 237–259 °C, respectively. The diameter of the discharge pipe was
280 mm and the duration of the blowdown was 170 s. Total initial
Fig. 4. Droplet diameter in the low condensation test COND1 (left) and in the high condensation test COND10 (right).
34
Progress in Nuclear Energy 116 (2019) 28–45
A. Silde, et al.
Fig. 6. Simulation nodalization of the Marviken containment (Hänninen,
2003).
how fast the drywell air flowed into the wetwell. On the other hand, the
air flow rate was dependent on the modeling accuracy of the drywell.
Regarding the air flow, it was particularly important how the gas flows
to/from the dead-end room 124 (denoted as DEAD in Fig. 6) were
arranged. The wetwell pressure was slightly overestimated in the
calculation. As long as the discharge was active, the calculated
pressure difference between the drywell and the wetwell was slightly
too low. By increasing the pressure loss coefficient in the vent pipes, the
pressure difference became larger but then the drywell pressure became
too high. The reason for the too low pressure difference may be the
relatively simple modeling of the vent flow into the pool. The complex
3-D phenomena and consequent losses at the vent pipe outlet were not
taken into account in the LP containment modeling. All steam flowing
through the vent pipes is assumed to condense in the pool. The air flow
from the pool into the wetwell gas space has some steam content
(humidity) corresponding to the saturation state at pool temperature.
As in the case of pressures, the temperatures represent those in the
volume DRY1 and in the room 111. The calculated drywell temperature
was after the first 10 s very close to the measured data (Fig. 8). The
calculated wetwell gas temperature increased much faster than the
measured temperatures, but later on remained below the measured
data. The too fast temperature increase in the wetwell at the beginning
indicates the problem of the lumped parameter model. The use of the
averaged quantities in the control volumes causes the too-fast spreading
of the hot air-steam mixtures. By using a denser nodalization, the results could be improved slightly, but the basic problem remains. As a
parametric study, the transient was modeled so that the vent pipe
header was separated from the volume DRY3 to its own control volume.
In this case, the temperature of the header increased somewhat more
slowly than in volume DRY1, but it had no effect on the overall containment behavior. The temperature in the wetwell still behaved as in
Fig. 8.
The calculated pool temperature remained on a clearly higher level
than the measured value throughout the experiment, which implies that
the calculated energy flow through the vent pipes to the pool, particularly in the beginning of the transient, must be higher than in an
actual situation. The reason for the overpredicted flow rates is assumed
to be the too-fast mixing tendency of the containment model numerical
solution. The LP approach used assumes full mixing properties in every
calculation volume. The steam released in the blowdown spreads
throughout the drywell and through vent pipes into the wetwell much
too fast. The spreading of steam can be restricted somewhat with denser
nodalization, but the basic problem of the numerical solution remains.
The conclusion of the validation calculation was that the complexity
of Marviken containment makes the simulation of air and steam flow
rather difficult using the LP approach. Accumulation and purging of air
Fig. 5. Outline of the Marviken containment (Marviken, 1977).
amount of water in the wetwell suppression pool was 550 000 kg, corresponding to a submerged depth of 2.81 m of the vent pipes. The
measured discharge mass flow and the corresponding enthalpy are
given as an input to the containment calculation (Fig. 7).
3.5.2.3. Calculation results. The multi-room geometry of the Marviken
plant made the simulation of the air and steam flows rather complex.
However, the general time histories of the drywell and wetwell
pressures and temperatures were predicted quite well (Fig. 8)
(Hänninen, 2003). During the simulation, it was found that the
pressure increase in the drywell and the wetwell was dependent on
35
Progress in Nuclear Energy 116 (2019) 28–45
A. Silde, et al.
Fig. 7. Measured discharge mass flow (left) and specific enthalpy (right) (Hänninen, 2003).
from the dead-end compartment above the pressure vessel had a great
influence on the pressure behavior of the drywell and wetwell.
However, the Apros-SUPLES benchmark (Hänninen et al., 2003) and
the Marviken validation calculation indicated that the blowdown
modeling of Apros is sound and the code works reliably in the suppression pool applications.
3.5.3. Steam condensation on the wall: PPOOLEX test WLL-5-2
The main objective of the validation task was to check that the
steam condensation and heat transfer to a wall structure is modeled
correctly in ACON. Furthermore, the capability to model the general
thermal-hydraulics in a simplified suppression pool geometry was studied.
3.5.3.1. Test arrangements. The POOLEX test facility is located at
Lappeenranta University of Technology (LUT) in Finland (Fig. 9)
(Laine et al., 2008). The primary component of the test facility is a
cylindrical stainless steel vessel with a free volume of 31 m3. The
cylinder is divided into the drywell and wetwell compartments,
separated by an intermediate deck. The free volume of the drywell is
13 m3. The facility also includes a suppression pool system with a vent
pipe. The steam condensation was measured by collecting condensate
in two gutters, located on different vertical positions of a drywell wall.
In test WLL-5-2, a relatively constant steam injection rate
(470–550 g/s) takes place for 240 s. The injected steam is saturated,
Fig. 9. The PPOOLEX facility (Laine et al., 2008).
having an injection pressure of 6.5 bar and a specific enthalpy around
2680 … 2730 kJ/kg.
The facility was dried out before the test by blowing hot dry air
through the facility. Because the initial humidity in the facility was not
measured, the Apros calculations included some sensitivity studies with
Fig. 8. Drywell and wetwell pressures (left) and gas temperatures (right) in the Marviken blowdown experiment (Hänninen, 2003).
36
Progress in Nuclear Energy 116 (2019) 28–45
A. Silde, et al.
Fig. 10. Condensate mass in the lower gutter on the drywell wall in the PPOOLEX test WLL-5-2 (Luukka and Silde, 2010).
3.5.4. Steam stratification at the THAI facility (test TH24)
The goal of the THAI tests of the series TH24 was to study the
dissolution of steam stratification under the presence of natural convection (Freitag et al., 2016). The tests provided data for both CFD and
LP models in order to develop simulation capabilities in a containment
atmosphere of nuclear reactor containments. The benchmark exercise
was of special interest, because it included both the blind and open
calculations. VTT participated in the blind exercise using the Apros
code (ACON). The main aim of the Apros simulation was to study the
capability of the LP code to model very challenging stratification and
dissolution processes by utilizing the experiences gained from the relevant previous exercises.
varied humidity.
3.5.3.2. Calculation model and assumptions. A simple three-cell
nodalization is used in the simulation: one node for drywell and
wetwell, and one node representing an environment to model heat
losses there (Luukka and Silde, 2010). A suppression pool including one
vent pipe is modeled in the wetwell. Three gas flow paths exist between
the drywell and wetwell: a vent pipe, a vacuum breaker and a leakage
hole in the intermediate deck door. The liner of the wall, ceiling, floor,
and flange, and the lumped mass of pipe connections and valves, etc.,
are modeled as heat structures.
3.5.3.3. Calculation results. From the validation point of view, the most
important measured variable of this test was the amount of condensate
water collected from the lower wall segment of the drywell to the gutter
(Fig. 10). Because the initial humidity was not measured in the test,
three Apros simulations were performed with a varying initial humidity
of the drywell. The facility was dried out before the test, and hence, the
low humidity value was considered to represent the most realistic
value. The results in Fig. 10 show that Apros simulated the condensate
mass rather well. The best agreement was obtained with very low initial
humidity (1%). Generally speaking, the initial humidity appeared to
have only a small influence on the condensate mass.
The initial humidity determines the initial mass of steam and air in
the facility. The mass of air did not change during the test. Therefore, as
the initial humidity is higher, the initial air mass is lower and also the
partial pressure of non-condensable air remains lower. This effect can
clearly be seen in Fig. 11, in which the calculated drywell pressures
with varied initial humidity levels are compared to the measurements.
Best agreement was obtained once again assuming 1% initial humidity.
A general conclusion of this validation task is that Apros heat and
mass transfer modeling on a wall structure works well and gives reliable
results. Similar conclusions were obtained also in the ACON calculation
of steam condensation test ISP-47 at the MISTRA facility (Silde, 2007).
The greatest deviation between the simulation and measurements was
observed in wetwell gas temperature, which increased too fast in the
simulation. The reason for this was probably the same as in the simulation of the Marviken test no. 18 described above: the calculated energy flow through the vent pipe(s) to the pool, particularly at the beginning of the transient, is probably higher than in the experiment.
3.5.4.1. Test arrangements. The THAI test vessel has volume, height and
diameter of 60 m3, 9.2 m and 3.2 m, respectively (Fig. 12) (Freitag
et al., 2016). The steel vessel is thermally insulated and the walls are
equipped with heating/cooling mantles in three vertical sections. The
vessel space also includes an open inner cylinder. A sump compartment
is located at the bottom of the vessel.
The test TH24 is preceded by the preheating phase, in which the
vessel pressure and gas temperature increase to 1.2 bar and around
90 °C, respectively. During the main steam injection phase, which takes
place for 500 s saturated steam (35 g/s) is injected into the upper part of
the vessel where a stratification layer is evolved. Due to steam condensation on the wall and to ensure isobaric conditions beyond the
main steam injection phase, the steam injection continues at a low rate
of 3.8 g/s and the steam stratification layer was later mixed by a
thermal convection induced by heating of the lower and middle heating
mantles on the wall. The upper mantle is simultaneously cooled. The
natural circulation motion is upwards near the wall and downwards
inside the inner cylinder of the vessel (Fig. 12).
3.5.4.2. Calculation model and assumptions. A specific “pseudo-3D”
nodalization concept has been developed for ACON to capture the
main natural circulation flow path with associated stratification
phenomena (Fig. 13). The vessel is modeled by 28 vertical node
levels, each of which is further divided into 5 horizontal nodes. The
lowest and highest parts of the vessel are modeled by own nodes. Due to
the certain simplifications of numerical solution of an LP code, it is
impossible to model a forced convection steam jet directly. However,
37
Progress in Nuclear Energy 116 (2019) 28–45
A. Silde, et al.
Fig. 11. Drywell pressure in the PPOOLEX test WLL-5-2 (Luukka and Silde, 2010).
in Fig. 13) where the jet region is divided radially into two internal
nodes. Steam is injected into the innermost zone. The inner zone is
surrounded by a node representing a “stagnant” ring zone. To prevent
too strong gas entrainment from the nodes below, there are no flow
path connections between the jet zone and the node below it.
the earlier ISP-47 exercise demonstrated that with additional input and
specific nodalization of the jet zone, it is possible to mimic the jet and
plumes and their associated atmosphere entrainment also within an LP
code (Allelein et al., 2007). Learning from this experience, a specific
Apros nodalization for the jet region is built up (indicated as red color
Fig. 12. Configuration and selected instrumentation of the THAI vessel (Freitag et al., 2016).
38
Progress in Nuclear Energy 116 (2019) 28–45
A. Silde, et al.
Fig. 15. Apros blind simulation (APRVTT) and experimental (EXPBT) steam
concentration profile as a function of vessel height at t = 500 s (Freitag et al.,
2016).
nodalization concept is constructed properly.
3.5.5. Ice melting and natural circulation flow in ice condenser containment
(VICTORIA test no. 42)
The main purpose of this validation case was to study the modeling
capability for the natural circulation flow through the ice condenser
sections and ice melting in a Loviisa-type ice condenser containment.
The general containment thermal-hydraulics behavior was also investigated.
Fig. 13. Apros nodalization for TH24.
3.5.4.3. Calculation results. Experimental and blind-simulation results
concerning the steam volume fraction above the steam injection
elevation at two different elevation (H = 7.7 m and H = 8.7 m) are
shown in Fig. 14. As the steam injection started, the steam
concentration above the injection elevation increased rapidly. Apros
could predict qualitatively the stratification process, but the maximum
steam concentration was slightly underestimated. The duration of
steam dissolution at 8.7 m was overpredicted.
At t = 500 s, when the main steam injection was reduced to a
minimum flow rate, the steam stratification was probably at the maximum extension (Freitag et al., 2016). Comparison of the Apros simulation results with the measurement showed that the dimension of the
steam stratification cloud was well captured in the Apros simulation
(Fig. 15).
The general conclusion of the Apros validation calculation was that
the steam stratification, as well as the mixing of steam until t = 700 s
were well predicted. The later mixing of stratification was overpredicted, most probably due to an overprediction of the convective
loop and associated gas mixing. In any case, the blind simulation results
were promising and demonstrated that the challenging stratification
phenomena can also be modeled and captured with the ACON LP code,
if the user experiences from other activities are utilized and if the
3.5.5.1. Test arrangements. The VICTORIA facility is a test facility for
The Loviisa Ice Condenser Containment (ICC) with the linear scaling of
1:15, which gives a volume scaling of 1:3375 (Hongisto et al., 1991;
Hongisto, 1995) (Fig. 16). The facility was constructed at the Hydraulic
Laboratory of IVO. Free volume of the facility is about 25 m3 and it is
equipped with two ice condenser sections and concrete structures
(Hongisto, 1995).
In VICTORIA test no. 42, the facility was preheated to a temperature
of around 50 °C before the actual experiment. The ice condenser doors
are forced open to study the global natural convection flow through the
ice condenser sections. In test no. 42, the ice loading is asymmetric, i.e.
one ice condenser is full of ice and the other one is empty, i.e. there is
initially ice only in one ice condenser section. A constant steam release
of 5 g/s occurs into the lower compartment.
3.5.5.2. Calculation model and assumptions. The Apros 34-cell
nodalization consists of 9 nodes for the lower compartment, 4 nodes
for both ice condenser sections, 2 nodes for the upper compartment,
and 15 other nodes (Fig. 17). Both ice condenser sections are modeled
Fig. 14. Experimental and calculated steam concentration above the steam injection location at 7.7 m (left hand side) and at 8.7 m (right hand side). APRVTT
indicates Apros results from the blind simulation and APRVTT-O from the open simulation. EXPBT is the measured value.
39
Progress in Nuclear Energy 116 (2019) 28–45
A. Silde, et al.
geometry reasonably. Apros also simulates the main natural circulation
flow qualitatively well. The early-phase flow rate was also predicted
accurately, but the later change in flow rate as the ice melts was not
fully captured. This indicates the difficulties in modeling the free flow
area and related friction effects through the ice bed correctly, because
the ice is modeled as a lumped mass, and hence the local 3-D melting
configuration cannot be modeled.
4. Applications
This section provides a brief overview of how ACON has been applied to analysis tasks relating to licensing analyses of a nuclear containment system (Apros, 2016).
Both Loviisa VVER units 1&2 have a Western-type double-layer ice
condenser containment based on the Westinghouse design. Due to the
unique containment design and emergency safety features, Fortum
originally built their own experimental VICTORIA containment facility
to study different thermal-hydraulic and heat and mass transfer phenomena, and also to produce an extensive amount of code validation
data (Hongisto et al., 1991; Hongisto, 1995). The development and
validation of the Apros containment code at Fortum has been performed against selected VICTORIA experiments and also against parallel results obtained by another well-validated German COCOSYS
containment code (COCOSYS, 2018).
The general structure of the Loviisa containment system can be seen
in Fig. 21 and Fig. 22. The Loviisa Ice Condenser Containment (LICC) is
divided into five separate main compartments: Lower Compartment
(LC), two ice condenser sections (XL), upper compartment (UC), deadended compartments (DE) and outer annulus (OA). The total volume of
the containment including the outer annulus is about 80 000 m3. Inside
LICC there is 9300 m3 of reinforced concrete with a surface area of
17 500 m2. For the steel structures the corresponding numbers are
500 m3 and 50 000 m2.
Fig. 22 shows the two cross-sectional containment sectors relative to
the ice condensers. The primary circuit of the reactor together with the
steam generators and the pressurizer is located in the lower compartment (LC). Due to this design feature, any postulated coolant or steam
leak potentially challenging the containment integrity will be released
into the lower compartment. The resulting pressure increase will force
the air and steam to flow through the ice condensers to the upper
compartment (UC). The ice condenser has baskets which contain arrays
of the cylindrical ice tubes. The ice melts and absorbs energy, thus
limiting the containment pressure increase. In major Loss of Coolant
Accidents (LOCAs) and Steam Line Breaks (SLBs), the containment
spray system in the upper containment dome is also activated. For effective coolant recirculation mode, the spray water will return to the
lower compartment via the reactor hall floor and the segment area.
There are specific flow paths including flap check valves embedded in
the wall between the UC segment area and the lower compartment.
Over the years, Fortum has separately built and maintained detailed
safety analysis models and containment models in the Apros simulation
environment for Loviisa NPP. The highly detailed safety analysis
models with primary and secondary side representations are completely
built with six-equation components including the safety classified intermediate cooling circuit and other parts of the decay heat removal
chain to the ultimate heat sink. The reactor core model inside the
pressure vessel can further be selected from three different options (1D/3-D/multi-channel LOCA) depending on the specific analysis case.
During recent years, special focus has been on connecting the highly
detailed primary and secondary loop models to the detailed lumped
parameter containment model. The most important boundaries and
connection points between six-equation thermal-hydraulics and lumped
parameter containment models are the following:
Fig. 16. Schematic of the VICTORIA facility (Hongisto, 1995; Salminen et al.,
2006).
by four nodes. The free flow area in the ice bed is calculated as a
function of ice melting, i.e. as the ice melts, the free flow area increases.
3.5.5.3. Calculation results. A global natural circulation flow upwards
in one ice condenser and downwards in the other one was developed in
the test (Fig. 18). The main flow direction was upwards from the lower
compartment through one ice condenser section to the dome region,
and correspondingly downwards in the other IC section. The calculated
velocity above the IC-section was in good agreement with the
measurements in the early phase of the experiment, but the velocity
in the experiment decreased faster than in the calculation (Fig. 19). The
variation of measured velocities above one ice condenser section was
significant. Two Apros calculations were made by varying the ratio of
axial and radial melting rates. Beyond t = 1 h, the calculated velocity
followed closely the highest measured value.
The pressure increased rapidly in the beginning of the experiment
when steam flowed from the lower into the upper compartment
through the empty IC section (Fig. 20). Later on, pressure increased
only slightly as long as there was ice left in the full IC-section. The early
phase pressure was well predicted with Apros. Later on, the pressure
was slightly overestimated. The gas temperature in the dome was
slightly underestimated during the ice melting process, after which the
agreement was good.
Conclusions of the validation case were that Apros was able to
calculate the dome pressure and gas temperature in the ice condenser
• Break flow modeling from the six-equation model to containment
• ECCS and containment spray suction from the LC floor sump
40
Progress in Nuclear Energy 116 (2019) 28–45
A. Silde, et al.
Fig. 17. Apros nodalization concept for VICTORIA experiment no 42.
• Heat losses from pipe walls to the containment atmosphere
droplet diameter, the higher the energy transfer from the lower compartment atmosphere to the drain droplets and thus, the higher the
sump water temperature. The drain droplet diameter is one of the key
initial parameters for the deterministic safety analysis. The selected
diameter value depends on whether limiting containment atmosphere
conditions or sump water temperature and intermediate cooling circuit
conditions are analyzed.
The design basis of any nuclear power plant is the collection of
postulated initiating events. From the containment design and analysis
point of view the relevant scenarios are typically different leaks or
breaks from the primary or secondary circuit to the containment atmosphere. The goal of the deterministic containment safety analyses is
to show that even in the most severe design basis conditions the
emergency safety features and corresponding safety systems successfully limit the accident consequences to an acceptable level. Critical
acceptance criteria are related to the following physical parameters:
Having the connection between the primary and secondary circuit
models with the containment model gives some obvious advantages
from the safety analysis point of view, such as:
• Realistic containment back pressure calculation during an accident
• Realistic sump water temperature calculation during ECCS and
containment spray recirculation mode
• Easier determination of possible break flow submergence under LC
sump water surface
An illustrative and simplified nodal structure of the Loviisa containment model is presented in Fig. 23. The real nodal model is more
complex and is based on the validation experiments presented in the
previous sections. In certain nodes, the blue color indicates the possible
presence of liquid water surface due to floor sump structure. Another
important feature to note is the ice condenser drain sprays located in
the bottom of the ice condenser floor. The water formed by ice melting
is led through gravity-driven drain valves and splashed, forming small
droplets. These droplets fall through the lower compartment atmosphere and have a significant effect on the lower compartment conditions and sump water temperatures. The smaller the average drain
1.
2.
3.
4.
5.
6.
41
Containment pressure
Containment temperature
Containment inner wall steel liner temperature
Average temperature of the lower compartment
Sump water temperature
Intermediate cooling circuit temperatures
Progress in Nuclear Energy 116 (2019) 28–45
A. Silde, et al.
Fig. 20. Overpressure (left) and gas temperature (right) in the dome.
Fig. 18. Schematic of the natural circulation flow loop inside the VICTORIA
facility (Hongisto, 1995).
Fig. 21. Colored side-cut view of the Loviisa Ice Condenser Containment.
lower compartment. Criteria (5) and (6) are reliability and durability
requirements for the intermediate cooling system and the decay heat
removal chain from the containment to the ultimate heat sink.
For Loviisa NPP, the limiting design basis accidents of the containment are based on following events:
Fig. 19. Gas velocities above the ice condenser section.
• Hot- and cold leg 100% guillotine breaks of primary circuit pipes
(HLLOCA & CLLOCA)
• Smaller breaks of hot- and cold-legs (SBLOCAs)
• Large Steam Line break (SLB)
• Smaller 10% steam Line Break
The criteria (1) through (3) are typical pressure and temperature
limits for the containment integrity. The limiting accidents challenging
these parameters and acceptance criteria are usually the largest primary
or secondary pipe breaks. For the other criteria (4) through (6), the
limiting initiating events are less obvious. Criterion (4) is related to
reliability and durability requirements regarding safety graded electricity and automation components inside the containment and the
The event-specific analysis goals and initial assumptions are summarized in Table 3.
The goal of this section was to provide an overall introduction to the
42
Progress in Nuclear Energy 116 (2019) 28–45
A. Silde, et al.
Fig. 22. Side view of the containment sectors relative to ice condensers.
Fig. 23. Illustrative nodal structure of the Loviisa 1&2 Apros containment model.
43
Progress in Nuclear Energy 116 (2019) 28–45
A. Silde, et al.
Table 3
Main limiting design Basis conditions.
Case
Limiting parameters
CLLOCA HLLOCA
Containment pressure Containment temperature
SBLOCAs
Sump water temperature
Intermediate cooling circuit temperatures
SLB 100%
Containment pressure
Containment temperature
Lower compartment temperature
Lower compartment temperature
SLB 10%
Initial assumptions
- Minimum ECCS capacity to maximize steam content of the leak
- IC drain droplet size is maximized to minimize energy loss to droplets
- ECCS capacity is to maximized to maximize the flow through core and also cause early break
submergence
- IC drain droplet size is minimized to maximize heat transfer to sump
- Break size is largest possible without actuating the containment spray
- RCP corresponding the damaged loop will run until SG empty (off-site power is not lost)
- IC drain droplet size is maximized
- RCP corresponding the damaged loop will run until SG empty (off-site power is not lost)
- IC drain droplet size is maximized
Fig. 24. Some illustrative Apros results from five different loss of primary coolant test simulations.
package and was developed for modeling of containment/compartment
phenomena during accidents. The main features of ACON and the
current validation process were summarized. Severe accident phenomena were not considered in this paper.
The Apros validation calculations cover nearly 50 experiments and
several code benchmark exercises in various single and multi-room
geometries representative of BWR Mark II, PWR large dry and PWR ice
condenser containments. The validation work indicates that ACON is
capable of calculating containment thermal-hydraulic behavior including related aspects of engineering safety systems reliably and ACON
can be used for safety analyses of NPP containments/compartments.
It is recommended that the future validation work of ACON should
be focused more on the separate effects than on the integral tests. Some
of the validation calculations performed with earlier code versions
should be repeated using the latest version. Most of the current validation calculations are performed as open exercises. Additional blind
calculations, without any knowledge about previous experimental results, would be useful in assessing the predictive capability of the code.
ACON has been applied in various analysis tasks within the nuclear
industry, but also in non-nuclear design tasks.
most important Loviisa-related design basis events, taking into account
article length limitations. However, especially after the Fukushima accident, different Design Extension Conditions including common cause
failures and complex failure combinations and their mitigation with the
passive safety features have had an increasingly important role in the
updated list of initiating events. In addition to maintaining Loviisa
FSAR analyses, Fortum has many customer projects with extensive PWR
and BWR plant containment modeling tasks with, e.g. passive safety
systems (Apros, 2016).
Some illustrative results from five different loss of primary coolant
test simulations can be seen in Fig. 24. A large 2 × 100% cold-leg break
accident DBALOCA will lead to strong non-condensable gas and steam
flow through ice condensers into the upper compartment and the
containment spray system will be actuated at an early stage during an
accident. This is the design basis initiating event from the containment
pressure capacity point of view. The smaller breaks do not increase the
upper compartment pressure level sufficiently to activate the containment spray system, and so the spray injection initiation is delayed until
the ECCS tank is almost empty and the sump recirculation phase is
initiated. When the containment spray is not in operation, the ECCS
tank water volume is injected into the primary circuit solely by the
high- and low-safety injection pumps. The majority of the injected
water flows through the reactor core, leading to higher sump water
temperatures and a higher heat transfer rate to the intermediate cooling
circuit during the recirculation phase. The higher intermediate cooling
circuit temperature pulses can be seen on the right-hand side of Fig. 24.
The short-term upper compartment pressure and temperature behavior
is clearly limited by maximum break sizes. In the long-term analyses,
the smaller breaks have a limiting role, especially when maximizing the
intermediate cooling circuit temperatures.
Acknowledgements
Most of the validation work was carried out within the Finnish
National Research Program SAFIR. The work was funded by the Finnish
National Nuclear Waste Management Fund (VYR) and VTT.
Appendix A. Supplementary data
Supplementary data to this article can be found online at https://
doi.org/10.1016/j.pnucene.2019.03.031.
5. Summary/conclusions
The Apros Containment Code (ACON) is a part of the Apros Nuclear
44
Progress in Nuclear Energy 116 (2019) 28–45
A. Silde, et al.
References
Stratification and Lappeenranta University of Technology, Stratification and Mixing.
Lappeenranta University of Technology. CONDEX 1/2008.
Luukka, J., Silde, A., 2010. Validation of Apros Containment Model against PPOOLEX
Experiments STR-1, STR-4 and WLL-5-2, Revision 1.0. Research Report No. VTT-R00763-10, Rev 1.0. VTT Technical Research Centre of Finland ltd 15.5.2010.
Malet, J., Vendel, J., 2009. SARNET-2: Droplet Heat and Mass Transfer Studies.
Specification Report SERAC/10.2.1.1.5. IRSN.
Malet, J., et al., 2011. Spray model validation on single droplet heat and mass transfers
for containment applications – SARNET-2 benchmark. In: The 14th International
Topical Meeting on Nuclear Reactor Thermalhydraulics, NURETH-14, Toronto,
Ontario, September 25-30, 2011.
Marviken, 1977. The Marviken Full Scale Containment Experiments Second Series,
Description of the Test Facility. Joint Reactor Safety Experiments in the Marviken
Power Station Sweden March 1977.
Ryti, H., 1968. Lämmön ja aineen siirtyminen. Tekniikan käsikirja 1, 357–424.
Ryti, H., 1968b. Stationäärinen Lämmön siirtyminen. Tekniikan käsikirja, vol. 5, 1–67.
Salminen, K., Harti, M., Hongisto, O., 2006. Summary of the Validation of the Apros
Containment Model. Loviisa 1 Ja 2 Käyttölupaprojekti (KLUPA). Fortum Nuclear
Services KLUPA-4015. Confidential. 29.3.2006.
Silde, A., 2004. Correlations and Default Input Values of the Containment Model of Apros
5.04. Research Report PRO1/7056/03. VTT Technical Research Centre of Finland
Ltd. Confidential.
Silde, A., 2007. Simulation of Steam Condensation Experiment (ISP-47) on Mistra Facility
with the Containment Model of Apros 5.07. Research Report No. VTT-R-00974-07.
VTT Technical Research Centre of Finland 26.1.2007.
Silde, A., 2011. Validation of Containment Spray Modelling of Apros on Single Droplet
Heat and Mass Transfer Tests. Research Report VTT-R-08953-11. VTT Technical
Research Centre of Finland Ltd. Confidential.
Silde, A., 2015. Assessment of Apros Containment Software. Research Report VTT-R04560-15. VTT Technical Research Centre of Finland Ltd.
Silde, A., Ylijoki, J., 2017. Nuclear Power Plant Containment Models of Apros 5.13:
Description of the Code Models. Research Report VTT-R-07520-07. VTT Technical
Research Centre of Finland Ltd. Confidential.
Silvennoinen, E., Jusin, K., Hänninen, M., Tiihonen, O., Kurki, J., Porkholm, K., 1989. The
Apros Software for Process Simulation Asnd Model Development. VTT Research
Reports, vol. 618. VTT Technical Research Centre of Finland Ltd, pp. 106+ 19.
Ylijoki, J., Norrman, S., Silde, A., Leskinen, J., 2018. Validation of Apros Version 6.08.04.
Research Report VTT-R-03807-18. VTT Technical Research Centre of Finland Ltd.
Allelein, H.J., et al., 2007. International Standard Problem ISP-47 on Containment
Thermalhydraulics, Final Report. NEA/CSNI/R(2007)10. Nuclear Energy Agency,
Committee on the Safety of Nuclear Installations 11 September, 2007.
Apros, 2015. os.fi/en/.
Apros, 2016. os.fi/en/references/nuclear_references.
COCOSYS, 2018. />Covelli, B., Varadi, G., Nielsen, L., Lewis, M., 1982. Simulation of containment cooling
with outside spray after a core meltdown. Nucl. Eng. Des. 69 (1982), 127–137 Nov.
1981.
Corradini, M.L., 1983. Turbulent condensation on a cold wall in the presence of a noncondensable gas. Nucl. Technol. 64, 186–195 September 1983.
CSNI, 2014. Containment Code Validation Matrix. NEA/CSNI/R(2014), vol. 3. Nuclear
Energy Agency, Committee on the Safety of Nuclear Installations, pp. 614 May 23,
2014.
Freitag, M., Schmidt, E., Gupta, S., Poss, G., 2016. Simulation benchmark based on Thaiexperiment on dissolution of a steam stratification by natural convection. Nucl. Eng.
Des. 299 (2016), 37–45.
Harti, M., 2005. Validation of the Apros 5.06 Containment Internal Spray System Models
against International Standard Problem No. 35. Fortum Report No. THERMO-497.
Fortum Nuclear Services ld.
Hongisto, O., Tuomisto, H., Lundströn, P., 1991. Hydrogen distribution experiments for
Loviisa ice condenser containments. In: Proceedings Workshop on Hydrogen
Behaviour and Mitigation in Water-Cooled Nuclear Power Reactors. March 4-8, 1991.
Brussels, Belgium.
Hongisto, O., 1995. The Results of Test Phase 3 of the VICTORIA Experiment Part A:
Natural Circulation Experiment. Imatran Voima Oy Research Report DLV1-G380-387.
30.6.1995. Confidential.
Hänninen, M., 1989. A Solution of One-Dimensional Flow and Heat Transfer Processes
with Difference Method. Thesis for the Degree of Licenciate of Technology.
Lappeenranta university of technology.
Hänninen, M., Silde, A., Eerikäinen, L., 2003. Basic Validation of Containment and SixEquation Models. Research Report PRO4/7831/03. VTT Technical Research Centre of
Finland Ltd December 2003. Confidential.
Hänninen, M., 2003. Validation of Apros Containment Model against Marviken Test 18.
Research Report No. PRO5/7828/03. VTT Technical Research Centre of Finland Ltd
December 2003. Confidential.
Laine, J., Puustinen, M., Räsänen, A., 2008. PPOOLEX Experiments on Thermal
45