Application of microstructured membranes for increasing retention, selectivity and resolution in asymmetrical flow field-flow fractionation
Bạn đang xem bản rút gọn của tài liệu. Xem và tải ngay bản đầy đủ của tài liệu tại đây (1.61 MB, 10 trang )
Journal of Chromatography A, 1605 (2019) 360347
Contents lists available at ScienceDirect
Journal of Chromatography A
journal homepage: www.elsevier.com/locate/chroma
Application of microstructured membranes for increasing retention,
selectivity and resolution in asymmetrical flow field-flow
fractionation
Maria Marioli a,∗ , Ü. Bade Kavurt b , Dimitrios Stamatialis b , Wim Th. Kok a
a
Analytical Chemistry Group, van’t Hoff Institute for Molecular Sciences, University of Amsterdam, P.O. Box 94157, 1090 GD Amsterdam, the Netherlands
(Bio)artificial Organs, Department of Biomaterials Science and Technology, TechMed Institute, University of Twente, P.O. Box 217, 7500 AE Enschede, the
Netherlands
b
a r t i c l e
i n f o
Article history:
Received 10 April 2019
Received in revised form 25 June 2019
Accepted 2 July 2019
Available online 3 July 2019
Keywords:
Field-flow fractionation
Flow over grooves
AF4
Computational fluid dynamics
Microstructured membranes
Protein separation
a b s t r a c t
In the present proof-of-concept study, we demonstrate that retention time, selectivity and resolution
can be increased in asymmetrical flow field-flow fractionation (AF4) by introducing microstructured
ultrafiltration membranes. Evenly spaced micron-sized grooves, that are placed perpendicular to the
channel flow on the accumulation wall of a field-flow fractionation system, cause a decrease in the
zone velocity which is stronger for larger solutes. This has been demonstrated in thermal field-flow
fractionation, and we prove that this is also the case in AF4. We examine the hypothesis theoretically
and experimentally, by both computational and physical experiments. By means of moment analysis, we
derive theoretically a set of equations which, under certain conditions, describe the mass transport and
relate retention time, selectivity and plate height to the dimensions of the grooves. Physical experiments
are carried out using microstructured polyethersulfone membranes fabricated by hot embossing, and the
experimental results are compared with computational fluid dynamics experiments.
© 2019 The Author(s). Published by Elsevier B.V. This is an open access article under the CC BY license
( />
1. Introduction
Asymmetrical flow field-flow fractionation (AF4), the most
applied subtechnique of the field-flow fractionation (FFF) family,
is an established analytical method to separate macromolecules
and nanoparticles according to their hydrodynamic size under mild
conditions [1–3]. The coupling with various physical and chemical
detectors has contributed significantly to its popularity as it can
provide valuable information such as molecular weight distribution, size distribution, conformation and chemical composition in
a single run [4]. Considering the rapid growth in biotechnology,
nanotechnology and polymer engineering, it is evident that AF4 is
going to witness a further growth in applications in the coming
years. In this regard, it is worthwhile to propose and investigate
possible new technical developments that may improve performance.
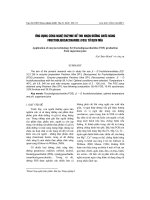
In this study we investigate the possibility of increasing retention time, selectivity and resolution by using microstructured
ultrafiltration (UF) membranes with parallel grooves on their sur-
∗ Corresponding author.
E-mail address: (M. Marioli).
face (Fig. 1). However, considering that AF4 is a very flexible
technique where several parameters can be altered to optimize
separation, first a justification should be given for the usefulness
of such a development.
According to the rigorous FFF theory, the retention time of wellretained (with retention ratio < 0.1) components in AF4 is equal
to [5],
tR =
w2
ln
6D
1+
V˙ c
B
V˙ out
(1)
where w is the channel thickness, V˙ c the cross-flow rate, V˙ out the
channel outlet flow rate and B the fraction of the accumulation
area after the focusing point. Therefore, the selectivity of a pair of
well-retained solutes equals the ratio of their diffusion coefficients,
˛=
tR,2
D1
=
tR,1
D2
(2)
and consequently, it cannot be altered by changing the experimental parameters. Resolution can be improved by reducing the plate
/>0021-9673/© 2019 The Author(s). Published by Elsevier B.V. This is an open access article under the CC BY license ( />
2
M. Marioli et al. / J. Chromatogr. A 1605 (2019) 360347
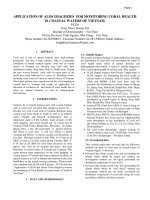
Fig. 2. Left-hand figure: display of the theoretical model. Right-hand figure: velocity
profile (a) over a flat membrane and (b) over a grooved membrane where the velocity
zero-plane is taken on the edge of the ridge (x = h).
Fig. 1. AF4 with microstructured membranes.
height which, based on the nonequilibrium theory (for
equal to [6],
H=
24D2 v0
u3cr w
2. Theory
< 0.1), is
(3)
where ucr is the cross-flow velocity thought the membrane and
v0 is the cross-sectional mean carrier velocity. Hence, a high
cross-flow velocity decreases plate height. However, it may lead
to adsorption on the membrane and mass overloading for sensitive macromolecules. In addition, high flow rates are hindered
by the transmembrane pressure when ultrafiltration (UF) membranes with very low molecular weight cut-off (MWCO) are used
to separate small macromolecules.
The solutes can be resolved at lower cross-flow rates by increasing the retention time, since a minimum time is required to achieve
separation [7], which could be accomplished by increasing the
cross-flow to outlet flow ratio or the spacer thickness [8]. Very
high cross-flow to outlet flow ratios are impractical, particularly
for UF membranes with low MWCO, and may distort the parabolic
flow profile [9]. In addition, the use of a thicker spacer results in
higher required focusing times and more dilution with a subsequent decrease in sensitivity [7]. Moreover, a low aspect ratio b/w
(<30), where b is the channel breadth, may aggravate edge and
end effects increasing plate height and reducing recovery [10,11].
Therefore, it could be beneficial to investigate a method that could
increase retention and resolution without altering the optimal
cross-flow, spacer thickness and cross-flow to outlet flow ratio.
The concept of an accumulation wall with micron-sized grooves
in FFF has been introduced in 1978 by Giddings et al. [12] as an
attempt to increase retention for small analytes in thermal fieldflow fractionation (ThFFF). In addition, grooved surfaces have been
incorporated in microfluidic channels for various other applications
such as to enable mixing [13] and to separate cells and microparticles [14]. Navier has described that macroscopically the rough
surface is equivalent to a smooth surface with partial slip [15–17].
In fact, for this reason, a small slip might exist on the flat membrane
of the AF4 channel, as a result to the porosity, but it is negligible for UF membranes [18]. Nanostructured UF membranes have
been fabricated by nano-imprinting lithography [19–21], where
membranes were hot-embossed, and microstructured polymeric
materials have been developed with phase separation [22–24],
where a polymer solution is cast over a patterned mold.
The scope of this study is to conduct a proof-of concept investigation to assess the effect of microstructured membranes on the
retention time, selectivity and resolution in AF4. A hot embossing
method was chosen for the fabrication of these membranes. We
share fundamental theory and experimental findings that complement and expand the previous study with perpendicular grooves
in ThFFF [12].
2.1. Transport equations and moment analysis
Here, we describe a simplified model that enables us to derive an
analytical solution to the problem of mass migration over grooves
in an AF4 channel. In this model the grooves are formed by zerowidth ridges with a uniform height h on the membrane surface,
perpendicular to the flow direction. Slip flow through the grooves
is neglected; the zero-velocity plane for the axial flow (v) is taken
at the top of the ridges (Fig. 2).
The following simplifications have been made:
(1) Molecular diffusion in the axial (z -) direction is neglected.
(2) The development of the concentration profile in the perpendicular (x -) direction is complete before elution is started, by a
preceding focusing step in the procedure.
(3) Only well-retained compounds are considered (with retention
ratio < 0.1). Such compounds are present predominantly
close to the accumulation wall, where the linear part of the flow
profile prevails and the cross-flow velocity ucr may be considered as being equal to the fluid velocity through the membrane.
For well-retained compounds, the mathematics can be simplified since integrals over the height of the channel can be
taken from x = 0 to infinity instead of to the upper wall position
(x = w), with good accuracy.
(4) There are no interactions between the protein and the membrane.
(5) Flow conditions are laminar. This assumption should hold true
since the presence of perpendicular grooves, which are small
compared to the channel thickness, reduces locally the flow
velocity and decreases the Reynolds number [16]. Although
eddies may exist in the corners of the grooves, the flow velocity
is very low there and the fluid is almost stagnant.
The transport of a compound i, with a local concentration ci =
ci (x, z, t), is given by the simplified general transport equation
2
∂ci
∂ ci
∂c
∂c
+ ucr i − v(x) i
= Di
∂t
∂x2
∂x
∂z
(4)
where Di is the diffusion coefficient of the compound of interest,
and v(x) the local axial flow velocity. The molecular diffusion term
along the z- direction is neglected in the RHS of Eq. (4). The plus
sign for the second term of the RHS appears because a positive
value is taken for ucr , even when the cross flow is in the negative
x - direction. The assumption that the analyte has been introduced
in the channel as a finite plug leads to the boundary conditions
ci (x, t) → 0 for
z → ±∞
(4a)
M. Marioli et al. / J. Chromatogr. A 1605 (2019) 360347
and the assumption that the walls of the channel are impermeable
for the compound to
∂c
Di i + ucr ci = 0 for x = 0, w
∂x
(4b)
Two sets of moments are defined. Local moments, that describe
the mass distribution of a compound i in a fluid layer at a certain
distance x from the membrane, are defined as
n
mn,i (x, t) =
−∞
z ci (x, z, t) dz
v(x) = 0
mn,i (x, t) dx ≈
0
0≤x≤h
for
6(x − h)
v
w
for
(12a)
x≥h
(12b)
When Eqs. (10)–(12) are substituted into Eq. (8),
∞
w
mn,i (x, t) dx
(6)
0
Moments exist when the integrals converge in Eq. (6), i.e., when it
can be assumed that the concentration of a compound i approaches
zero fast enough when z goes to plus or minus infinity. This will be
the case when the compound was introduced in the channel as a
plug or peak of finite width.
When both sides of the general transport Eq. (4) are multiplied
with z n and integrated over z from minus to plus infinity, expressions are obtained for the local moments of i
2
∂mn,i
∂ mn,i
∂mn,i
= Di
+ ucr
+ nv(x)mn−1,i
∂t
∂x2
∂x
(7)
The third term of the RHS in this equation is obtained by partial integration with the assumption that z n ci (x, z, t) vanishes for z → ±∞.
When a local moment (n − 1) is known, this equation can be used to
evaluate the next local moment (n). Integration of Eq. (7) over the
height of the channel, considering boundary condition (4b), gives
an expression for the overall moment Mn,i
∂Mn,i
=n
∂t
The model for the grooved surface used here (Fig. 2), with a
stagnant layer of fluid determined by the groove height h, and
approximately linearly increasing channel flow rate from the slip
plane at the top of the ridges, gives for the local axial flow velocity
(5)
and overall moments, that describe the mass distribution in the
axial direction integrated over the height of the channel, as
Mn,i (t) =
2.3. The first moment (mean retention time)
v(x) =
+∞
3
∂M1,i
=
∂t
v(x)mn−1,i dx
(8)
h
u
u
6(x − h)
v cr exp − cr x dx
w
Di
Di
(13)
the axial velocity vi of the compound is obtained (with for simplicity
integration to infinity instead of to x = w),
vi =
∂M1,i
u h
6Di
v exp − cr
=
u
Di
w
∂t
cr
(14)
Eq. (14) with h = 0 gives the well-known expression for the zone
velocity over a flat membrane. With a grooved membrane, the
velocity decreases exponentially with the ratio of the ridge height
over the characteristic layer thickness. For the retention time the
opposite can be written
FL
tR,i = tR,i
exp +
ucr h
Di
(15)
FL is the retention time with a flat membrane, under othwhere tR,i
erwise the same conditions. The retention time increases more
strongly by the presence of the grooves for compounds with a small
layer thickness, i.e., for more strongly retained compounds.
In the separation of two components, the selectivity ˛ is
increased with increasing ridge height and it can be written as
˛=
w
w
tR,2
D1
=
exp ucr h
tR,1
D2
1
1
−
D2
D1
= ˛FL exp
h
1
˛FL − 1
(16)
0
˛FL
2.2. The zeroth moment (mass distribution)
Integrating both sides of Eq. (4) over z from minus to plus infinity
gives an expression for the local zeroth moment of i,
where
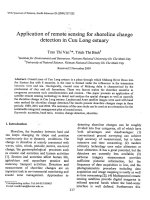
is the selectivity with a flat membrane, and 1 the characteristic layer thickness of the first, least retained compound. In
Fig. 3a, the calculated effect of the (relative) height of the grooves on
the retention times and the selectivity is shown for two compounds
√
with diffusion coefficients that differ by a factor of 2.
2
∂m0,i
∂ m0,i
∂m0,i
+ ucr
= Di
∂t
∂x2
∂x
(9)
Under the assumption that focusing was complete, and a steady
state was reached before the experiment was started, both sides of
Eq. (9) must be zero, and the mass distribution over the height of
the channel can be found as
m0,i = m∗0,i · exp −
ucr
x
Di
(10)
where m∗0,i is the zeroth moment on the membrane surface (with
x = 0). The exp. concentration profile extends out from the upper
wall (x = w) here. Eq. (10) describes the well-known exponential concentration profile on the accumulation wall in FFF, with a
characteristic layer thickness
equal to Di /ucr . When the concentration of the analyte is scaled so as
m*0,i =
ucr
Di
(11)
the overall zeroth moment M0,i becomes 1, and the higher overall
moments are automatically normalized.
2.4. The second moment (peak variance)
To evaluate the influence of the grooved surface on peak broadening, first an expression for the development of the local first
moments has to be derived. In this, we follow the approach taken
by Taylor and Aris in their treatment of peak broadening in cylindrical channels, and in early work of Giddings on dispersion in FFF
[25]. They found solutions for the general transport Eq. (4) in the
form of a sum of transient functions and a stationary function. The
transient functions describe the concentration changes in time and
space directly after the start of the ’elution’ and they depend on the
initial conditions. It was shown that these transient functions die
out rapidly, and that a stationary situation develops in which the
local centers of gravity at different distances from the wall are situated in a steady profile around the overall (mean) center of gravity
of the transported plug of the compound of interest. Here, a solution is sought for Eq. (4) describing only the stationary situation,
i.e., a solution that obliges
∂m1,i (x) ∂M1,i
1
=
= vi
m0,i (x)
∂t
∂t
for all
x
(17)
4
M. Marioli et al. / J. Chromatogr. A 1605 (2019) 360347
Since the fluid velocity is zero for 0 < x < h, Eq. (18a) does not have
to be included in the integration. Centralizing of the overall second
moment gives the increase of the spatial variance in time
∂M2,i
∂M1,i
∂ z2
=
− 2M1,i (t)
∂t
∂t
∂t
(20)
and finally, the plate height H can be obtained as
H=
∂ z2 /∂t
∂M1,i /∂t
(21)
The final result for H is
H=
24Di2 v0
u3cr w
ucr
3
ucr
5
h − −
h
exp +
2
Di
2
2Di
exp −
ucr
h
Di
(22)
For a flat membrane, with h = 0, the second and third factors in the
RHS of Eq. (22) are equal to 1, and the well-known expression for
H (H FL ) is obtained (Eq. (3)).
In Fig. 3b the increase of the plate height with the relative ridge
height is shown, and in Fig. 3c the increase in resolution of two
√
solutes with ratio of diffusion coefficients 2 is shown. We observe
that for groove height h = 1.5 1 , there is a two-fold increase in resolution and a four-fold increase in the retention time of the less
retained component. For comparison, the same increase in resolution could be achieved (without altering the cross flow) by a
two-fold increase of the spacer thickness or approximately ten-fold
increase of the cross-flow to outlet flow ratio.
3. Materials and methods
3.1. Samples and carrier eluent
Bovine serum albumin (BSA), ␥-globulin, apoferritin, thyroglobulin and hemoglobin were purchased by Sigma–Aldrich (MO, USA).
PBS 0.15 M (20 mM due to sodium phosphate salts) with a pH of
7.2 was used as a carrier eluent for the AF4 experiments and as
a diluent for the proteins. All protein samples were prepared at a
concentration of 1 mg/mL.
Fig. 3. Theoretical estimation of variables as a function of the relative ridge height: a)
increase in selectivity and retention time for two solutes with diffusion coefficients
√
that differ by a factor of 2 (e.g., monomer and dimer); retention times here are
FL
b)
normalized with the retention time of the smaller solute for a flat membrane tR,1
increase in plate height c) increase in resolution.
A set of particulate solutions for m1,i (x) can be found that satisfy all
boundary conditions.
For 0 ≤ x < h,
mA1,i (x, t) =
6v
w
t−
Di
u2cr
−
x
ucr
exp −
ucr h
Di
exp −
ucr x
Di
(18a)
and for x ≥ h,
2
mB1,i (x, t) =
exp −
6 v (x − h)
x−h
+
{
+
w
2Di
u
ucr h
ucr x
}exp −
Di
Di
t−
Di
u2cr
−
x
ucr
(18b)
The increase in time of the overall second moment can now be
found by substituting Eqs. (12b) and (18b) into Eq. (8)
∂M2,i
=2
∂t
w
h
6 v0
(x − h) mB1,i dx
w
(19)
3.2. Fabrication and characterization of the microstructured (MS)
membranes
Two silicon mold designs with parallel grooves were used for
preparation of the microstructured membranes. Mold I (LioniX BV,
The Netherlands) had a patterned area of diameter 15.1 cm with
grooves of cavity width c = 50 m, ridge width r = 50 m, ridge
height h = 12 m whereas Mold II (MESA + cleanroom, University of
Twente, The Netherlands) had a patterned area of diameter 6.8 cm
with grooves of c = 30 m, r = 20 m and h = 25 m. Polyethersulfone (PES) membranes with 10 kDa and 30 kDa molecular weight
cut-off (MWCO) (Sartorius, Germany) were used for the membrane
patterning without any pretreatment.
Microstructured (MS) membranes were prepared via hot
embossing which was performed with an imprinter (Obducat,
Sweden) in MESA + cleanroom (University of Twente). The embossing temperature, pressure and time were 120 ◦ C, 40 bar and 180 s,
respectively and demolding occurred at 40 ◦ C [20]. Surface and
cross-section images of the microstructured membranes were
taken by scanning electron microscopy (SEM) equipment, XL30
ESEM-FEG (Philips, The Netherlands) or JEOL JSM-6010 LA (JEOL,
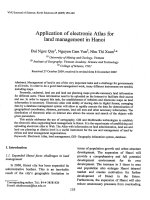
Japan). MS membrane I (Fig. 4a) was fabricated by hot-embossing
a PES 10 kDa membrane with the Mold I, and MS membrane
II (Fig. 4b) by hot embossing a PES 30 kDa membrane with the
Mold II. Membrane samples were washed, dried, broken in liquid nitrogen for cross section images and gold-sputtered for SEM
imaging.
M. Marioli et al. / J. Chromatogr. A 1605 (2019) 360347
5
Fig. 4. Microstructured membranes and AF4 channels: a) MS membrane I (hot embossed with Mold I) and Channel I b) MS membrane II (hot embossed with Mold II) and
Channel II.
Clean water flux (Jw ) values of the membranes were measured
with dead-end Amicon Stirred Cell (Model 8050, Merck Millipore,
MA, USA) and ultrapure water (MilliQ system, Merck Millipore).
Measurements were performed at four different transmembrane
pressures ( P) in the range of 0.5–2 bar, after removing of the
membrane preservatives by immersing in water and after precompaction at 2 bar. The weight of permeated water versus time
was measured and the clean water flux (Jw in L/m2 /h) was calculated for each pressure considering the effective membrane surface
area, which was 13.4 cm2 (The area is assumed as constant after
preparation of a microstructured surface). The clean water permeance (CWP, in L/m2 /h/bar) of the membrane was determined from
the slope of Jw versus P relationship.
3.3. AF4 experiments
The AF4 system was an Eclipse DualTec system (Wyatt Technology Europe, Germany) connected to an Agilent HPLC 1200 system
(Agilent Technologies, Germany) that consisted of a degasser, an
isocratic pump, a UV detector and an autosampler equipped with
a thermostat. The temperature of the autosampler was set at 5 ◦ C.
Two AF4 trapezoidal channels were used, designated as Channel
I and II, one for each membrane/mold size (Fig. 4). The MS membranes were cut with the grooves perpendicular and in the shape
of the porous frit with surgical scissors.
Channel I was a commercial AF4 channel (Wyatt Technology
Europe) which was used with the larger patterned membrane
(d = 15.1 cm). It had tip-to-tip length 13.3 cm and accumulation area
15.6 cm2 (Fig. 4a). The nominal spacer thickness was 250 or 350 m.
The focus-flow was 1.5 mL/min for 3 min and the focusing point was
set at 18% of the channel length. The injected volume was 10 L
(10 g injected mass) and the UV detection was at 280 nm.
Channel II was a miniaturized channel created to test the smaller
patterned membrane (d = 6.8 cm). It had tip-to-tip length 6.3 cm
and accumulation area 7.24 cm2 (Fig. 4b). It was created using a
commercial channel modifying its upper inlay and spacer. In the
upper inlay two internal threads were milled to connect the tubing
fittings for the inlet and outlet. The spacer was fabricated cutting
Mylar A4 sheets of nominal thickness 250 and 350 m. The focusflow was 0.8 mL/min applied for 3 min and the focusing point was
set at 18%. The injected volume was 5 L (5 g injected mass) and
UV detection was at 220 nm.
3.4. Computational fluid dynamics (CFD)
A finite element solver, COMSOL Multiphysics 5.2 (COMSOL Inc.,
MA, USA), was used to model the AF4 channel and simulate the
protein migration over the flat and the patterned membrane. To
reduce the model into two dimensions for lower computational
cost, a symmetrical channel was modelled instead of an asymmetrical. For this purpose, a simple rectangular domain was created,
with a flat or grooved bottom boundary. A mesh of free triangular
elements was created with very fine elements (<1 m) in the proximity to the bottom boundary to simulate protein migration with
high accuracy.
To describe the flow, laminar flow of an incompressible fluid
was used and the boundary conditions (inlets, outlets) were set
to define channel flow and cross-flow velocities (it was verified
later from the results that the assumption of the laminar flow was
valid by the cell Reynolds number). The cross-flow velocity was distributed homogeneously along the bottom boundary (membrane).
The option “transport of diluted species” (including convection and
diffusion) was used to simulate protein monomer and dimer. The
study of the flow profile was solved as a steady state problem and
the output (velocity field) was used to solve the time dependent
problem of the protein migration with a BDF (Backwards Differential Formula) solver. The relative and the absolute tolerances were
set at 10−4 . The initial and the maximum time steps were set 0.001 s
and 0.5 s, respectively.
4. Results and discussion
4.1. Characterization of the microstructured membranes
The microstructured membranes, designated as MS membrane
I and II had similar ridge height, h ∼12 m, and different peri-
6
M. Marioli et al. / J. Chromatogr. A 1605 (2019) 360347
Table 1
Protein recovery in AF4 before and after hot embossing of the UF membranes. AF4 conditions: V˙ c = V˙ out = 1 mL/min.
Recovery (%) ± s.d.
Flat membrane (10 kDa)
MS membrane I
Flat membrane (30 kDa)
MS membrane II
BSA (66.5 kDa)
␥-Globulin (150 kDa)
Apoferritin (443 kDa)
Thyroglobulin (669 kDa)
89 ± 2
22 ± 4
20 ± 3
9±1
86 ± 2
35 ± 5
60 ± 5
11 ± 3
87 ± 3
86 ± 1
82 ± 4
84 ± 2
78 ± 4
76 ± 3
71 ± 2
72 ± 3
odicity (i.e., the sum of cavity and ridge width), 100 and 50 m
respectively (Fig. 4). The shape of the patterns was rectangular with round corners (MS membrane I) or ellipsoidal (MS
membrane II) as the rectangular cavities of the mold were not
completely filled during embossing. Although the polymer is
heated above its glass transition temperature in hot embossing
processes, embossing was performed below the glass transition
temperature, since collapse of the pores and loss of permeance are reported in the literature for a PES membrane [20].
The CWPs of the non-patterned membranes were estimated as
150 ± 20 L/m2 /h/bar (for membranes with 10 kDa MWCO) and
271 ± 113 L/m2 /h/bar (for membranes with 30 kDa MWCO). The
CWPs of both membranes decreased after hot embossing; MS membrane I had CWP of 74 ± 1 L/m2 /h/bar and MS membrane II had CWP
of 130 ± 18 L/m2 /h/bar.
Protein rejection of the MS membranes was evaluated with the
AF4 system; the recovery of four proteins of different molecular
weight (66.5–669 kDa) was estimated from the ratio of the peak
area of the fractionated sample to the peak area of the unfractionated sample. The peak area of the unfractionated sample was
estimated from the fractogram obtained by injecting and eluting
the same amount of the protein with the same channel outlet flow
rate, without the application of focus flow or cross-flow except
for apoferritin. The solution of apoferritin contained low molecular weight components which were UV-active at the detection
wavelength, and therefore focus flow was applied for their removal.
For this reason, the recovery values of apoferritin may be slightly
overestimated for all measurements (both with flat and with MS
membranes). The experimental results are given in Table 1; the
recovery of the smaller proteins (BSA and ␥-globulin) was significantly lower for the MS membranes.
The decrease in recovery after hot embossing should indicate
an increase in the actual MWCO rather than protein adsorption
since the PES membranes used in this study are hydrophilic with
low fouling properties for protein solutions. This was confirmed by
injecting and focusing for several minutes a high volume (100 L)
of a concentrated solution (30 mg/mL) of hemoglobin (∼65 kDa)
which has a red color. It was observed that the sample was focused
as a narrow band with a flat membrane while it was passing through
the cross-flow with an MS membrane. When the membrane was
removed and visually inspected, it was not stained which would
indicate adsorption.
The aforementioned results (increase in MWCO and decrease
in CWP) seem contradicting since lower CWP is often correlated
with a decrease in the size or number of the pores of the selective
(patterned) side. A possible explanation is that the CWP decreases
because of the membrane compaction (particularly in the area
of the grooves’ valleys which experience the highest stress during hot embossing). In addition, the increase in the actual MWCO
might be related to an increase of the pore size of the grooves’
ridges because of the membrane deformation or to other local
defects that occur during imprinting/demolding which are, however, small enough to affect only the recovery of the smaller
proteins.
In contrast with our observations, Maruf et al. [20] showed that
hot embossing could lead to similar CWP and lower MWCO for
another PES membrane and a mold patterned with smaller grooves
(in the sub-micron range). Perhaps the pore deformation there was
minimal because of the smaller size of the grooves. However, the
effect of the membrane compaction on the CWP and the difference
in the stress distribution on the valleys and on the ridges during
hot embossing have been discussed in these studies [21]. Overall
our results indicate that hot-embossing needs to be optimized to
avoid changes of the MWCO since the concept would be beneficial particularly for low molecular weight analytes, and in general
UF membranes with high solvent permeability are preferred in
AF4.
Using BSA as the calibrant with known diffusion coefficient
(6.21·10−11 m2 /s [26]), the actual channel thickness for the Channel I and the Channel II with a flat membrane was estimated
305 ± 6 m and 294 ± 8 m respectively, and the diffusion coefficient of apoferritin was estimated 3.38·10−11 m2 /s from Eq. (1).
These values were used in the simulations. However, MS membranes are already compressed due to hot embossing, and hence
any additional compression caused by the spacer is expected to
be small. This would result in larger actual channel thickness and
consequently in longer retention times. The difference in compression between the flat and the MS membranes was evident by
visual inspection when the membranes were removed from the
channel and inspected. Unfortunately, the method with a protein
of known diffusivity cannot be applied for the MS membranes as
the retention time increases by the presence of the grooves for
well-retained compounds. However, in order to assess correctly
the effect of grooves, the actual channel thickness of the MS membranes needs to be measured and we attempted this by other
means.
First, the membrane compressibility was estimated from the difference in the thickness of the compressed and non-compressed
part of the membranes, measured by SEM and a micrometer screw
gauge when they were removed from the channel. The compression that occurred with a flat and a MS membrane was ∼50 m
and ∼20 m respectively. This corresponds to 11% larger channel
thickness with the MS membranes. However, these methods have
low precision since they measure only a very small part of the total
membrane area when the membranes are dry. Second, we applied
the rapid breakthrough method [27] in the fractograms obtained
for the recovery experiments with injection and elution of thyroglobulin (without the application of focus or cross-flow). The void
volume was measured 13% larger with the MS membrane which
corresponds to a 13% thicker channel. This result is in close agreement with the first method. However, both methods do not use
cross-flow which might slightly affect the membrane compression
and/or swelling.
4.2. AF4 experiments
Apoferritin and thyroglobulin were chosen as the model proteins to assess the effect of the grooves on retention time, selectivity
and plate height, since they exhibited high recoveries with the patterned membranes (Table 1). In Fig. 5 the fractograms of apoferritin,
obtained using flat and MS membranes, are overlaid after subtraction of the time that was required for the focusing step. For both
M. Marioli et al. / J. Chromatogr. A 1605 (2019) 360347
7
Fig. 5. Comparison of flat and MS membranes analyzed with flow rates V˙ c = V˙ out = 1.0 mL/min for a) Channel I and MS membrane I and b) Channel II and MS membrane II.
Fig. 6. CFD model for the Channel II/MS membrane II system: a) Mesh of the model in the beginning of the channel, b) velocity profile over the grooves, c) concentration
profile of apoferritin over the grooves and d) derived concentration at the outlet (right boundary) for every time point for the monomer and dimer.
8
M. Marioli et al. / J. Chromatogr. A 1605 (2019) 360347
Table 2
Comparison of flat and MS membranes for both channels with respect to the plate height of the monomer H, the retention time of the monomer tR,1 and the selectivity a
between the monomer and the dimer. The error bars are given at 1 level and reflect the membrane-to-membrane reproducibility.
Channel I
Apoferritin
Flat membrane,
w = 350 m
MS membrane I,
w = 350 m
MS membrane I,
w = 250 m
Thyroglobulin
V˙ c / V˙ out (mL/min)
H (mm)
tR,1 (min)
a
H (mm)
tR,1 (min)
a
0.8 / 0.8
1.0 / 1.0
1.5 / 1.5
0.8 / 0.8
1.0 / 1.0
1.5 / 1.5
0.8 / 0.8
1.0 / 1.0
1.5 / 1.5
0.88 ± 0.02
0.66 ± 0.02
0.43 ± 0.01
1.03 ± 0.01
0.78 ± 0.03
0.65 ± 0.04
1.27 ± 0.02
0.93 ± 0.05
0.64 ± 0.00
4.66 ± 0.17
4.62 ± 0.25
4.51 ± 0.16
7.78 ± 0.04
8.09 ± 0.08
8.25 ± 0.23
4.59 ± 0.04
4.92 ± 0.37
5.00 ± 0.04
1.35 ± 0.02
1.36 ± 0.01
1.37 ± 0.02
1.42 ± 0.01
1.45 ± 0.00
1.49 ± 0.01
1.44 ± 0.01
1.46 ± 0.02
1.51 ± 0.01
0.69 ± 0.01
0.54 ± 0.02
0.42 ± 0.01
0.87 ± 0.02
0.69 ± 0.01
–
0.91 ± 0.04
0.79 ± 0.02
0.54 ± 0.01
6.32 ± 0.30
6.26 ± 0.33
6.33 ± 0.31
11.15 ± 0.24
11.45 ± 0.18
–
6.57 ± 0.15
6.63 ± 0.10
7.39 ± 0.04
1.35 ± 0.01
1.36 ± 0.00
1.36 ± 0.02
1.46 ± 0.01
1.51 ± 0.01
–
1.45 ± 0.02
1.48 ± 0.01
1.53 ± 0.02
Channel II
Apoferritin
Flat membrane,
w = 350 m
MS membrane II,
w = 350 m
MS membrane II,
w = 250 m
Thyroglobulin
V˙ c / V˙ out (mL/min)
H (mm)
tR,1 (min)
a
H (mm)
tR,1 (min)
a
0.5 / 0.5
0.8 / 0.8
1.0 / 1.0
0.5 / 0.5
0.8 / 0.8
1.0 / 1.0
0.5 / 0.5
0.8 / 0.8
1.0 / 1.0
0.27 ± 0.01
0.16 ± 0.00
0.13 ± 0.00
0.43 ± 0.01
0.33 ± 0.01
0.29 ± 0.00
0.53 ± 0.01
0.34 ± 0.02
0.29 ± 0.01
4.25 ± 0.23
4.26 ± 0.32
4.33 ± 0.17
8.88 ± 0.14
9.90 ± 0.08
12.22 ± 0.05
4.61 ± 0.03
5.47 ± 0.08
5.74 ± 0.02
1.34 ± 0.01
1.35 ± 0.02
1.35 ± 0.01
1.49 ± 0.01
1.55 ± 0.01
1.59 ± 0.01
1.48 ± 0.00
1.56 ± 0.02
1.62 ± 0.01
0.21 ± 0.00
0.16 ± 0.02
0.15 ± 0.00
0.39 ± 0.02
0.36 ± 0.01
–
0.47 ± 0.00
0.32 ± 0.01
0.30 ± 0.00
5.90 ± 0.48
5.92 ± 0.46
5.89 ± 0.47
13.16 ± 0.13
14.56 ± 0.09
–
6.80 ± 0.14
8.28 ± 0.18
8.88 ± 0.20
1.33 ± 0.00
1.33 ± 0.01
1.34 ± 0.01
1.50 ± 0.01
1.57 ± 0.02
–
1.53 ± 0.02
1.63 ± 0.00
1.68 ± 0.01
channels/MS membrane systems and the same spacer thickness of
350 m (Fig. 5 left-hand figures), there is a considerable increase
in retention time, selectivity and resolution between monomer and
dimer. Although there is more peak broadening with the presence
of the grooves, resolution is higher because of the higher selectivity
(as expected by the theory, Fig. 3). Consequently, the same resolution could be achieved with the MS membranes and applying a
lower cross-flow rate, or alternatively using a thinner spacer (Fig. 5
right-hand figures).
Therefore, the MS membranes could be beneficial as the same
retention and resolution could be achieved with lower cross-flow
rates without the need to increase spacer thickness or to use
impractical cross-flow to outlet flow ratios. In practice that would
be particularly useful for relatively small solutes (such as BSA or
even smaller) since larger solutes can be analyzed with optimal
spacer thickness and flow rates, and therefore there is a need to
fabricate MS membranes with lower MWCO. The challenges and
the procedures to optimize AF4 methods for small solutes with a
300 Da MWCO membrane have been reported [28]. Smaller macromolecules are typically analyzed by size exclusion chromatography
(SEC) where they exhibit very good resolution, but in some cases,
SEC is not suitable, for instance, when there is strong non-specific
adsorption in the chromatographic support and when large macromolecules co-exist in the sample that need to be analyzed. In the
last case, a cross-flow program with exponential decay should be
used as the grooves would cause very strong retention for the large
components.
A series of experiments were carried out using different crossflow rates while retaining the ratio (V˙ c /V˙ out = 1); the results are
displayed in Table 2. The plate height of the monomer was estimated from the width at half peak height. A number of conclusions
may be drawn from these experimental results. Although there is
a large departure of the engineered grooves from the theoretical
model (i.e., no slip, infinitesimal ridge and rectangular shape), the
underlying conclusions were found similar.
First, from Table 2, it can be seen that for higher V˙ c and same
V˙ c /V˙ out the retention time of the monomer and the selectivity
between monomer and dimer were similar for the flat membranes
as expected by the theory (Eqs. (1) and (2)) but increased for the MS
membranes. This is in line with the theoretical equations derived
by moment analysis (Eqs. (15) and (16)). Secondly, for the same
experimental conditions, the increase in selectivity was higher for
thyroglobulin (lower ) and it was independent of the spacer thickness, as predicted by the theory. Lastly, the increase in retention
time and selectivity for the same cross-flow velocity was higher for
the MS membrane II, probably due to the smaller slip because of
the smaller periodicity of the grooves.
It is however important to note that part of the increase in
retention time is a result of the larger actual channel thickness
with the MS membranes. As it was mentioned above, the channel
thickness was estimated ∼12% larger with MS membranes, which
corresponds to ∼25% longer retention times caused by the effect of
the membrane compression, as the retention time is proportional
to w2 (Eq. (1)). Even so, in the experimental results (Table 2) we
observe a much higher increase in the retention times, namely from
67% (for Channel I and a cross flow rate of 0.8 mL/min) to 180% (for
Channel II and a cross-flow rate of 1.0 mL/min) for the monomer of
apoferritin, which indicates that the effect of the grooves has the
largest contribution to the increase in the retention time. Moreover,
overloading was investigated by injecting different sample mass,
namely 2 g, 10 g, and 20 g, in the Channel I/MS membrane I
system; no overloading effect was observed as retention time, plate
height and selectivity were practically the same for every examined
injected mass.
4.3. Computational fluid dynamics
For the CFD experiments, the miniaturized channel (Channel
II in Fig. 4) was modelled and the migration of the apoferritin
monomer and dimer was simulated. The diffusion coefficients for
the monomer and for the dimer of apoferritin were taken from
the AF4 experiments (where the ratio of the diffusion coefficients,
and therefore the selectivity was 1.34). The model was verified
by reducing significantly the size of the mesh elements, the time
M. Marioli et al. / J. Chromatogr. A 1605 (2019) 360347
Table 3
CFD experiments and comparison with the experimental results for apoferritin,
Channel II and cross-flow rate 0.5 mL/min.
Flat membrane-Exper.
Flat membrane-CFD
MS II membrane -Exper.
MS membrane II-CFD
tR,1 (s)
tR,2 (s)
a
255
261 (SE = 2%)
533
720
342
350 (SE = 2%)
794
1310
1.34
1.34 (SE < 1%)
1.49
1.82
step and the tolerances; all these changes did not alter the retention times (within 0.2%). The CFD model was validated comparing
the results (retention time and selectivity) with the experimental
results obtained for the nonpatterned membrane. Good agreement
was found, the standard error (SE) was 2% for the retention time
of apoferritin (monomer or dimer) and <1% for their selectivity
(Table 3). The assumption of the laminar flow conditions, which
was used for the model, was justified by the results; the Reynolds
number was less than 0.05 across the whole channel (maximum
in the middle of the channel thickness) and less than 2·10−4 inside
the grooves.
For the patterned membrane (MS membrane II) and
V˙ c = 0.5 mL/min, the flow and concentration profiles, and the
derived concentration at the outlet for each time point are
depicted in Fig. 6. It was revealed that the experimental retention
time and selectivity are much lower compared to the values
predicted by the simulation (Table 3). This may be due to a
non-uniform cross-flow velocity as a result of differences in
the membrane compaction and/or in the pore size between the
ridges and the cavities of the membrane’s selective layer as it was
discussed above.
5. Conclusions
To date only flat (non-patterned) UF membranes have been used
in AF4 as micron-sized features are considered harmful for the separation. We have demonstrated that micron-sized grooves could in
fact improve performance in AF4. This was shown by several means
including moment analysis, physical experiments, and CFD simulations. Our results show that perpendicular grooves can increase
retention, selectivity and resolution. This system could be useful as
macromolecules and nanoparticles could be analyzed with lower
cross-flow rates without the need to use higher spacer thickness
or higher cross-flow to outlet flow ratio. This concept could be
applied on any FFF system as it has been originally demonstrated
by Giddings et al. for ThFFF [12].
The physical experiments were carried out with microstructured UF membranes fabricated by hot-embossing. This fabrication
process caused an increase in the actual MWCO of the membrane
(as indicated by the AF4 experiments) but the effect of the grooves
could be shown with the larger protein standards used in this study
(apoferritin 443 kDa and thyroglobulin 669 kDa). However, this
concept could be particularly useful for smaller macromolecules,
and therefore future work should be focused on the fabrication of
microstructured membranes with lower MWCO and high water
permeability. This could be achieved, for instance, by methods
other than hot embossing such as phase separation or additive technologies (e.g., 3D printing of a non-porous or porous material over
an UF membrane). Additional research with CFD experiments of
different groove shapes and dimensions is underway to investigate
the optimal groove structure.
Acknowledgements
This work was part of the research program SmartSep with
project number 11400 which was financed by the Netherlands
9
Organization for Scientific Research (NWO). Authors also acknowledge Lydia Bolhuis-Versteeg (University of Twente) for her help on
SEM imaging and Wyatt Technology Europe for providing technical
assistance.
References
[1] C. Contado, Field flow fractionation techniques to explore the “nano-world”,
Anal. Bioanal. Chem. 409 (2017) 2501–2518, />s00216-017-0180-6.
[2] M.I. Malik, H. Pasch, Field-flow fractionation: new and exciting perspectives
in polymer analysis, Prog. Polym. Sci. 63 (2016) 42–85, />1016/j.progpolymsci.2016.03.004.
[3] F. von der Kammer, S. Legros, E.H. Larsen, K. Loeschner, T. Hofmann,
Separation and characterization of nanoparticles in complex food and
environmental samples by field-flow fractionation, TrAC – Trends Anal. Chem.
30 (2011) 425–436, />[4] S. Podzimek, Light Scattering, Size Exclusion Chromatography and
Asymmetric Flow Field Flow Fractionation, John Wiley & Sons, Inc., Hoboken,
New Jersey, 2011.
[5] K.G. Wahlund, J.C. Giddings, Properties of an asymmetrical flow field-flow
fractionation channel having one permeable wall, Anal. Chem. 59 (1987)
1332–1339, />[6] A. Litzén, K.G. Wahlund, Zone broadening and dilution in rectangular and
trapezoidal asymmetrical flow field-flow fractionation channels, Anal. Chem.
63 (1991) 1001–1007, />[7] R.N. Qureshi, W.T. Kok, Optimization of asymmetrical flow field-flow
fractionation (AF4), LCGC Eur. 23 (2010) 18–25.
[8] J.S. Yang, M.H. Moon, Flow optimisations with increased channel thickness in
asymmetrical flow field-flow fractionation, J. Chromatogr. A 1581–1582
(2018) 100–104, />[9] J.M. Davis, Influence of crossflow hydrodynamics on retention ratio in flow
field-flow fractionation, Anal. Chim. Acta 246 (1991) 161–169.
[10] J. Janˇca, Field-flow fractionation in microfluidic channels of low aspect ratio,
Int. J. Polym. Anal. Charact. 22 (2017) 62–71, />1023666X.2016.1232558.
[11] P.S. Williams, S.B. Giddings, J.C. Giddings, Calculation of flow properties and
end effects in field-flow fractionation channels by a conformal mapping
procedure, Anal. Chem. 58 (1986) 2403–2408, />ac00125a010.
[12] J.C. Giddings, L.K. Smith, M.N. Myers, Surface barriers for retention
enhancement in field-flow fractionation, Sep. Sci. Technol. 13 (1978)
367–385, />[13] A.D. Stroock, S.K.W. Dertinger, A. Ajdari, I. Mezic, H. a Stone, G.M. Whitesides,
Chaotic mixer for microchannels, Science 295 (2002) 647–651, .
org/10.1126/science.1066238.
[14] J.A. Bernate, C. Liu, L. Lagae, K. Konstantopoulos, G. Drazer, Vector separation
of particles and cells using an array of slanted open cavities, Lab Chip 13
(2013) 1086–1092, />[15] C.L.M.H. Navier, Mémoire sur les lois du mouvement des fluides, Mémoires de
l’Académie R, Des Sci. l’Institut Fr. 6 (1823) 386–436.
[16] C.Y. Wang, Flow over a surface with parallel grooves, Phys. Fluids 15 (2003)
1114–1121, />[17] T. Lee, E. Charrault, C. Neto, Interfacial slip on rough, patterned and soft
surfaces: a review of experiments and simulations, Adv. Colloid Interface Sci.
210 (2014) 21–38, />[18] P.S. Williams, Retention ratio and nonequilibrium bandspreading in
asymmetrical flow field-flow fractionation, Anal. Bioanal. Chem. 407 (2015)
4327–4338, />[19] S.H. Maruf, M. Rickman, L. Wang, J. Mersch IV, A.R. Greenberg, J. Pellegrino, Y.
Ding, Influence of sub-micron surface patterns on the deposition of model
proteins during active filtration, J. Memb. Sci. 444 (2013) 420–428, http://dx.
doi.org/10.1016/j.memsci.2013.05.060.
[20] S.H. Maruf, L. Wang, A.R. Greenberg, J. Pellegrino, Y. Ding, Use of
nanoimprinted surface patterns to mitigate colloidal deposition on
ultrafiltration membranes, J. Memb. Sci. 428 (2013) 598–607, .
org/10.1016/j.memsci.2012.10.059.
[21] S.H. Maruf, Z. Li, J.A. Yoshimura, J. Xiao, A.R. Greenberg, Y. Ding, Influence of
nanoimprint lithography on membrane structure and performance, Polymer
69 (2015) 129–137, />[22] M. Bikel, I.G.M. Pünt, R.G.H. Lammertink, M. Wessling, Shrinkage effects
during polymer phase separation on microfabricated molds, J. Memb. Sci. 347
(2010) 141–149, />[23] L. Vogelaar, R.G.H. Lammertink, J.N. Barsema, W. Nijdam, L.A.M.
Bolhuis-Versteeg, C.J.M. Van Rijn, M. Wessling, Phase separation
micromolding: a new generic approach for microstructuring various
materials, Small 1 (2005) 645–655, />200400128.
[24] Y.-J. Won, J. Lee, D.C. Choi, H.R. Chae, I. Kim, C.H. Lee, I.C. Kim, Preparation and
application of patterned membranes for wastewater treatment, Environ. Sci.
Technol. 46 (2012) 11021–11027, />[25] R. Aris, G.I. Taylor, On the dispersion of a solute in a fluid flowing through a
tube, Proc. R. Soc. London. Ser. A: Math. Phys. Sci. 235 (1956) 67–77, http://dx.
doi.org/10.1098/rspa.1956.0065.
10
M. Marioli et al. / J. Chromatogr. A 1605 (2019) 360347
[26] N. Meechai, A.M. Jamieson, J. Blackwell, Translational diffusion coefficients of
bovine serum albumin in aqueous solution at high ionic strength, J. Colloid
Interface Sci. 218 (1999) 167–175, />[27] J.C. Giddings, P.S. Williams, M.A. Benincasa, Rapid breakthrough
measurement of void volume for field-flow fractionation channels, J.
Chromatogr. A 627 (1992) 23–35.
[28] C.W. Cuss, I. Grant-weaver, W. Shotyk, AF4-ICPMS with the 300 Da membrane
to resolve metal-bearing “Colloids” <1 kDa: optimization, fractogram
deconvolution, and advanced quality control, Anal. Chem. 89 (2017)
8027–8035, />