Pressure-Flow experiments, packing, and modeling for scale-up of a mixed mode chromatography column for biopharmaceutical manufacturing
Bạn đang xem bản rút gọn của tài liệu. Xem và tải ngay bản đầy đủ của tài liệu tại đây (907.8 KB, 10 trang )
Journal of Chromatography A 1625 (2020) 461117
Contents lists available at ScienceDirect
Journal of Chromatography A
journal homepage: www.elsevier.com/locate/chroma
Pressure-Flow experiments, packing, and modeling for scale-up of a
mixed mode chromatography column for biopharmaceutical
manufacturing
Jessica Prentice†, Steven T. Evans†, David Robbins, Gisela Ferreira∗
AstraZeneca, One MedImmune Way, Gaithersburg, MD, 20878, United States of America
a r t i c l e
i n f o
Article history:
Received 1 July 2019
Revised 3 April 2020
Accepted 5 April 2020
Available online 22 April 2020
Keywords:
mAb protein purification
Column packing
Mixed-mode gel
Pressure-flow modeling
Chromatography scale-up
a b s t r a c t
To obtain consistent chromatographic behavior, it is important to develop resin packing methods in accordance with the characteristics of each resin. Resins, particularly those with a significant level of compressibility, require proper knowledge of the packing methodology to ensure scalable performance. The
study demonstrates the applicability of pressure-flow modeling based on the Blake–Kozeny equation for
cellulose based resins, using the MEP HyperCel (Pall) resin as a case study. This approach enabled the understanding of the appropriate bed compressibility and the determination of the minimum column diameter that can predict bed integrity during commercial manufacturing scale operation. Studies suggested
that scale-dependent wall effects become negligible for column diameters exceeding 20 cm. Pressureflow modeling produced a minimum compression recommendation of 0.206 for the MEP HyperCel resin.
Columns with diameters up to 80 cm packed with this bed compression yielded incompressible beds
with pressure-flow curves consistent with model predictions. Model parameter (particle diameter, viscosity, porosity) values were then varied to demonstrate how changing operating conditions influence model
predictions. This analysis supported the successful troubleshooting of unexpected high pressures at the
commercial manufacturing scale using MEP HyperCel resin, further supporting the applicability of this
approach.
© 2020 The Authors. Published by Elsevier B.V.
This is an open access article under the CC BY-NC-ND license.
( />
1. Introduction
Column chromatography is used extensively in the biopharmaceutical industry to purify therapeutic proteins from complex
feed streams. Development of commercial scale purification processes often employs column re-use (cycling) and/or column scaleup [1] approaches. To obtain consistent chromatographic behavior
over a column’s lifetime and during scale-up, it is important to develop resin packing methods in accordance with the characteristics
of each resin [2,3].
Further, column operation can sometimes impact the column
integrity over the course of a column lifetime if the column is deficiently packed in some manner (e.g., insufficient bed compression). Changing bed stability can lead to issues (e.g., abnormally
high pressure drops across the bed, changing product pool vol-
∗
†
Corresponding author.
E-mail address: (G. Ferreira).
Authors had equal contributions.
umes, or variable product quality) that can result in flow constraints and lost throughput. Chromatography development is typically performed using scale-down models, sometimes with prepacked columns, which have been shown to be well packed for
numerous stationary phases [4]. With scale-up however, as the
column diameter increases while maintaining constant bed height
and superficial flow velocity, some effects at the small scale (e.g.,
forces exerted by the walls of the chromatography column hardware) can differ from those at larger scales. Chromatography operating conditions (e.g., bed heights, flow rates, or buffer solutions)
identified at the small scale may not produce comparable product quality or process performance if the packing quality or wall
effects change over the scaling-up. Upon scale-up at constant bed
height, the resin compression will increase with increasing column
diameter and concomitant decreases in the column aspect ratio
(bed height divided by diameter). This is due to a phenomenon
that as columns are scaled-up and as aspect ratios increase, the
wall support to the packed bed decreases. Flow can induce increased compression of the resin, causing increased pressure drops
/>0021-9673/© 2020 The Authors. Published by Elsevier B.V. This is an open access article under the CC BY-NC-ND license. ( />
2
J. Prentice, S.T. Evans and D. Robbins et al. / Journal of Chromatography A 1625 (2020) 461117
across the packed bed and decreased bed stability. A further complication is that chromatography resins can exhibit varying degrees
of compressibility. Resins with a significant level of compressibility
may be particularly sensitive to the operating scale and packing
conditions.
Several models have been developed to predict the pressure
drop across packed beds at varying scales [5]. Stickel and Fotopoulos [6] developed an empirical model which correlates bed compressibility with column aspect ratio and superficial flow velocity. This model accurately predicts the critical velocity (ucrit ) at
which flow induced resin compression reaches its maximum. This
compression is the critical compression (λcrit ), which is a resin
specific parameter and is largely unaffected by column geometry. Columns packed at or above this compression behave as if
they are incompressible, thus following the Blake–Kozeny equation
[7,8,9] for incompressible media. Pressure-flow modeling based on
the Blake–Kozeny equation can be implemented to understand bed
compressibility, wall effects, and determine the minimum diameter for a representative scale-down model that can accurately predict bed integrity and performance at commercial manufacturing
scale.
While this methodology was previously applied by Stickel
[6] and Keener [5] to Sepharose and methacrylate-based resins
having affinity, hydrophobic interaction and ion exchange functionalities, we expand upon this prior work by studying a cellulose based compressible resin with a mixed-mode ligand functionality, MEP HyperCel (Pall). MEP HyperCel is an industrially relevant mixed-mode chromatography resin [4,10-15]. While columns
packed with this resin behaved consistently at small scale, prior
to the application of the approach described in this paper we observed several issues during the operation of MEP HyperCel chromatography columns at the large scale. These included elevated
pressures, visible bed degradation (cracks), and rising concerns
about potential impact on column lifetime and/or product quality.
Further investigation in-house showed pH dependent changes in
particle diameter (from a mean particle diameter of 85 microns
at pH ≥ 5.5 during equilibration, load and post-load washes to
89 microns at pH 3.0 during the strip). At the compression factors
used to pack these columns (≤0.248), this resulted in an unstable
packed bed and the manufacturing issues described. As these pH
effects could not be avoided, modeling to determine appropriate
column packing (e.g., bed compression) was performed.
The Stickel–Fotopoulos approach [6] was applied for the development of a scalable packing method for the cellulose-based
mixed-mode chromatography resin MEP HyperCel. Pressure-flow
modeling based on the Blake–Kozeny equation was implemented.
Optimal packing compression was determined based on model
predictions.
The modeling results were verified for various MEP HyperCel
column packing and operating conditions at the commercial manufacturing scale. The influence of process solution viscosity, pH,
resin slurry concentration, and accuracy of resin slurry delivery
to the column on the recommended column packing predictions
were illustrated. This was not only useful for the development of
the best packing method for this resin, but was also useful to
troubleshoot chromatographic behavior at the manufacturing scale.
This was shown through a case study in which unexpected highpressures were observed and the application of the modeling was
used to identify the root cause.
2. Experimental
2.1. Materials
Sodium phosphate monobasic (monohydrate), sodium phosphate dibasic (heptahydrate), sodium citrate dihydrate, citric acid
monohydrate, and sodium hydroxide were purchased from Avantor
(Center Valley, PA).
MEP HyperCelTM was purchased from Pall (Port Washington,
NY).
2.2. Apparatus
Laboratory-scale columns (Vantage-L, Millipore, Billerica, MA)
had inner diameters of 1.15, 2.2, and 4.4 cm. Pilot-scale columns
(BPG, GE Lifesciences, Pittsburgh, PA) had inner diameters of 20,
30, and 40 cm. Manufacturing scale columns (Euroflow Resolute
DAP, Pall Corporation Port Washington, NY) had inner diameters of
80 and 140 cm. All columns used had adjustable heights.
ÄKTA Explorer 100 FPLC systems (GE Lifesciences, Pittsburgh,
PA) were used with laboratory-scale columns. PK chromatography
systems (Pall Corporation, Port Washington, NY) were used with
pilot and manufacturing scale columns. Pressure drops across the
columns were monitored using the ÄKTA/Resolution system and/or
calibrated analog pressure gauges (Pellicon 0–60 psi gage, Millipore, Billerica, MA).
2.3. Procedures
2.3.1. Packing pressure-flow curve generation
All equipment and materials were equilibrated to ambient temperature (15–25 °C) prior to use. A pressure-flow curve without the
column in-line, generated for each chromatography system, was
used to subtract the equipment pressure drop from the total pressure drop to enable measurement of the pressure drop across the
packed bed alone. All pressure-flow profiles have the equipment
pressure drop subtracted. Before packing, the resin slurry concentration was determined by one of two methods: 1) allow a sample to gravity settle overnight in a graduated conical tube or 2)
centrifuge a sample for 10 min at 1600 G followed by a 30 min
static hold in graduated conical tube. To begin packing, a measured volume of slurry was poured into the column. The top adaptor was inserted into the slurry and flow started. To generate a
packing pressure-flow curve the procedure outlined by Stickel and
Fotopoulos [6] was used: an initial flow rate generating less than
5 psig pressure drop was maintained until the bed consolidated.
The flow rate was then increased incrementally, with pressure drop
and bed height recorded at each increment. This was repeated until a non-linear response in pressure for an incremental change in
pump speed was observed. Packing pressure-flow curves for MEP
HyperCel were generated using acidic strip buffer (100 mM sodium
citrate pH 3.0) mobile phase.
2.3.2. Post-pack pressure-flow curve generation
Columns were packed according to internal packing procedures
to the desired bed height specifications and tested to ensure passing packed bed quality. The flow rate was then increased incrementally and the pressure drop over the packed bed recorded at
each flow rate increment. The final condition (flow rate and pressure drop) did not exceed vendor recommendations to avoid further bed compression. Post-packing pressure-flow curves for MEP
HyperCel were generated in both citrate buffer (100 mM sodium
citrate pH 3.0) and sodium hydroxide (0.1 N) mobile phases.
2.3.3. Modeling methodology
Modeling of pressure-flow behavior in columns was performed
as described by Stickel and Fotopoulos [6]. The methodology is
summarized as follows:
1) Experimentally determine model parameters:
a) Packing pressure-flow curves were generated using multiple
column aspect ratios as described in 2.3.1.
J. Prentice, S.T. Evans and D. Robbins et al. / Journal of Chromatography A 1625 (2020) 461117
b) The critical velocity (ucri ) was determined from each packing pressure-flow curve as the point at which the pressureflow relationship becomes non-linear.
c) The critical velocity times the initial bed height (ucrit L0 ) was
plotted against the aspect ratio (L0 /D). This yielded a linear
relationship with the following correlation:
ucrit L0 = m
L0
D
+b
(1)
where the slope (m) and intercept (b) are empirical constants determined by linear regression. The empirical constant b is an indication of the resin’s compressibility, while
the constant m is a measure of changing wall support.
d) Plot (ucrit L0 ) against the inverse of the aspect ratio (D/L0 ).
This showed an asymptotic relationship as (D/L0 ) increased
(related to the intercept b from the plot of (ucrit L0 ) against
(L0 /D)). The asymptote indicated the point at which the wall
effects became negligible.
e) The critical compression of the resin (λcrit ) is determined by
taking the average critical compression from each packing
pressure-flow curve determined in 2.3.1. Critical compression was determined as:
L − Lcrit
L0
λcrit =
(2)
where Lcrit is the bed height at ucri determined in step (b).
f) Other model parameters (dp = effective particle diameter,
ε0 = gravity settled bed porosity, μ = viscosity of mobile
phase solution, and K0 = empirical constant for the Blake–
Kozeny equation) can be obtained from the resin manufacture and literature tabulated values.
2) Use the model to predict packing pressure-flow profiles (confirmation of model fit)
a) For a given column geometry (L0 /D), calculate the critical
velocity (ucrit ) using Eq. (1) above.
b) Calculate bed compression using the following equation for
a given linear flow velocity (u):
λ=
λcrit u
(3)
ucrit
c) Calculate bed height for each compression:
L = L0 − ( λ ∗ L0 )
(4)
d) Calculate bed porosity for each compression:
ε=
ε0 − λ
1−λ
(5)
e) Calculate the pressure drop ( P) as a function of velocity
(u) using values from Steps 1f, 2c, and 2d using the Blake–
Kozeny:
P=μ
K0 (1 − ε )
Lu
ε3
dP2
2
(6)
f) Repeat steps 2a through 2e for increasing linear flow velocities (u) until the critical velocity is reached (u = ucrit )
to generate the pressure-flow curve. The model predicted
pressure-flow curves will match the experimentally generated pressure-flow curves from step 1a, and as such will be
non-linear.
g) Repeat 2a-f for other column geometries (L0 /D) to see how
pressure-flow behavior changes with column geometry. The
steps can also be repeated for other mobile phase conditions
as needed.
3) Use the model to predict post-pack pressure-flow profiles and
scale-up of the packed column
3
a) Pack columns to compression equal to or greater than the
critical compression determined in step 1e.
b) Post-pack pressure flow curves will be linear with intercept
at zero and slope ࢞Pcrit /ucrit. (where ࢞Pcrit was the pressure
drop measured at ucrit from step 1 and/or 2f).
3. Results and discussion
3.1. Experimental determination of Stickel–Fotopoulos model
parameters for MEP HyperCel
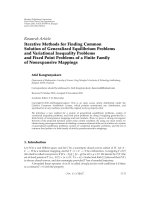
Packing pressure-flow curves for numerous packs at varying column aspect ratios were generated as described in
Section 2.3.1 in the acidic strip buffer (when resin particle diameter is largest) (Fig. 1). For each trace, as the linear velocity increases during packing the pressure drop increases gradually until a critical velocity (ucrit ) is reached, at which point there is a
dramatic increase in pressure preventing further increases in flow
rate.
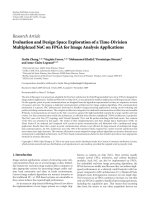
Fig. 2a shows the various critical velocities (ucrit ) determined
from Fig. 1 multiplied by the initial gravity settled bed height
(L0 ) and plotted against the initial gravity settled bed aspect ratio (L0 /D). A linear fit of the experimental data yields the parameters for the Stickel–Fotopoulos pressure-flow model from the slope
(m) and the y-intercept (b) of the line. The empirical constant b
is the value of (ucrit ∗ L0 ) for an infinite diameter column, which
provides a numerical indication of the compressibility of a resin
for a particular buffer composition: the lower the b coefficient the
higher is the compressibility of the resin. The empirical constant
m provides a numerical indication of the changing wall support as
a function of scale: the larger the slope m the more sensitive the
resin is to changing wall support. The m and b values (1345 and
9920, respectively) for MEP HyperCel were greater than published
values [6] for Sepharose 4FF and Sepharose 6 FF resins (GE Healthcare), which ranged from 400 to 10 0 0 for m and 20 0 0 to 50 0 0 for
the coefficient b. This indicates that the MEP HyperCel stationary
phase is less compressible than the Sepharose resins, and that the
changes in wall support more drastically impact the pressure-flow
profile for MEP HyperCel than for the Sepharose resins.
Fig. 2b, the normalized critical velocity plotted against the inverse aspect ratio, shows an asymptote at lower values of ucrit ∗ L0 .
This means that as the diameters of the columns become larger for
a fixed bed height, the wall effects become negligible.
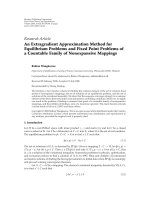
As the linear velocity and pressure drop increase during packing, the resin bed height decreases (compression increases) until
critical velocity (ucrit ) is reached, at which point the bed compresses no further. This is the critical compression (λcrit ), and the
resulting packed bed behaves as if incompressible, with scaleindependent pressure-flow curves. Fig. 3 shows the critical compressions for the columns from Fig. 1. The maximum critical compression observed during the studies was 0.206.
The experimentally determined Stickel–Fotopoulos model parameters are summarized in Table 1.
3.2. Stickel–Fotopoulos model-predicted packing pressure-flow profiles
for MEP HyperCel (confirmation of model fit)
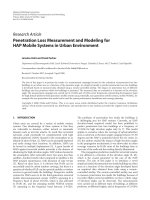
The parameters in Table 1 were then used to model packing
pressure-flow curves as described in Section 2.3.3. The modelpredicted curves for columns of various diameters ranging from
1.1 cm to 180 cm in diameter are shown in Fig. 4.
The model predicted pressure-flow curves begin to overlap for
columns having diameters greater than 20 cm, indicating that
scale-dependent wall effects become negligible. This is consis-
4
J. Prentice, S.T. Evans and D. Robbins et al. / Journal of Chromatography A 1625 (2020) 461117
2000
1800
Apsect
Ratio
(L0/D):
1600
Press ure Drop, ∆P (kPa)
1400
22.4
20.0
15.3
13.8
9.4
9.3
6.0
4.6
3.2
1.3
1200
1000
800
600
Critical
Velocity
400
200
0
0
500
1000
1500
2000
2500
3000
Linear Velocity, u (cm/hr)
3500
4000
4500
Fig. 1. Experimental pressure-flow curves for the determination the critical velocity. Pressure drop ( P) is plotted against the linear velocity for various aspect ratios (L0 /D).
Table 1
Stickel–Fotopoulos pressure-flow model parameters
used for MEP HyperCel.
Model parameter
Value
m (cm2 /hr)
b (cm2 /hr)
1345a
9920a
0.206b
0.00855c
0.41d
0.001037e
150f
λcrit
dp (cm)
ε0
μ (Pa s)
K0
a
Model parameters m and b are the slope and
y-intercept, respectively, derived from a linear fit to
the experimental data in Fig. 2a.
b
Maximum critical compression observed during
the experiments described in Section 3.1 and Fig. 3.
c
Obtained from the resin vendor, www.pall.com.
d
Gravity settled bed porosity assumed for MEP
HyperCel, based on literature [5,6] which showed
the gravity settled bed porosity for 10 other commercially available resins varied between 0.38 and
0.42. An experimentally determined porosity was
not obtained, as the various small molecule dye
tracers injected into the column in attempt to measure porosity all irreversibly bound to the MEP HyperCel resin, preventing measurement of porosity.
e
Viscosity for the acidic strip buffer (100 mM
sodium citrate pH 3.0) [16] in which the packing
pressure-flow experiments described in Section 3.1
were performed.
f
Empirical constant value adopted from literature
[6].
tent with the experimental data presented in Fig. 2b for columns
with diameters greater than 20 cm. These results confirm the fit
of the Stickel–Fotopoulos model parameters in Table 1 for MEP
HyperCel.
3.3. Post-pack pressure-flow profiles and scale-up of packed MEP
HyperCel columns
For packed columns with stable beds, independent of column diameter scale, the column must be packed to compressions
equal to or greater than the critical compression for the resin.
Fig. 3 showed the maximum critical compression value observed
for MEP HyperCel in acidic strip buffer to be 0.206. To confirm
that this is the appropriate compression for a stable bed, two
MEP HyperCel columns were packed at compression values lower
and higher than the critical compression value (λ = 0.130 and
λ = 0.375, respectively) and the bed stability (as measured by
the number of theoretical plates, Fig. 5) and chromatographic performance (Table 2) was tested over several cycles. For the column packed at a compression of 0.130, the number of theoretical plates decreased, visible cracks formed in the column bed and
changes in chromatogram shape and product volume were observed with increasing numbers of cycles of the biopharmaceutical separation. This suggested instability of the packed bed and
loss of chromatographic resolution. Conversely, the column packed
at a compression of 0.375 maintained its number of theoretical
plates, bed integrity and chromatographic performance. These results confirmed that packing the column at or above the critical
compression value yields a stable packed bed, and a compression
value of 0.375 was chosen as the target compression for all future MEP HyperCel columns to be packed in the manufacturing
facility.
Post-pack pressure-flow profiles were then generated for multiple columns with different diameters (1.1–80 cm, constant bed
height of 19 ± 3 cm) packed with MEP HyperCel at the compression value of 0.375. Fig. 6 shows the experimentally generated
pressure-flow profiles, as well as the Stickel–Fotopoulos modelpredicted pressure-flow profile. The plotted pressure-flow curves
J. Prentice, S.T. Evans and D. Robbins et al. / Journal of Chromatography A 1625 (2020) 461117
5
a)
45000
Normalized Critical Velocity, ucrit * L0 (cm2/hr)
40000
Apsect
Ratio
(L0/D):
35000
y = 1345.4x + 9920.2
R2 = 0.9956
30000
22.4
20.0
15.3
13.8
9.4
9.3
6.0
4.6
1.3
trendline
25000
20000
15000
10000
5000
0
0
5
10
15
Aspect Ratio, L0/D
20
25
30
b)
45000
Normalized Critical Velocity, ucrit * L0 (cm2/hr)
40000
Apsect
Ratio
(L0/D):
35000
22.4
20.0
15.3
13.8
9.4
9.3
6.0
4.6
1.3
trendline
30000
25000
20000
15000
10000
5000
0
0.0
0.2
0.4
0.6
0.8
1.0
Inverse Apsect Ratio, D/L0
1.2
1.4
Fig. 2. a) Critical velocity times initial bed height (ucrit ∗ L0 ) plotted against the aspect ratio (initial bed height divided by the diameter, L0 /D), b) Critical velocity times initial
bed height (ucrit ∗ L0 ) plotted against the inverse of the aspect ratio (diameter divided by initial bed height, D / L0 ).
6
J. Prentice, S.T. Evans and D. Robbins et al. / Journal of Chromatography A 1625 (2020) 461117
0.250
Critic al Compres s ion, λcrit
0.200
Apsect
Ratio
(L0/D):
22.4
20.0
15.3
13.8
9.4
9.3
6.0
4.6
1.3
0.150
0.100
0.050
0.000
0
5
10
15
Aspect Ratio, L0/D
20
25
Fig. 3. Critical compressions, corresponding to the critical velocities determined in Fig. 1, plotted against aspect ratio.
Fig. 4. Pressure-flow modeling (Stickel–Fotopoulos) for gravity settled MEP beds in varying diameter columns.
were all linear and showed good agreement with the model prediction.
3.4. Additional considerations for model application
The application of the model in the manufacturing space can
predict appropriate column packing for consistent bed integrity.
The Blake–Kozeny equation used in the modeling is dependent on
several parameters whose variability should be considered in applying this approach to applications in which the packed column is
exposed to multiple different mobile phases as the column is cycled during processing: mobile phase viscosity, resin particle diameter, and resin porosity. This is a challenge particularly for MEP HyperCel as the resin particle diameter shrinks and swells markedly
J. Prentice, S.T. Evans and D. Robbins et al. / Journal of Chromatography A 1625 (2020) 461117
7
2200
Packe d Be d Integrity (theoretical plates /m)
2000
1800
Compression:
1600
λ = 0.130
λ = 0.375
1400
1200
1000
0
2
4
6
Cycle Number
8
10
12
Fig. 5. Packed bed integrity, as measured by theoretical plates per meter, for MEP Hypercel columns packed with compression levels of λ = 0.130 (♦) and λ = 0.375 ( ).
400
350
Pres s ure Drop, ∆P (kPa)
300
Column
Diameter:
250
1.1 cm
2.2 cm
4.4 cm
80 cm
Model Prediction
200
150
100
Bed Compression (λ) = 0.375
50
0
0
100
200
300
Linear Velocity, u (cm/hr)
400
500
Fig. 6. Experimental post-pack pressure-flow curves for varying diameter columns packed with MEP HyperCel at a bed compression of 0.375.
8
J. Prentice, S.T. Evans and D. Robbins et al. / Journal of Chromatography A 1625 (2020) 461117
Table 2
Packed bed integrity and its influence on chromatographic performance for MEP HyperCel columns packed at compression levels of λ = 0.130 (below critical compression
of λ = 0.206) and λ = 0.375 (above critical compression).
Number of product contact cycles:
1
6
11
λ = 0.130
HETP (plates/m)
Column visual appearance
Chromatogram shape
2100
No visual defects
Reference chromatogram
1600
No visual defects
Breakthrough during load,
pre-peak before elution
Product volume (CV)
HCP (ppm)
HETP (plates/m)
Column visual appearance
Chromatogram shape
Product volume (CV)
HCP (ppm)
4.6
Not tested
1650
No visual defects
Reference
5.6
3
5.9
1350
Visible cracks
Breakthrough during load,
large pre-peak before
elution, elution peak tailing
11.2
1700
No visual defects
Consistent with reference
6.6
<5 a
1650
No visual defects
Consistent with reference
5.6
<5 b
(below critical compression)
λ = 0.375
(above critical compression)
a
b
HCP measured after cycle 8.
HCP measured after >11 cycles.
Fig. 7. Impact of mobile phase on pressure-flow behavior. Model predictions are based on Blake–Kozeny equation incorporating known values for resin bead size and mobile
phase viscosity.
with shifts in mobile phase pH. Additionally, inaccuracies in measurements of the percentage of resin slurry, packing flow rate, and
volume of resin slurry delivered to the column can influence the
actual compression achieved and thus resin porosity. The impacts
of each of these parameters on the pressure flow model are explored below, including their consideration during troubleshooting
in the manufacturing setting.
3.4.1. Particle diameter
The work described in this paper thus far demonstrates the application of the model for MEP HyperCel in the acidic strip buffer.
In this buffer, the MEP HyperCel particle diameter was largest
(89 microns). To test the impact of resin particle diameter on behavior of MEP HyperCel columns, pressure-flow curves were generated in 0.1 N sodium hydroxide, which is the recommended packing solution for MEP HyperCel and in which the particle size was
the smallest (85 microns). Sodium hydroxide also served as a surrogate for neutral pH equilibration and wash buffers because particle size was determined to have little variability above pH 5.5.
As the acid strip and 0.1 N sodium hydroxide had comparable viscosities (1.04 cP and 1.02 cP, respectively), the influence of particle
diameter could be assessed independent of solution viscosity.
Fig. 7 shows the model predicted and experimental pressureflow curves for particle diameters resulting from the two mobile
phase solutions. The model predicted a 10% increase in pressure
per 1 micron increase in particle diameter (calculated by changing the particle diameter value in the Blake–Kozeny equation), in
agreement with the experimental data.
3.4.2. Viscosity
The influence of mobile phase viscosity was evaluated in 1 N
sodium hydroxide, which had higher viscosity (1.23 cP), as com-
J. Prentice, S.T. Evans and D. Robbins et al. / Journal of Chromatography A 1625 (2020) 461117
3.4.3. Porosity
Operational factors during column packing, such as resin slurry
concentration, packing flow rate, and volume of slurry delivered,
also influence model fit assumptions via the porosity (ε ) term of
the Blake–Kozeny equation. This was explained by Keener, et al.
[5], who showed that the porosity term of the Blake–Kozeny equation is dependent on bed compression (λ) according to the following expression shown in Equation 7:
ε = ε0 e
c
(L−L0 )
L
= ε0 e[−c ( 1−λ )]
λ
400
350
300
Pres s ure Drop, ∆P (kPa)
pared to the 0.1 N sodium hydroxide (1.02 cP) studied in the previous section [16]. As both these solutions had caustic pH, the influence of viscosity could be assessed independent of particle diameter (particle diameter was 85 microns at this pH).
Fig. 7 shows the model predictions and the experimental data
for pressure-flow curves generated in the two hydroxide solutions.
The model predicted a 10% increase in pressure per 0.1 cP increase in viscosity (calculated by changing the viscosity value in
the Blake–Kozeny equation), in agreement with experimental data.
9
Column
Diameter:
250
1.1 cm
2.2 cm
4.4 cm
80 cm
140 cm
Model Prediction
200
150
100
Bed Compression (λ) = 0.375
50
0
0
100
200
300
Linear Velocity, u (cm/hr)
400
500
Fig. 8. The pressure-flow profile for the 140 cm diameter manufacturing-scale column (•) is accurately predicted (solid line) when the actual compression of 0.429
was used, as compared to the pressure-flow profiles and model prediction columns
packed at the intended compression of 0.375 (other symbols, dashed line).
(7)
where c is a fitted parameter from the packing pressure-flow curve
experiments. Adding too much resin slurry to the column or packing at too high of a flow rate results in over-compression of the
bed (impacting L and λ in Eq. (7)) and a reduction in the porosity.
For example, a 1% increase in amount of resin slurry added to the
column results in a 1% increase in bed compression, which translates to a 2.5% decrease in porosity (calculated from Eq. (7)) and a
9% increase in pressure (calculated by changing the porosity value
in the Blake–Kozeny equation).
These exercises show that no matter how good a mathematical model, a successful application needs to consider factors and
variability external to the model. Multiple iterations of the model
may be necessary to gain full understanding of pressure-flow behavior and ensure a stable packed bed. This investigation suggests
an alternative application of the model to troubleshoot unexpected
pressure-flow behavior.
3.5. Use of the model to troubleshoot unexpected chromatographic
behavior
Section 3.3 demonstrated the successful application and verification of model predictions for columns between 1 cm and 80 cm
in diameter. The model predictions should hold true for even larger
diameter columns. However, when a 140 cm diameter column was
packed in our commercial manufacturing facility with the model
recommended target compression of 0.375, the post-pack pressureflow profile generated in the acidic strip buffer showed 5-fold
higher pressure than had been predicted by the model and previously demonstrated in smaller columns (Fig. 8), triggering an investigation into the root cause.
The factors discussed in Section 3.4 were scrutinized to identify the root cause of the higher than expected pressure. The correct packing buffer was selected and correctly prepared, eliminating the influence of particle diameter and solution viscosity. The
pump used to deliver resin slurry and packing buffer to the column was appropriately calibrated, eliminating the influence of flow
rate on porosity and bed compression. Similarly, the volume totalizer on packing system and the resin slurry tank weight totalizers
were appropriately calibrated, eliminating the influence of equipment on total volume of resin delivered to the column, porosity
and bed compression. Lastly, the measurement of slurry concentration was investigated. It was found that slurry concentration
had been underestimated, and therefore too much resin had been
added to the column. The actual bed compression was larger than
intended (0.429 versus 0.375), so porosity was much lower than
the porosity value used in the model and the resulting pressures
much higher than expected (Fig. 8), consistent with the discussion
in Section 3.4.3.
This investigation illustrates an alternative application of the
model to troubleshoot unexpected pressure-flow behavior.
4. Conclusions
Modeling and experiments were used to gain a fundamental
understanding of column performance for the mixed-mode resin
MEP HyperCel.
Pressure-flow modeling was used to predict chromatographic
bed compression, wall effects, and integrity at commercial manufacturing scales. Scale-dependent wall effects became negligible
for columns of diameters greater than 20 cm. A bed compression
greater than 0.206 yielded an incompressible resin bed resulting in
scale-independent pressure-flow curves.
Further, it was demonstrated that variability in the model parameters seen during operation of the chromatography column for
biopharmaceutical separations can impact the predictive capability
of the model for a packed bed. Mobile phase viscosity and particle diameter (as influenced by solution pH), as well as limitations
in measuring equipment for the determination of the resin slurry
concentration and volume, can exacerbate the resulting bed compression and pressure drops.
Finally, the model was used troubleshoot high pressure observations in a commercial manufacturing setting, illustrating an
alternative application of the model and the model’s predictive
power.
Collectively this work and the prior related literature [5,6]
demonstrate the robustness and consistency of this approach, and
its predictive capability for many types of resins.
Funding
This research did not receive any specific grant from funding
agencies in the public, commercial, or not-for-profit sectors.
Declaration of Competing Interest
The authors declare that they have no known competing financial interests or personal relationships that could have appeared to
influence the work reported in this paper.
10
J. Prentice, S.T. Evans and D. Robbins et al. / Journal of Chromatography A 1625 (2020) 461117
CRediT authorship contribution statement
Jessica Prentice: Conceptualization, Methodology, Formal analysis, Investigation, Writing - original draft. Steven T. Evans: Conceptualization, Methodology, Formal analysis, Investigation, Writing - original draft. David Robbins: Conceptualization, Writing review & editing. Gisela Ferreira: Conceptualization, Writing - review & editing, Supervision.
Acknowledgments
The authors would like to acknowledge Randal Lapcevich, Tolulope Ogunsola, Diemchi Vu, Brad Matanin, and John Higgins of AstraZeneca.
References
[1] A. Grönberg, M. Eriksson, M. Ersoy, H.J. Johansson, A tool for increasing the
lifetime of chromatography resins, MAbs 3 (2) (2011) 192–202.
[2] D.E. Cherrak, M. Al-Bokari, E.C. Drumm, G. Guiochon, Behavior of packing materials in axially compressed chromatographic columns, J. Chrom. A 943 (2002)
15–31.
[3] S.C. Siu, C. Chia, Y. Mok, P. Pattnaik, Packing of large-scale chromatography
columns with irregularly shaped glass based resins using a stop-flow method,
Biotechnol. Prog. 30 (2014) 1319–1325.
[4] T. Scharl, C. Jungreuthmayer, A. Dürauer, S. Schweiger, T. Schröder, A. Jungbauer, Trend analysis of performance parameters of pre-packed columns for
protein chromatography over a time span of ten years, J. Chrom. A 1465 (2016)
63–70.
[5] R.N. Keener III, E.J. Fernandez, J.E. Maneval, R.A. Hart, Advancement in the
modeling of pressure-flow for the guidance of development and scale-up of
commercial-scale biopharmaceutical chromatography, J. Chrom. A 1190 (2008)
127–140.
[6] J. Stickel, A. Fotopoulos, Pressure-flow relationships for packed beds of compressible chromatography media at laboratory and production scale, Biotechnol. Prog 17 (2001) 744–751.
[7] F.C. Blake, The resistance of packing to fluid flow, Trans. Amer. Inst. Chem. Engrs. 14 (1922) 415–421.
[8] J. Kozeny, Uber Kapillare Leitung Des Wassers in Boden, Sitzungsber. Akad.
Wiss. Wien. Math. Naturwiss. Kl. Abt. IIa 136 (1927) 271–306 German.
[9] R.B. Bird, W.E. Stewart, E.N Lightfoot, in: Transport Phenomena, 2nd Edition,
Wiley, New York, 2002, p. 190.
[10] H. Bak, O.R.T. Thomas, Evaluation of commercial chromatographic adsorbents
for the direct capture of polyclonal rabbit antibodies from clarified antiserum,
J. Chrom. B 848 (2007) 116–130.
[11] H. Bak, O.R.T. Thomas, J. Abildskov, Lumped parameter model for prediction of initial breakthrough profiles for the chromatographic capture of antibodies from a complex feedstock, J. Chrom. B 848 (2007)
131–141.
[12] V.B. Brochier, A. Schapman, P. Santambien, L. Britsch, Fast purification process
optimization using mixed-mode chromatography sorbents in pre-packed mini–
columns, J. Chrom. A 1177 (2008) 226–233.
[13] V.B. Brochier, H. Chabre, A. Lautrette, V. Ravault, M. Couret, A. Didierlaurent, P. Moingeon, High throughput screening of mixed-mode sorbents and optimization using pre-packed lab-scale columns for the purification of recombinant allergen rBet v 1a, J. Chrom. B 877 (2009)
2420–2427.
[14] H. Guo, X. Li, D.D. Frey, Development of chromatofocusing techniques employing mixed-mode column packing for protein separations, J. Chrom. A 1323
(2014) 57–65.
[15] E.X. Perez-Almodovar, G. Carta, IgG adsorption on a new protein A adsorbent
based on macroporous hydrophilic polymers II. Pressure–flow curves and optimization for capture, J. Chrom. A 1216 (2009) 8348–8354.
[16] R. Lide D, Concentrative Properties of Aqueous Solutions CRC Handbook of
Chemistry and Physics (2007) 2046–2620 Internet Version 2008.