Computer simulation of the isotachophoretic migration and separation of norpseudoephedrine stereoisomers with a free or immobilized neutral chiral selector
Bạn đang xem bản rút gọn của tài liệu. Xem và tải ngay bản đầy đủ của tài liệu tại đây (1.37 MB, 12 trang )
Journal of Chromatography A 1623 (2020) 461176
Contents lists available at ScienceDirect
Journal of Chromatography A
journal homepage: www.elsevier.com/locate/chroma
Computer simulation of the isotachophoretic migration and separation
of norpseudoephedrine stereoisomers with a free or immobilized
neutral chiral selector
Jitka Caslavska a, Richard A. Mosher b, Wolfgang Thormann a,∗
a
b
Clinical Pharmacology Laboratory, Institute for Infectious Diseases, University of Bern, Bern, Switzerland
RAM Software Solutions, Tucson, AZ, USA
a r t i c l e
i n f o
Article history:
Received 24 February 2020
Revised 24 April 2020
Accepted 27 April 2020
Available online 18 May 2020
Keywords:
Computer simulation
Electrophoresis
Chiral separation
Electrokinetic chromatography
Isotachophoresis
Cyclodextrin
a b s t r a c t
A detailed computer simulation study of the isotachophoretic migration and separation of norpseudoephedrine stereoisomers for cases with the neutral selector added to the leader, immobilized to the
capillary wall or support, or partially present in the separation column is presented. The electrophoretic
transport of the analytes from the sampling compartment into the separation medium with the selector,
the formation of a transient mixed zone, the separation dynamics of the stereoisomers with a free or immobilized selector, the dependence of the leader pH, the ionic mobility of norpseudoephedrine, the complexation constant and selector immobilization on steady-state plateau zone properties, and zone changes
occurring during the transition from the chiral environment into a selector free leader are thereby visualized in a hitherto unexplored way. For the case with the selector dissolved in the leading electrolyte, simulation data are compared to those observed in experimental setups with coated fused-silica capillaries
that feature minimized electroosmosis and zone detection with conductivity and absorbance detectors.
© 2020 The Author(s). Published by Elsevier B.V.
This is an open access article under the CC BY license. ( />
1. Introduction
Isotachophoresis (ITP) is performed in a discontinuous buffer
system with the sample introduced at the interface between the
two electrolytes. Upon current flow, sample components with intermediate effective mobilities compared to those of the electrolyte components of like charge separate according to differences in effective mobilities by forming a pattern of consecutive
zones or peaks between the leading zone and the terminating zone
with zone properties becoming adjusted according to the electrophoretic regulating principle. The zone pattern attains a migrating steady-state in which all zones have the same velocity
(hence the prefix isotacho) and differ in conductivity. Ideally sufficient sample is applied such that zones of constant composition are produced whose length are proportional to the amount
of the analyte present. Analytes present in trace amounts become
concentrated without forming a plateau-shaped zone and migrate
as a sharp peak within a steady-state boundary. ITP analyses can
be performed in narrow-bore plastic tubes, separation channels of
∗
Corresponding author Prof. Dr. W. Thormann, Institute for Infectious Diseases,
University of Bern, CH-3008 Bern, Switzerland
E-mail address: wolfgang.thormann@ifik.unibe.ch (W. Thormann).
rectangular cross section and fused-silica capillaries under conditions with minimized electroosmosis or in presence of electroosmosis. The electrophoretic format can be cationic, anionic or bidirectional [1-15]. In ITP, effective mobilities can be influenced via
inclusion of chemical equilibria, including protolysis (proper selection of pH and counter component) [1-15], complex formation between a counter ion and the components to be separated [16,17],
complexation of analytes with uncharged or charged additives in
the leader [18] or a charged ligand of like charge added to the terminator [19].
Enantioselective separations in capillary electrophoresis are
based on the use of chemical equilibria and have been shown
to provide high-resolution at low cost for pharmaceutical, pharmacological, agrochemical, environmental, biomedical and forensic analyses [20-25]. Most of the reported techniques are based
on capillary zone electrophoresis (CZE) to which one or several
chiral selectors, mostly cyclodextrins (CDs), is/are added to the
background electrolyte (BGE). Isotachophoretic systems can also be
used. However, only relatively few papers can be found in the literature [26-36]. Snopek et al. reported cationic capillary ITP of
the enantiomers of various drugs, including pseudoephedrine alkaloids [26] and phenothiazines [27] in presence of neutral CDs. Similarly, the separation of methadone enantiomers, including the isolation of methadone enantiomers by recycling free fluid and con-
/>0021-9673/© 2020 The Author(s). Published by Elsevier B.V. This is an open access article under the CC BY license. ( />
2
J. Caslavska, R.A. Mosher and W. Thormann / Journal of Chromatography A 1623 (2020) 461176
tinuous flow ITP, was reported by our group [28,29]. Dimethindene and pheniramine enantiomers in pharmaceuticals were analyzed by cationic ITP in presence of negatively charged carboxyethyl-β -CD [30]. Anionic capillary ITP was employed to separate
enantiomers of barbiturates [31], norleucine [32] and tryptophan
[33] in presence of neutral CDs. Furthermore, cationic ITP coupled
to microcoil NMR detection led to the characterization of enantiomeric separation and interaction between analytes and β -CD
[34,35] and inverse cationic chiral ITP configurations in presence of
sulfated β -CD provided systems in which either both enantiomers,
the enantiomer with weaker complexation or neither of the two
enantiomers of a weak base formed ITP zones [36]. In all these
cases, chiral separations occur due to the presence of the selector. The technique used is ITP but the separation mechanism is the
same as in electrokinetic chromatography [22,23].
Dynamic computer simulation of electrophoretic processes provides insight into particular experimental conditions, including
separation mechanisms of analytes. Many dynamic models of various degrees of complexity have been described in the literature [37,38]. The one-dimensional models GENTRANS [39], SIMUL5
[40] and SPRESSO [41] are mostly used and differ in certain aspects but produce identical results when employed with equal
input data [42]. The same was recently shown to be true with
the electrophoretic transport interface in the COMSOL multiphysics
software platform [43]. These approaches do not include chemical equilibria with buffer additives, conversion equilibria of solutes,
or solute interactions with column walls or filling material, and
can thus not be employed for simulating the separation of enantiomers. Dubrovcˇ áková et al. [44] presented a mathematical model
and numerical solution for the addition of a neutral complexation agent to moving boundary systems of strong electrolytes, including the migration of an ITP zone. More recently, GENTRANS
[45] and SIMUL5 [46,47] were extended with algorithms that describe 1:1 chemical equilibria between solutes and a buffer additive. These models were found to properly describe the dynamics
of chiral separations via use of complexation constants and specific mobilities of formed analyte-selector complexes and were applied to cationic ITP of methadone enantiomers in presence of 2hydroxypropyl-β -CD [45,48] and sulfated β -CD [36].
ITP has the advantage of regulating the concentration of the
analyte in the mM range and thus lends itself to concentrate
a solute [1-15]. It can be employed for isolation and identification of single enantiomers in absence of a pure chiral standard
and for the preparation of drug enantiomers from racemic mixtures on a micropreparative scale. These aspects are the focus of
ongoing research that commenced in our laboratory [28,29,36].
In the present work, two stereoisomers of norpseudoephedrine
(NPE), (+)-(1S,2S)-2-amino-1-phenyl-1-propanol ((+)-NPE, also referred to D-NPE or cathine in the literature) and (-)-(1R,2R)-2amino-1-phenyl-1-propanol ((-)-NPE, also referred to L-NPE in the
literature) were used as model compounds. Cathine is found in
khat and both NPE stereoisomers are psychostimulant drugs of
the phenethylamine and amphetamine chemical classes. They are
weak bases. The dynamics of the cationic separation of the NPE
stereoisomers was studied in situations with a free or immobilized neutral chiral selector. In analogy to the previous work with
methadone [45,48], ITP was performed with sodium and H30+ as
leading and terminating components, respectively, and acetic acid
as counter component. Heptakis(2,6-di-O-methyl)-β -cyclodextrin
(DIMEB) was added as neutral chiral selector. DIMEB was previously shown to resolve the two NPE stereoisomers by ITP [26] and
the necessary input constants for simulation were determined by
CZE in presence of various amounts of DIMEB [49].
Simulation is shown to provide detailed information about (i)
the electrophoretic transport of the analytes from the sampling
compartment into the separation medium with a neutral selector
together with the formation of a transient mixed zone, (ii) the ITP
separation dynamics of the stereoisomers with a free selector or
an immobilized selector, (iii) the dependence of the leader pH, NPE
ionic mobility, complexation constant and selector immobilization
on steady-state plateau zone properties, and (iv) ITP zone changes
occurring during the transition from the chiral environment into a
selector free leader solution. Simulation of stereoselective ITP with
an immobilized chiral selector and the behavior of ITP zones that
migrate from the selector containing region into the leader without chiral selector are presented here for the first time. For the
case of ITP in free solution, i.e. ITP with the selector dissolved in
the leading electrolyte, simulation data are compared to those observed in experimental setups with coated capillaries that feature
minimized electroosmotic flow (EOF) and zone detection with conductivity and absorbance detectors placed along the column.
2. Materials and Methods
2.1. Computer simulations
Simulations were performed with GENTRANS which comprises
algorithms to account for the interaction with an electrolyte additive [45,48]. It is assumed that these equilibria are instantaneous which means that the kinetics of complex formation do not
play a considerable role during migration. In addition to the electrophoretic mobility and the pKa values of each component in the
system, complexation constants and the mobilities of the analyteadditive complexes are used as input. The model does not take
into account the dependence of mobilities, pKa values and complexation constants on ionic strength, viscosity and temperature.
The program was executed on Windows XP or 32bit Windows 7
based PC’s featuring Intel Core2 Duo 2.93 GHz and Intel Core i5
2.8 GHz processors, respectively. If not stated otherwise, a 10 cm
column divided into 20 0 0 0 segments (5 μm mesh) with the sample being placed between 5 and 6 % of column length (boundary
width: 0.001 %) was assumed, a constant current density of 10 0 0
A/m2 was applied and EOF was omitted. Simulations for 2.5 min
electrophoresis time lasted 16-20 h. The component’s input data
for simulation are summarized in Table 1. Only NPE stereoisomers
were assumed to interact with DIMEB. The complexation constants
and mobilities for NPE stereoisomers listed in Table 1 are those
determined previously by chiral CZE in a pH 4.10 acetic acid buffer
(47 mM acetic acid adjusted with NaOH to pH 4.10) [49]. For making plots, simulation data were imported into SigmaPlot Scientific Graphing Software version 12.5 (Systat Software, San Jose, CA,
USA).
2.2. Chemicals and samples
All chemicals used were of analytical or research grade. (+)NPE and (-)-NPE as hydrochloride salts were from Fluka (Buchs,
Switzerland) whereas the free bases were purchased from Sigma
Aldrich (Buchs, Switzerland). Acetic acid was supplied from Merck
(Darmstadt, Germany). DIMEB was from Cyclolab (Budapest, Hungary). The pH of the leading electrolyte (catholyte) was adjusted
with 0.1 M acetic acid. Samples were prepared in water and did
not contain a chiral selector.
2.3. Electrophoretic instrumentation for chiral ITP and running
conditions
The ITP separation process of NPE stereoisomers was monitored
with a laboratory made system comprising a 50 μm I.D. linear
polyacrylamide (LPA) coated fused-silica capillary of 70 cm length
(Polymicro Technologies, Phoenix, AZ, USA), a purpose built sequential injection analysis manifold for fluid handling and sample
J. Caslavska, R.A. Mosher and W. Thormann / Journal of Chromatography A 1623 (2020) 461176
3
Table 1
Physico-chemical input parameters used for simulation
Compound
pKa
Mobility (10−8 m2 /Vs)
Complex constant (L/mol)
Complex mobility (10−8 m2 /Vs
Ref.
Sodium
Acetic acid
Chloride
(-)-NPE
(+)-NPE
DIMEB
4.76
8.9
8.9
5.19
4.24
7.12
2.65
2.65
1.00
44.7
66.5
-
0.442
0.554
-
c
a
b
c
a
c
c
[49]b
[49]b
With GENTRANS, DIMEB as neutral cyclodextrin is entered as a weak acid with a pKa of 14.
Complex constant and complex mobility values are those for complexation of the protonated bases with DIMEB in a 47 mM acetate buffer at pH 4.10 [49]
From database of mobilities and pKa values of SIMUL5 [40].
injection and an array of 8 contactless conductivity detectors as
is described in detail elsewhere [50]. The LPA coated capillary exhibits a low EOF (mobility of 2.34×10⁻⁹ m2 /Vs) and the manifold
allows the placement of the first detector at about 2.7 cm from
the sample inlet. The centers of the 8 detectors were positioned
2.7, 8.2, 13.2, 18.4, 23.5, 28.5, 33.5 and 38.5 cm away from the capillary’s injection end (distance between detectors was about 5 cm).
Other ITP experiments were made with an autosampler PrinCE-C
560 2-Lift (Prince Technologies, Emmen, The Netherland) at ambient temperature (about 25°C) using an LPA coated fused-silica capillary of 50 μm I.D. and 83 cm total length (Polymicro Technologies) and two detectors, a UVIS 206 PHD detector (Linear Instruments, Reno, NV, USA) operated at 200 nm and placed at 50.5 cm
(60.8 % of column length) and a TraceDec contactless conductivity detector (Innovative Sensor Technologies, Strasshof, Austria) at
61.4 cm (74.0 % of column length) This setup was previously used
for chiral ITP [48] and CZE [49]. The PrinCE autosampler was also
used with a permanently coated Guarant capillary (Alcor BioSeparations, Palo Alto, CA, USA; electroosmotic mobility of 1.23×10⁻⁹
m2 /Vs) of 50 μm I.D. and 70 cm total length and two conductivity detectors, a laboratory made high voltage contactless conductivity detector (provided by Dr. Peter Hauser, University of Basel,
Basel, Switzerland) at about 33.4 cm and a TraceDec (Innovative
Sensor Technologies) detector at about 46.3 cm. This setup was
previously used for chiral ITP of methadone [48]. Both types of the
coated capillaries used were conditioned using water and leading
electrolyte. Between runs, the capillaries were rinsed with water,
70% 2-propanol and water. Before each run the capillary was rinsed
with leading electrolyte, the sample was applied at the anodic end
via application of pressure, and the anodic end of the capillary was
dipped into the anolyte. A constant current of 2.0 or 3.0 μA, or
constant voltage of 20 kV (current < 6 μA), was applied. Detector
data were collected and stored using a 16-channel (array detector
setup) or a 4-channel (dual detector setups) e-corder (eDAQ, Denistone East, NSW, Australia).
3. Results and discussions
3.1. Isotachophoresis of NPE stereoisomers
NPE is a weak base that migrates isotachophoretically with
sodium as leading constituent, H3 0+ or β -ala as terminating ion
and acetic acid as counter component [26,50,51]. Enantioseparation is achieved in presence of DIMEB. Simulation data presented
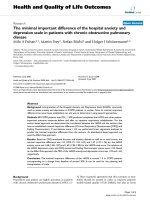
in Fig. 1 were obtained with a leading electrolyte (catholyte) composed of 10 mM NaOH, 24.6 mM acetic acid (pH 4.60) and 10 mM
DIMEB. 10 mM acetic acid (pH 3.39) with 10 mM DIMEB served
as terminating electrolyte (anolyte). The sample was composed of
2.85 mM of each NPE base and did not contain other components.
With the interaction between NPE and DIMEB, simulation predicts
a separation of the NPE stereoisomers between sodium and the
Kohlrausch adjusted acetic acid solution (Fig. 1A). (-)-NPE with the
lower complexation constant is forming an isotachophoretic zone
Figure 1. Computer predicted separation of NPE stereoisomers utilizing a pH 4.60
leading electrolyte (catholyte) composed of 10.0 mM NaOH, 24.6 mM acetic acid
and 10 mM DIMEB. A mixture of 10.0 mM acetic acid and 10 mM DIMEB served
as terminating electrolyte (anolyte). The sample comprised (+)-NPE and (-)-NPE
as bases (2.85 mM each) without any other compounds. The simulation was performed at a constant current density of 10 0 0 A/m2 and without any EOF. (A) Computer predicted NPE (red line graphs), acetic acid, sodium and DIMEB concentration
profiles after 1 min and initial distributions (insert). (B) pH and conductivity profiles after 1 min and initial distributions (insert). -NPE and +NPE refer to (-)-NPE
and (+)-NPE, respectively.
between sodium, the leading ion, and (+)-NPE because its net mobility is larger compared to that of (+)-NPE and smaller than that
of sodium. (+)-NPE produces an isotachophoretic zone which migrates between that of (-)-NPE and the adjusted acetic acid zone
with H3 0+ as terminating ion. This is comparable to the behavior
of the methadone enantiomers in presence of hydroxypropyl-β -CD
as reported previously [45,48]. The concentration of acetic acid in
the adjusted terminating zone (30.87 mM) is higher compared to
that in the leader (24.6 mM) and the 10 mM applied as anolyte
4
J. Caslavska, R.A. Mosher and W. Thormann / Journal of Chromatography A 1623 (2020) 461176
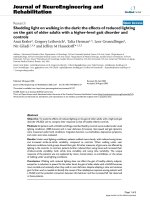
Figure 2. Computer predicted (A) analyte profiles (lower graphs), DIMEB distributions (red line graphs) and conductivity profiles (upper graphs) at 0, 0.05, 0.10, 0.15, 0.20,
0.25, 0.30, 0.35, 0.40, 0.45 and 0.50 min of power application, and (B) detector profiles for absorbance (lower graphs) and conductivity (upper graphs) for detectors placed at
0.75, 1.00, 1.25, 1.75, 2.00, 2.25 and 2.50 cm of column length. Simulation conditions as for Fig. 1. -NPE, +NPE and M refer to (-)-NPE, (+)-NPE and mixed zone, respectively.
(Fig. 1A). Furthermore, zone conductivities and pH values of the
NPE zones are predicted to be between those of the adjusted terminating zone (28.3 mS/m; 3.14) and the leader (92.0 mS/m, 4.60)
(Fig. 1B). The NPE zones are characterized with sharp front and
rear boundaries and the rear boundary features a conductivity dip
which is comparable to previously described cationic ITP configurations with H3 0+ as terminating ion [45,48].
The formed (-)-NPE and (+)-NPE sample zones not only differ in the plateau concentration (5.64 vs. 5.33 mM, respectively),
pH (4.33 vs. 4.31), conductivity (36.0 vs. 33.4 mS/m), acetic acid
concentration (20.9 vs. 20.7 mM) and ionic strength (5.69 vs. 5.38
mM), but also in the concentration of DIMEB (10.35 vs.10.57 mM).
DIMEB is neutral and does not migrate under the influence of the
electric field. The DIMEB increase inside the ITP zones compared to
its value in the leading and terminating electrolytes is due to the
migration of the charged complexes and was previously reported
for the interaction of a neutral cyclodextrin with strong electrolytes
[44] and the weak base methadone [48]. The increase of a neutral CD within the ITP zones of various pharmaceutical compounds
could be experimentally visualized with on-line microcoil NMR detection [52]. For migrating analytes in CZE that interact with the
selector, CD concentration deviations from its value in the buffer
were also predicted with dynamic simulation [45] and a generalized model of the linear theory of electromigration [49,53]. An
increase of CD inside the migrating analyte zone could be experimentally validated using a neutral CD with absorbance at 245 nm
together with a non-absorbing analyte [53]. In absence of complexation, there is no DIMEB change and no separation, and the
adjusted total NPE concentration in the investigated ITP system is
6.84 mM. For the data of Fig. 1 obtained with a 10 cm column
and a constant 10 0 0 A/m2 , the predicted voltage increased from
the initial 1544 V to 1806, 2218 and 3456 V within 0.5, 1.0 and 2.5
min of current flow, respectively.
3.2. Separation process
Separation in ITP proceeds via migrating transient mixed zones
which are formed according to the regulating principle [9-15]. For
the example of Fig. 1, this is illustrated with the simulation data
presented in Fig. 2. The properties of the mixed zone, including its
conductivity, are distinctly different to the properties of the pure
zones of (-)-NPE and (+)-NPE which are gradually formed in front
of and behind the mixed zone, respectively (Fig. 2A). The mixed
zone becomes smaller with time and vanishes when the separation
of the two stereoisomers is completed (lower graphs in Fig. 2A).
For the presented case, separation is predicted to become complete
shortly after 0.4 min of current application (Fig. 2A). At 0.4 min the
boundary between the stereoisomers has not yet reached a steadystate shape. It is distinctly broader compared to the boundary predicted after 0.45 min and 0.50 min. Once steady-state is reached,
the separated stereoisomers continue to migrate as a steady-state
migrating zone pattern.
The conductivity (34.6 mS/m) and the DIMEB concentration
(10.47 mM) of the mixed zone are predicted to be between the
conductivities and DIMEB concentrations of the pure zones (red
and upper graphs in Fig. 2A). The separation can be followed with
J. Caslavska, R.A. Mosher and W. Thormann / Journal of Chromatography A 1623 (2020) 461176
multiple detectors placed along the separation column. The simulation data presented in Fig. 2B were generated for UV absorbance
(lower graphs representing the sum of the NPE concentrations) and
conductivity (upper graphs) with detectors placed at 0.75, 1.00,
1.25, 1.75, 2.00, 2.25 and 2.50 cm of column length (from left to
right, respectively). Data storage occurred at 20 Hz. It is important
to note that this frequency was too low to monitor the sharp conductivity dip at the interface between (+)-NPE and the adjusted
terminator zone (see conductivity profiles in Fig. 1B and 2A). It enabled, however, the prediction of the transient mixed zone and the
formation of the two NPE ITP zones as would be observed by absorbance and conductivity detection along the column.
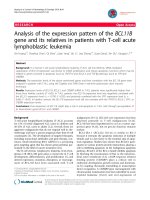
For validation, the separation of (-)-NPE and (+)-NPE was monitored with a purpose made instrument featuring 8 contactless conductivity detectors along a 70 cm LPA coated capillary which exhibits a low EOF towards the cathode. This approach was previously employed to study the formation of the leader/terminator
boundary in absence of the sample as well as the formation of
an ITP zone of NPE in absence of the chiral selector [50]. In analogy to these efforts, the separation of the two stereosisomers was
simulated with a 17.5 cm separation space divided into 350 0 0 segments of equal length ( x = 5.0 μm) and a constant current density of 370 A/m2 . Sample was applied at the anodic capillary end
as a plug with a length of 2.5 % of column length (initially placed
between 5.0 and 7.5 % of column length) and a boundary width
of 0.02 % (for distribution, see lower insert in Fig. 3A). For 10 min
of electrophoresis, this required a simulation time of about 30 h.
The compositions of the leading and terminating electrolytes as
well as that of the sample were the same as for the simulation
example presented in Fig. 1 and the input data used were those
of Table 1. Furthermore, in order to mimic the temporal behavior
of the EOF present in the experiment, the ionic strength dependent EOF model employed previously for this ITP system without
chiral selector (for details refer to [50]) was applied. The predicted
detector profiles for the 8 detectors (4 Hz data that do not show
the conductivity dip) are depicted in Fig. 3A. They illustrate the
expected separation process as discussed with the data of Fig. 2A
and 2B. The voltage is predicted to increase from 1056 to 2543 V
within the 10 min time interval (solid line graph in upper insert
of Fig. 3A). The EOF increases from 25.5 to 64.7 μm/s (dashed line
graph in upper insert of Fig. 3A) and is significantly smaller compared to the electrophoretic transport rate of 211.0 μm/s reported
in Ref. [50]. The predicted net transport thus increases from 236.5
to 275.7 μm/s.
Experimental data obtained under a constant current of 3 μA
are presented in Fig. 3B. The existence of the mixed zone and the
gradual decrease of its length could thereby be experimentally verified. Experimentally monitored detector profiles of detectors 2 to
7 correspond qualitatively well with those predicted by simulation.
For the chosen conditions under constant current density, the voltage is predicted to increase in a similar fashion as was predicted
by simulation (compare voltage graphs in upper insert of Fig. 3A
with insert of Fig. 3B).
For the first detector (D1 of Fig. 3) and the transition marked
with asterisk detected with the second detector (D2), the predicted
detector profiles are somewhat different compared to those monitored experimentally. It was previously noted that sample injection
in the employed SIA setup did not provide sharp initial boundaries
[50]. Broader initial boundaries between sample and its surrounding electrolytes (L and T on cathodic and anodic side, respectively)
were found to have an impact on the predicted detector signal of
the first detector and the buffer transition of the second detector marked with an asterisk in Fig. 3. This is illustrated with the
data of Fig. 3C which were obtained with dispersed initial sample
boundaries (lower inset in Fig. 3C) which were produced from the
initial distribution of Fig. 3A via application of Taylor-Aris disper-
5
Figure 3. (A,C) Simulated and (B) experimental conductivity electropherograms of
detectors D1 to D8 for detection of the NPE stereoisomer separation under constant
current conditions in an LPA coated fused-silica capillary. The leading electrolyte (L,
catholyte) was composed of 10 mM NaOH, 24.6 mM acetic acid and 10 mM DIMEB.
The terminating electrolyte (T, anolyte) was 10 mM acetic acid. Simulations were
performed with an ionic strength dependent EOF model using (A) sample boundaries with a width of 0.02 % and (C) dispersed initial sample boundaries. For details
refer to text. The inserts in panels A and C comprise the initial distributions (lower
graphs, with D for DIMEB) and the computer predicted temporal behavior of voltage V (V, left y-axis scale), current density I (A/m2 , left y-axis) and EOF (μm/s, right
y-axis scale) depicted as upper graphs. The insert in panel B represents recorded
current (μA) and voltage (kV). The asterisk marks the transition between adjusted
terminator (T∗ ) and the terminating electrolyte (T) and represents the EOF marker.
sion in a 50 μm ID capillary at a flow rate of 1.5 mm/s for 0.5 min
(for impact of flow on dispersion refer to [54]). Better agreement
between experimental and simulation data for detector D1 and for
the buffer transition of detector D2 was thereby predicted.
3.3. Formation and composition of the mixed zone
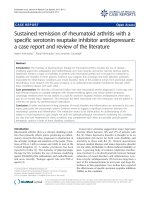
For the example presented in Fig. 2, the mixed zone is characterized with a higher concentration of (+)-NPE (2.83 mM), the
stereoisomer which has a stronger interaction with DIMEB, compared to (-)-NPE (2.64 mM). This is comparable to the separation
6
J. Caslavska, R.A. Mosher and W. Thormann / Journal of Chromatography A 1623 (2020) 461176
Figure 4. Computer predicted concentrations of (+)-NPE (bottom panels), (-)-NPE (second panels from bottom), DIMEB and chloride (second panels from top) and conductivity distributions (top panels) for NPE analytes sampled (A) as free bases and (B) as hydrochlorides. Profiles shown are for 0 min (dark red graphs), 0.015 min (orange graphs),
0.030 min (yellow graphs) and 0.045 min (green graphs) of current flow. The asterisks mark the property levels of the mixed zone. Other conditions as for Fig. 1 and 2.
of methadone enantiomers described previously [48] and appears
to be typical for separations in which complexation with a neutral
CD is involved. It is important to note that with an equimolar mixture of two weak bases and separation of these bases in absence
of complexation, an equimolar mixed zone would be formed.
Simulation also revealed that the composition of the formed
mixed zone is independent of the sample composition. This is illustrated with the concentration and conductivity data presented
in Fig. 4. Profiles of the initial distributions and those after 0.015,
0.030 and 0.045 min (0.9, 1.8 and 2.7 s, respectively) of current
flow at a current density of 10 0 0 A/m2 are depicted. These data
illustrate the transients occurring after application of power and
the formation of the mixed zone (property levels marked with
asterisks in Fig. 4) outside the sampling section. Data presented
are those for the two NPE stereoisomers sampled as weak bases
(Fig. 4A, case of Fig. 1 and 2 with 2.85 mM of each) and as hydrochlorides (Fig. 4B, 2.85 mM of each stereoisomer together with
5.7 mM chloride). Note that the samples did not contain buffer
components and DIMEB, and were applied between 0.5 and 0.6 cm.
Upon current flow, the transition from the sampling to the separation column (at 0.6 cm) is characterized with transient NPE
peaks that occur at the cathodic interface with the leader where
NPE becomes complexed with DIMEB and where NPE reaches a
region of higher conductivity (lower electric field strength). It is
also the location where the migrating steady-state front boundary
is formed due to the cathodic migration of the leading ion (Na+ ).
J. Caslavska, R.A. Mosher and W. Thormann / Journal of Chromatography A 1623 (2020) 461176
7
Figure 5. (A,C) Computer predicted detector profiles for a detector placed at 5 cm of column length measuring absorbance (sum of NPE concentrations) and conductivity
(shifted by 0.08 min for presentation purposes) and (B,D) experimental data obtained with the setup featuring an LPA capillary with absorbance (200 nm) and conductivity
detection for ITP systems with leading electrolyte pH values of (A,B) 4.60 and (C,D) 4.30. Simulation and experimental data were obtained with NPE stereoisomers (2.85 mM
each) sampled as hydrochlorides. Other simulation conditions as described in the text. In the experiments, sample application occurred at 80 mbar for 0.3 min and the run
was performed at a constant 2 μA (voltage change between about 3 and 21 kV). -NPE, +NPE, L and T∗ refer to (-)-NPE, (+)-NPE, leading electrolyte and adjusted terminator,
respectively.
In absence of chloride in the sample, NPE is predicted to completely migrate from the sampling compartment into the separation column within 0.030 min (Fig. 4A). Due to chloride, which migrates in the opposite direction and strongly influences local conductivity, NPE requires more than 0.045 min to become completely
transported into the separation column (Fig. 4B). After about 0.15
min of current flow, profiles of (+)-NPE, (-)-NPE and the mixed
zone of the two investigated cases become indistinguishable (data
not shown). These data illustrate how simulation can be used to
provide insight into the processes occurring due to electrophoretic
transport of a given electrolyte distribution.
3.4. Impact of input data and comparison to experimental results
Simulated detector profiles of the isotachophoretic zones of ()-NPE and (+)-NPE predicted for detection with a UV absorbance
detector and a conductivity detector are presented in Fig. 5A.
The data correspond to a detector location at 5 cm of column
length (center of the column; 20 Hz signal) and the conditions
of Fig. 1 with a leader pH of 4.6. The absorbance data represent
the sum of the NPE concentrations. For presentation purposes, the
conductivity data are depicted with a time shift of 0.08 min. Black
line graphs are obtained with the input data of Table 1. These data
are in qualitative agreement with those monitored experimentally
using the setup with an LPA coated fused-silica capillary interfaced
with a UV absorbance and a conductivity detector that were placed
about 11 cm apart (Fig. 5B, cf. Section 2.3). In an effort to find optimized input data for ITP, the mobility of the free NPE molecule was
varied. An increase in the free mobility value resulted in increased
NPE concentrations in the formed ITP zones and thus somewhat
shorter zones. This is illustrated with the simulated absorbance
data for mobilities of 2.65×10⁻⁸ m2 /Vs (black graph), 2.85×10⁻⁸
m2 /Vs (blue graph) and 3.05×10⁻⁸ m2 /Vs (red graph) presented in
Fig. 5A.
Best agreement between computer predicted and measured
conductivity distributions was obtained using an NPE free mobility of 2.85×10⁻⁸ m2 /Vs (blue graph in Fig. 5A) instead of the
2.65×10⁻⁸ m2 /Vs (black graph in Fig. 5A). A free mobility of
3.05×10⁻⁸ m2 /Vs resulted in data with a too high conductivity
within the NPE zones (red graph in Fig. 5A). Variation of the input
data for complexation of NPE with DIMEB has only a minor impact
on the distributions of conductivity and other properties and is in
analogy to the case of methadone discussed previously [48]. For
NPE, this is illustrated with the gray line graph of Fig. 5A which
was obtained with a different set of input data. The complexation
constants for (-)-NPE and (+)-NPE were 54.4 L/mol and 76.3 L/mol,
respectively, and the complex mobilities 0.853×10⁻⁸ m2 /Vs and
0.887×10⁻⁸ m2 /Vs, respectively. The free mobility of NPE used for
this simulation was that listed in Table 1. These data illustrate that
the mobility value determined by CZE at a pH 4.10 and an ionic
8
J. Caslavska, R.A. Mosher and W. Thormann / Journal of Chromatography A 1623 (2020) 461176
Figure 6. Experimental data of separated NPE stereoisomers having leading electrolyte pH values of (A) 4.60 and (B) 4.30 obtained in the setup with a Guarant capillary and
two conductivity detectors (y-axis scales of first and second detector are on the left and on the right, respectively). Sample application occurred at 80 mbar for 0.3 min and
experiments were performed at a constant 20 kV. Key as for Fig. 5.
strength of 8.58 mM [49] are close but somewhat too low for the
conditions encountered in ITP. Temperature or ionic strength differences might contribute to this fact.
In order to gain further insight into the validity of a higher free
mobility for NPE, the ITP system was changed by lowering the pH
of the leader to 4.30. Simulation data obtained with a leader composed of 10 mM NaOH, 40 mM acetic acid and 10 mM DIMEB are
presented in Fig. 5C and corresponding experimental data are depicted in Fig. 5D. As is the case with a leader pH of 4.60 (Fig. 5A
and 5B), a mobility of 2.85×10⁻⁸ m2 /Vs (blue graph in Fig. 5C)
provides a good match with the experimental conductivity data.
With a mobility of 2.65×10⁻⁸ m2 /Vs (black graph in Fig. 5C), the
predicted conductivities of the two NPE zones are lower compared
to those monitored experimentally. The calculated conductivity of
the (+)-NPE zone is even lower compared to that of the adjusted
terminating zone (zone T∗ ). With a mobility of 3.05×10⁻⁸ m2 /Vs
(red graph in Fig. 5C), the predicted conductivities of the two
NPE zones are higher compared to those measured experimentally. These data illustrate that a free NPE mobility of 2.85×10⁻⁸
m2 /Vs provides simulation data that compare well with experimental isotachopherograms obtained at different pH values of the
leader.
In addition to the experimental setup with an LPA coated capillary together with absorbance and conductivity zone detection
(Fig. 5B and 5D), a setup with a permanently coated Guarant capillary and two conductivity detectors placed about 13 cm apart (cf.
Section 2.3) was used to follow and characterize the NPE ITP zones
in presence of 10 mM DIMEB and application of constant voltage instead of constant current. The second conductivity detector
is the same as that employed together with absorbance detection.
Data obtained with leader pH values of 4.6 and 4.3 are presented
in Fig. 6A and 6B, respectively. In both cases, the conductivities of
the NPE zones detected with the second detector were lower compared to those monitored with the first detector. The same was
found to be true for the case of methadone enantiomer detection
reported previously [48]. The reason for this change is unknown
and was not further investigated. It is interesting to mention that
such a change was not observed with the conductivity array detector under both constant current (Fig. 3B) and constant voltage
(data not shown) conditions.
3.5. Immobilization of the chiral selector
Neutral CDs can also be immobilized, i.e. bound to the inner
wall of a capillary, to particles used as capillary packing material, to a monolith present in the capillary, or to nanoparticles
which are dispersed in the running buffer. These approaches are
referred to as open-tubular, packed, monolithic and pseudostationary phase capillary electrochromatography (CEC), respectively,
and have been applied to separations in uniform background electrolytes [56,57]. In analogy to the CEC simulations in a uniform
buffer presented previously for the separation of enantiomers of
a weak base [55], computer simulation was employed to study the
isotachophoretic migration of (+)-NPE and (-)-NPE in presence of
immobilized DIMEB. The impact of the 1:1 interaction between
NPE and DIMEB was simulated by setting the complex mobilities
and the mobility of DIMEB (which is used for the calculation of
the diffusion coefficient) to zero. All other input parameters listed
in Table 1, including the complexation constants, were assumed to
be identical to those in free solution. This provides data that mimic
migration and separation with the chiral selector being immobilized to the capillary wall or support material and without unspecific interactions between analytes and the chiral stationary phase.
Data predicted for the system of Fig. 1 with immobilized DIMEB
are presented in Fig. 7.
The simulation data given in Fig. 7 reveal that the formation
of ITP zones of the NPE stereoisomers are predicted also for the
case of DIMEB immobilization. This is the first account for ITP
of stereoisomers in presence of an immobilized selector. The data
presented in Fig. 7A indicate that the separation of (+)-NPE and
(-)-NPE proceeds in the same manner as is the case for free solution (compare with Fig. 2A). Separation, however, is predicted to
be faster when DIMEB is immobilized (about 0.30 min with immobilized DIMEB vs. about 0.45 min in the case of Fig. 2A). The
electrophoretic displacement rates are identical as this transport
rate is determined by the components of the leading electrolyte,
i.e. compounds that were assumed not to interact with DIMEB, and
the current density [50]. Acetic acid was reported to exhibit a very
weak interaction with DIMEB [58] which does not have an appreciable impact on the displacement rate and the formation of the
migrating NPE zone (simulation data not shown).
All properties of the formed ITP zones are somewhat lower
compared to those predicted for the case of free solution. The
plateau concentrations of (-)-NPE and (+)-NPE are 5.40 and 4.91
mM, respectively (5.64 and 5.33 mM for free solution), the pH values are 4.31 and 4.26, respectively (4.33 and 4.31), the conductivities are 34.02 and 30.32 mS/m, respectively (36.0 and 33.4 mS/m)
and the acetic acid concentrations are 20.75 and 20.49 mM, respectively (20.9 and 20.7 mM). The concentration of DIMEB remains 10 mM (no change because DIMEB is immobilized, Fig. 7A
and 7B) which is in contrast to the case of free solution (10.35 and
10.57 mM). Furthermore, analyte transition between sample compartment and separation column is essentially identical to that described in Fig. 4A (data not shown). Experimental validation of the
J. Caslavska, R.A. Mosher and W. Thormann / Journal of Chromatography A 1623 (2020) 461176
9
Figure 7. Computer predicted NPE stereoisomer separation in presence of 10 mM immobilized DIMEB along the separation column and otherwise identical conditions as for
Fig. 1. For details refer to text. (A) Analyte profiles (lower graphs), DIMEB distribution (red line graph) and conductivity profiles (upper graphs) at 0, 0.05, 0.10, 0.15, 0.20,
0.25, 0.30, 0.35, 0.40, 0.45 and 0.50 min of application of a constant 10 0 0 A/m2 . (B) Concentration distributions of all components (NPE stereoisomers as red line graphs)
after 0.5 min. (C) Conductivity and pH profiles after 0.5 min. Key as for Figs. 1 and 2.
predicted zone structure, e.g. via open-tubular CEC, remains to be
undertaken.
3.6. Partial filling of column with chiral selector
Simulation was also used to study the analyte behavior at the
rear end of a DIMEB zone, i.e. a situation with partial filling of the
column with DIMEB. This includes a region where ITP zones leave
the environment with complexation, is relevant for off-column
analyte detection, e.g. with mass spectrometry (MS), and is described here for the first time via the dynamics of migrating analyte zones. Simulation data for a column with DIMEB up to 5 cm
of column length, a sample composed of NPE stereoisomers applied as hydrochlorides, and otherwise identical column conditions
as for Fig. 1 are presented in Fig. 8. Within the DIMEB segment,
(-)-NPE and (+)-NPE were predicted to become separated within
about 0.45 min and to migrate isotachophoretically as consecutive
zones up to the end of the segment with DIMEB (Fig. 8). The front
boundary of the (-)-NPE ITP zone reached the vanishing DIMEB
gradient shortly after 1.25 min. Upon leaving complexation, both
stereoisomers become concentrated to 6.84 mM and jointly form a
migrating ITP zone of uniform conductivity (46.97 mS/m, see 1.50
min time point of Fig. 8). Acetate concentration and pH within this
zone are also uniform (21.78 mM and 4.42, respectively; profiles
not shown). This ITP zone exhibits a non-uniform distribution of
the two analytes. (-)-NPE is still migrating ahead of (+)-NPE and
the two stereoisomers will become mixed with time (Fig. 9A). It is
important to realize that the migration rate of the newly formed
ITP zone remains equal to that of the pattern within the DIMEB
zone. It is noteworthy to mention that DIMEB is present in solution. It has a higher value than 10 mM in the ITP zones (see 0.25
to 1.25 min profiles depicted as red line graphs of Fig. 8) and the
mixed zone (see 0.25 min profile of Fig. 8). As a result of diffusion
the DIMEB gradients at 5 cm of column length and at the edges of
the sample compartment (0.5 and 0.6 % of column length) broaden
with time.
The processes occurring during the migration of the ITP zones
across the DIMEB boundary at 5 cm of column length and thereafter is depicted in Fig. 9. It represents a situation in which DIMEB
is immobilized with a boundary width of 0.01 %. DIMEB is therefore invariant and present as non-diffusing gradient at its zone
edge. Within the immobilized DIMEB segment, the NPE stereoisomers were predicted to become separated within about 0.30 min
(Fig. 7A) and to migrate isotachophoretically as consecutive zones
up to the end of the segment with immobilized DIMEB (Fig. 9A).
The front boundary of the (-)-NPE ITP zone reached the interface shortly before 1.30 min (Fig. 9A and 9B). The stereoisomers
leave the section containing the chiral selector within a short time
(about 0.05 min, see broken line graphs in Fig. 9A and data of
Fig. 9B and 9C). Both become concentrated to 6.84 mM and jointly
form a migrating ITP zone of uniform conductivity (Fig. 9A). Initially, this ITP zone exhibits a non-uniform distribution of the
stereoisomers. (-)-NPE is still migrating ahead of (+)-NPE (see 1.35
min distribution in Fig. 9A). With time and upon continued application of power, the interface between the two becomes broader
due to diffusion (see 1.50 to 2.50 min time points of Fig. 9A).
A uniform ITP zone with a concentration of 3.42 mM of each
stereoisomer is eventually formed (data not shown). For both NPE
10
J. Caslavska, R.A. Mosher and W. Thormann / Journal of Chromatography A 1623 (2020) 461176
Figure 8. Computer predicted distributions of the NPE stereoisomers, DIMEB (red line graphs) and conductivity while the NPE ITP zones migrate within the leader zone
containing DIMEB (up to 5 cm of column length, 0 to 1.25 min at 0.25 min interval) and thereafter (1.50 min). The two NPE stereoisomers were applied as hydrochlorides.
Other conditions and key are identical as those of Figs. 1 and 2.
Figure 9. Computer predicted stereoisomer and conductivity distributions while and after the NPE ITP zones migrate across the end of immobilized DIMEB at 5 cm of
column length. (A) NPE concentration profiles (lower graphs), DIMEB distribution (red line graph) and conductivity profiles (upper graphs) between 1.0 and 2.5 min (0.25
min interval) of power application. (B) (-)-NPE and (C) (+)-NPE concentration profiles in the transition region with vanishing DIMEB predicted for 1.280 to 1.350 min at an
interval of 0.005 min. Other conditions and key as for Fig. 7.
analytes, the transition between the column segment with immobilized DIMEB to that without DIMEB is characterized with first
a decrease in concentration followed by an increase to 6.84 mM
(Fig. 9B and 9C, NPE profiles between 1.280 and 1.350 min at
an interval of 0.005 min). The former effect is more pronounced
for (+)-NPE, the stereoisomer with stronger complexation. Comparable data were obtained for the case of free solution (Fig. 8,
detailed profiles not shown). All these data suggest that analyte
detection should occur shortly after the segment with the chiral
selector.
J. Caslavska, R.A. Mosher and W. Thormann / Journal of Chromatography A 1623 (2020) 461176
4. Conclusions
For two NPE stereoisomers as model compounds, simulated
zone patterns for the case of cationic ITP in free solution with
DIMEB as selector were found to compare qualitatively well with
those monitored experimentally with conductivity and absorbance
detectors placed along coated capillaries. Stereoisomer separation
was followed with an array of 8 conductivity detectors and occurs due to the presence of the selector. The technique used is
ITP but the separation mechanism involved is the same as in electrokinetic chromatography. The separation of the NPE stereoisomers could also be simulated in presence of immobilized DIMEB,
an approach that is reported here for the first time and remains to
be experimentally validated. Compared to ITP in free solution, immobilization resulted in zone properties, including NPE concentrations, conductivity and pH, that were somewhat lower. The lower
plateau concentrations of the analytes suggest that it is preferable
to use a free rather than an immobilized neutral selector for ITP.
Column preparation and the possibility for a rapid change of the
separating medium are other advantages associated with a free selector. Finally, simulation provided insight into the migration behavior of ITP zones that migrate across a vanishing selector edge
(end of selector zone) into the leader without chiral selector. In
this process, NPE zones become concentrated and form a migrating
ITP zone of uniform conductivity in which the two stereoisomers
first migrate one after the other and then slowly become mixed
due to diffusion. This is the first time that this process was elucidated and visualized. The simulation data reveal that highest sensitivity for analyte detection is obtained when the detector is placed
immediately after the end of the selector zone. This is important
for analyte detection with MS when the selector should not enter
the detection system. Partial filling of the column with the selector
is otherwise not an appealing approach for ITP. Simulation represents an elegant and efficient way to provide insight into the formation of transient analyte profiles, boundaries and zones in ITP
with complexation, decomplexation and diffusional remixing outside the selector zone.
Author statement
Jitka Caslavska: Experimental work, data analysis, figure preparation, manuscript reviewing
Richard A. Mosher: Software development, programming, debugging, manuscript reviewing
Wolfgang Thormann: Conceptualization, funding acquisition,
simulations, manuscript writing
Declaration of Competing Interest
The authors have declared no conflict of interests.
Acknowledgments
Discussions with Dr. Peter C. Hauser and the technical assistance of Israel Joel Koenka provided during the generation of the
conductivity array detector data are gratefully acknowledged. This
work was partly supported by the Swiss National Science Foundation.
References
[1] F.M. Everaerts, J.L. Beckers, Th.P.E.M. Verheggen, Isotachophoresis, Elsevier, Amsterdam, 1976.
[2] W. Thormann, Principles of isotachophoresis and dynamics of the isotachophoretic separation of 2 components, Sep. Sci. Technol. 19 (1984) 455–467.
[3] P. Bocˇ ek, M. Deml, P. Gebauer, V. Dolník, Analytical Isotachophoresis, VCH,
Weinheim, 1988.
11
[4] P. Gebauer, P. Bocˇ ek, Zone order in isotachophoresis - The concept of the zone
existence diagram and its use in cationic systems, J. Chromatogr 267 (1983)
49–65.
[5] W. Thormann, R.A. Mosher, Theory of electrophoretic transport and separations: The study of electrophoretic boundaries and fundamental separation principles by computer simulation, Adv. Electrophoresis 2 (1988) 45–
108.
[6] R.A. Mosher, D.A. Saville, W. Thormann, The Dynamics of Electrophoresis, VCH
Publishers, Weinheim, 1992.
[7] T. Hirokawa, K. Watanabe, Y. Yokota, Y. Kiso, Bidirectional isotachophoresis
1. Verification of bidirectional isotachophoresis and simultaneous determination of anionic and cationic components, J. Chromatogr. 633 (1993) 251–
259.
[8] J. Caslavska, W. Thormann, Bidirectional isotachophoresis in open-tubular, untreated fused-silica capillaries, J. Chromatogr. A 772 (1997) 3–17.
[9] G. Brouwer, G.A. Postema, Theory of separation in displacement electrophoresis, J. Electrochem. Soc. 117 (1970) 874–878.
[10] P. Bocˇ ek, M. Deml, B. Kaplanová, J. Janák, Analytical isotachophoresis concept
of separation capacity, J. Chromatogr 160 (1978) 1–9.
[11] F.E.P. Mikkers, F.M. Everaerts, J.A.F. Peek, Isotachophoresis - Concepts of resolution, load-capacity and separation efficiency, J. Chromatogr 168 (1979)
293–315.
[12] F.E.P. Mikkers, F.M. Everaerts, J.A.F. Peek, Isotachophoresis - Concepts of resolution, load-capacity and separation efficiency 2. Experimental evaluation, J.
Chromatogr. 168 (1979) 317–332.
[13] W. Thormann, D. Arn, E. Schumacher, Monitoring of the isotachophoretic separation of 2 components with an array detector, Sep. Sci. Technol. 19 (1984)
995–1011.
[14] T. Hirokawa, K. Nakahara, Y. Kiso, The separation process in isotachophoresis 2.
Binary-mixtures and transient state models, J. Chromatogr. 463 (1989) 51–71.
[15] T. Hirokawa, K. Nakahara, Y. Kiso, Separation process in isotachophoresis 3.
Transient state models for a 3-component system, J. Chromatogr. 470 (1989)
21–41.
[16] P. Bocˇ ek, I. Miedziak, M. Deml, J. Janák, Use of complex-formation equilibria
in analytical isotachophoresis of strong electrolyte ions - separation of halides
and sulfates, J. Chromatogr 137 (1977) 83–91.
[17] I. Nukatsuka, M. Taga, H. Yoshida, Separation of lanthanides by capillary-tube
isotachophoresis using complex-forming equilibria, J. Chromatogr 205 (1981)
95–102.
[18] I. Jelínek, J. Snopek, E. Smolková-Keulemansová, Use of cyclodextrins in isotachophoresis 2. Alpha-cyclodextrins, beta-cyclodextrins and gamma-cyclodextrins as leading electrolyte additives for the separation of ortho-substituted,
meta-substituted and para-substituted halogenobenzoic acids, J. Chromatogr.
411 (1987) 153–159.
[19] P. Gebauer, P. Bocˇ ek, M. Deml, J. Janák, Isotachophoresis of kinetically labile
complexes, J. Chromatogr 199 (1980) 81–94.
[20] J. Snopek, I. Jelínek, E. Smolková-Keulemansová, Chiral separation by analytical
electromigration methods, J. Chromatogr 609 (1992) 1–17.
[21] S. Fanali, Identification of chiral drug isomers by capillary electrophoresis, J.
Chromatogr. A 735 (1996) 77–121.
[22] B. Chankvetadze, Capillary Electrophoresis in Chiral Analysis, John Wiley &
Sons, Chichester, 1997.
[23] B. Chankvetadze, Contemporary theory of enantioseparations in capillary electrophoresis, J. Chromatogr. A 1567 (2018) 2–25.
[24] S. Zaugg, W. Thormann, Enantioselective determination of drugs in body fluids
by capillary electrophoresis, J. Chromatogr. A 875 (20 0 0) 27–41.
[25] J. Caslavska, W. Thormann, Stereoselective determination of drugs and metabolites in body fluids, tissues and microsomal preparations by capillary electrophoresis (20 0 0-2010), J. Chromatogr. A 1218 (2011) 588–601.
[26] J. Snopek, I. Jelínek, E. Smolková-Keulemansová, Use of cyclodextrins in isotachophoresis 4. The influence of cyclodextrins on the chiral resolution of
ephedrine alkaloid enantiomers, J. Chromatogr. 438 (1988) 211–218.
[27] I. Jelínek, J. Dohnal, J. Snopek, E. Smolková-Keulemansová, Use of cyclodextrins
in isotachophoresis 7. Resolution of structurally related and chiral phenothiazines, J. Chromatogr. 464 (1989) 139–147.
[28] M. Lanz, J. Caslavska, W. Thormann, Enantiomeric separation of methadone by
cyclodextrin-based capillary and recycling isotachophoresis, Electrophoresis 19
(1998) 1081–1090.
[29] P. Hoffmann, H. Wagner, G. Weber, M. Lanz, J. Caslavska, W. Thormann, Separation and purification of methadone enantiomers by continuous- and interval-flow electrophoresis, Anal. Chem. 71 (1999) 1840–1850.
[30] P. Kubacˇ ák, P. Mikuš, I. Valášková, E. Havránek, Chiral separation of alkylamine
antihistamines in pharmaceuticals by capillary Isotachophoresis with charged
cyclodextrin, Drug Dev. Ind. Pharm. 33 (2007) 1199–1204.
[31] S. Zaugg, J. Caslavska, R. Theurillat, W. Thormann, Characterization of the stereoselective metabolism of thiopental and its metabolite pentobarbital via analysis of their enantiomers in human plasma by capillary electrophoresis, J. Chromatogr. A 838 (1999) 237–249.
˝
[32] D. Kaniansky, E. Šimunicˇ ova, E. Olvecká,
A. Ferancová, Separations of enantiomers by preparative capillary isotachophoresis, Electrophoresis 20 (1999)
2786–2793.
˝
[33] E. Olvecká,
M. Masar, D. Kaniansky, M. Jöhnck, B. Stanislawski, Isotachophoresis separations of enantiomers on a planar chip with coupled separation channels, Electrophoresis 22 (2001) 3347–3353.
[34] D.A. Jayawickrama, J.V. Sweedler, Chiral separation of nanomole amounts of
alprenolol with cITP/NMR, Anal. Bioanal. Chem. 378 (2004) 1528–1535.
12
J. Caslavska, R.A. Mosher and W. Thormann / Journal of Chromatography A 1623 (2020) 461176
[35] C.J. Jones, C.K. Larive, Microcoil NMR Study of the interactions between doxepin, beta-cyclodextrin and acetate during capillary Isotachophoresis, Anal.
Chem. 84 (2012) 7099–7106.
[36] S. Mikkonen, J. Caslavska, P. Gebauer, W. Thormann, Inverse cationic ITP for
separation of methadone enantiomers with sulfated beta-cyclodextrin as chiral
selector, Electrophoresis 40 (2019) 659–667.
[37] W. Thormann, J. Caslavska, M.C. Breadmore, R.A. Mosher, Dynamic computer
simulations of electrophoresis: Three decades of active research, Electrophoresis 30 (2009) S16–S26.
[38] W. Thormann, M.C. Breadmore, J. Caslavska, R.A. Mosher, Dynamic computer
simulations of electrophoresis: a versatile research and teaching tool, Electrophoresis 31 (2010) 726–754.
[39] W. Thormann, C.-X. Zhang, J. Caslavska, P. Gebauer, R.A. Mosher, Modeling
of the impact of ionic strength on the electroosmotic flow in capillary electrophoresis with uniform and discontinuous buffer systems, Anal. Chem. 70
(1998) 549–562.
[40] V. Hruška, M. Jaroš, B. Gaš, Simul 5 – Free dynamic simulator of electrophoresis, Electrophoresis 27 (2006) 984–991.
[41] M. Bercovici, S.K. Lele, J.G. Santiago, Open source simulation tool for electrophoretic stacking, focusing, and separation, J. Chromatogr. A 1216 (2009)
1008–1018.
[42] R.A. Mosher, M.C. Breadmore, W. Thormann, High-resolution electrophoretic
simulations: performance characteristics of one-dimensional simulators, Electrophoresis 32 (2011) 532–541.
[43] S. Mikkonen, H. Elkstrom, W. Thormann, High-resolution dynamic computer
simulation of electrophoresis using a multiphysics software platform„ J. Chromatogr. A 1532 (2018) 216–222.
[44] E. Dubrovcˇ áková, B. Gaš, J. Vacík, E. Smolková-Keulemansová, Electromigration
in systems with additives in background electrolytes 1. Addition of the neutral
complexing agent, J. Chromatogr. 623 (1992) 337–344.
[45] M.C. Breadmore, H.Y. Kwan, J. Caslavska, W. Thormann, Dynamic high-resolution computer simulation of electrophoretic enantiomer separations with neutral cyclodextrins as chiral selectors, Electrophoresis 33 (2012) 958–969.
[46] V. Hruška, M. Beneš, J. Svobodová, I. Zusková, B. Gaš, Simulation of the effects
of complex- formation equilibria in electrophoresis: I. Mathematical model,
Electrophoresis 33 (2012) 938–947.
[47] J. Svobodová, M. Beneš, V. Hruška, K. Ušelová, B. Gaš, Simulation of the effects
of complex- formation equilibria in electrophoresis: II. Experimental verification, Electrophoresis 33 (2012) 948–957.
[48] J. Caslavska, M.C. Breadmore, W. Thormann, Dynamic high-resolution computer simulation of isotachophoretic enantiomer separation and zone stability,
Electrophoresis 35 (2014) 625–637.
[49] J. Caslavska, W. Thormann, Contemporary chiral simulators for capillary zone
electrophoresis, Electrophoresis 41 (2020) 502–513.
[50] J. Caslavska, I.J. Koenka, P.C. Hauser, W. Thormann, Validation of CE modelling with a contactless conductivity array detector, Electrophoresis 37 (2016)
699–710.
[51] P. Bocˇ ek, P. Gebauer, M. Deml, Migration behavior of the hydrogen-ion and its
role in isotachophoresis of cations, J. Chromatogr 217 (1981) 209–224.
[52] V.K. Almeida, C.K. Larive, Insights into cyclodextrin interactions during sample
stacking using capillary isotachophoresis with on-line microcoil NMR detection, Magn. Reson. Chem. 43 (2005) 755–761.
[53] M. Dovhunová, M. Malý, P. Dubský, G.S. Gerlero, P.A. Kler, Generalized model
of the linear theory of electromigration and its application to electrokinetic
chromatography: Capillary zone electrophoretic systems with complex-forming equilibria, J. Chromatogr. A 1610 (2020) 460595.
[54] J. Caslavska, R.A. Mosher, W. Thormann, Impact of Taylor-Aris diffusivity on
analyte and system zone dispersion in CZE assessed by computer simulation
and experimental validation, Electrophoresis 36 (2015) 1529–1538.
[55] W. Thormann, J. Caslavska, R.A. Mosher, Computer simulation of electrophoretic aspects of enantiomer migration and separation in capillary electrochromatography with a neutral selector, Electrophoresis 36 (2015) 773–783.
[56] V. Schurig, D. Wistuba, Recent innovations in enantiomeric separation by electrochromatography utilizing modified cyclodextrins as stationary phases, Electrophoresis 20 (1999) 2313–2328.
[57] D. Wistuba, V. Schurig, Cyclodextrin-mediated enantioseparations by capillary
electrochromatography, Methods Mol. Biol. 970 (2013) 505–523.
[58] M. Riesová, J. Svobodová, Z. Tošner, M. Beneš, E. Tesarˇová, B. Gaš, Complexation of buffer constituents with neutral complexation agents: Part I. Impact on
common buffer properties, Anal. Chem. 85 (2013) 8518–8525.