Determination of deamidated isoforms of human insulin using capillary electrophoresis
Bạn đang xem bản rút gọn của tài liệu. Xem và tải ngay bản đầy đủ của tài liệu tại đây (1.66 MB, 8 trang )
Journal of Chromatography A 1626 (2020) 461344
Contents lists available at ScienceDirect
Journal of Chromatography A
journal homepage: www.elsevier.com/locate/chroma
Determination of deamidated isoforms of human insulin using
capillary electrophoresis
M. Andrasi, B. Pajaziti1, B. Sipos, C. Nagy, N. Hamidli, A. Gaspar∗
Department of Inorganic and Analytical Chemistry, University of Debrecen, H-4032, Debrecen, Egyetem ter 1., Hungary
a r t i c l e
i n f o
Article history:
Received 28 April 2020
Revised 10 June 2020
Accepted 12 June 2020
Available online 13 June 2020
Keywords:
Insulin
Deamidation
Isoforms
Capillary electrophoresis
Mass spectrometry
a b s t r a c t
The applicability of capillary zone electrophoresis (CZE) for the separation of the deamidated forms of insulin has been studied. 50 mM NH4 Ac (pH=9) with 20 % v/v isopropylalcohol was found optimal for efficient separation of insulin from its even 10 deamidated forms. The developed method was efficiently applied for monitoring the degradation rate of insulin and the formation of different deamidation isoforms.
Two months after the acidification more than thirty peaks can be observed in the electropherogram, because degradation products other than deamidated components were formed as well. The recorded mass
spectra enabled us to assign the exact mass of the components, and thus the identification of insulin
isoforms could be accomplished. We think that this study provides useful information on how the determination of several deamidation forms can be carried out with CE-MS, but the identification of the exact
position of deamidation sites in the insulin molecule remains a challenge.
© 2020 The Authors. Published by Elsevier B.V.
This is an open access article under the CC BY-NC-ND license.
( />
1. Introduction
Insulin is an important peptide hormone regulating glucose
metabolism. Human insulin consists of two chains (chain-A and
chain-B containing 21 and 30 amino acid residues, respectively),
two interchain disulphide bonds and one intra disulphide bond
within chain-A. Currently, the majority of insulin used for medicinal purposes is produced by recombinant DNA technology, which
can undergo several post-translational modifications (PTM) including deamidation, glycosylation, aggregation or oxidation of methionine [1,2]. The most common non-enzymatic degradation of insulin is deamidation, which occurs as a result of the removal of
amide groups in asparagine (N or Asn) and glutamine (Q or Gln)
residues by hydrolysis resulting in free carboxylate groups (there
are six possible residues where deamidation can occur (A5(Q),
A15(Q), A18(N), A21(N), B3(N), B4(Q)). Asparagin is converted to
aspartic acid and iso-aspartic acid through the formation of a succinimide intermediate. The deamidation of glutamine residue can
undergo via the same mechanism through the formation of glutarimide intermediate but at a slower rate, therefore the deamidation is often more common in Asn residues than in Gln residues
∗
Corresponding author.
E-mail address: (A. Gaspar).
1
present address: Faculty of Pharmacy, Ss. Cyril and Methodius University, Vodnjanska 17, 10 0 0 Skopje, North Macedonia
[1]. PTMs cause alterations in biological activity, immune response
and stability, therefore their characterization during manufacture
and storage is essential [2].
The deamidation of insulin depends on multiple factors such
as pH, temperature, shaking, amino acid sequence, higher structure of proteins and it can occur during pharmaceutical preparation or storage [3,4]. Based on several works, it can be concluded
that deamidation of insulin can be forced by low pH [3–8].
Brange found that in strong acidic conditions deamidaton can
take place in position A21 [5], while in weak acidic or neutral solutions residue B3 is the most susceptible [6,7].
Several chromatographic and electrophoretic techniques were
used to reveal insulin heterogeneity. The importance of these studies is given by the requirement that the ratio of deamidated isoforms in the pharmaceuticals must not exceed 3% [9]. Besides reversed phase HPLC techniques [8,10,11], ion chromatography (IC)
[12] was used to study the charge variants including deamidation.
The different techniques of capillary electrophoresis (CE) such as
capillary isoelectric focusing (CIEF) [13,14] and capillary zone electrophoresis [13,15–19] were found to be useful in the analysis of
charge variants. CZE separates deamidated isoforms by their mass
to charge ratio. The appropriate choice of pH and different additives of the background electrolyte (BGE) can reduce the interaction between the analytes and the capillary surface enhancing
the efficiency and reliability of separations [20]. Determination of
deamidated peptides were performed with PVA-coated capillary
/>0021-9673/© 2020 The Authors. Published by Elsevier B.V. This is an open access article under the CC BY-NC-ND license. ( />
2
M. Andrasi, B. Pajaziti and B. Sipos et al. / Journal of Chromatography A 1626 (2020) 461344
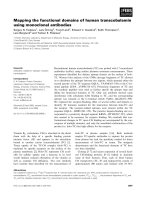
Fig. 1. CZE electropherograms of insulin and its deamidated isoforms with UV detection using running buffer of 50 mM NH4 Ac pH= 9 (a,) and with different concentration
of isopropylalcohol 10 % v/v (b,), 20 % v/v (c,) and 30 % v/v (d,). The CZE electropherograms obtained with 50 mM NH4 Ac pH= 9.0 (e,) and 50 mM NH4 Ac, 20 % v/v
isopropylalcohol pH= 9.0 (f,) were also detected with MS. Conditions: capillary 85 cm x 50 μm i.d., leff : 77 cm, hydrodynamic sample injection: 100 mbar•s, U= +25 kV,
λ = 200 nm. For MS detection: capillary length: 100 cm, sheath liquid: isopropylalcohol:water=1:1 with 0.1% formic acid; flow rate: 7 μL/min. ESI voltage: 4500 V; end
plate offset: 500 V. The 3,43 mg/ml insulin was stored in acidic condition at pH= 1 for 8 days at room temperature.
in acetic acid buffer [21] and with a polybrene-dextrane sulfate
coated capillary [22]. There are several CE works about deamidation of antibodies [14,15,20] or small proteins other than insulin
[21,22]. In a recent paper [22] a 4.5 kDa peptide drug containing five closely-positioned potential deamidation sites was exposed
to acidic conditions for 1-14 h and 6 deamidated components
could be separated. However, only a very few papers [19,23,24]
are dealing with CE analysis of insulin deamidation, and in these
works only one or two deamidated forms (desamido A21-insulin
and/or desamido-B3-insulin) have been detected and the components were identified by adding standards. Mandrup monitored the
degradation of insulin by IC and CZE, and excellent correlation was
established between these techniques [19]. Insulin and desamido
insulin were separated using tricine-morpholino buffer at pH=8
[23] and adding acetonitrile and several zwitterions or different organic solvents to the BGE [16].
The deamidation of one amino acid results in a mass increase
of 1 Da to the molecular mass of a protein, which can be detected
by mass spectrometry (MS) [23,25]. Different types of charge variants of proteins/peptides including deamidated forms were identified by LC-MS [12,26] or CZE-MS [22,27]. Recently, for the first time
Dominguez-Vega demonstrated the usefulness of the CE - MS/MS
method for compositional and site-specific assessment of multiple peptide-deamidation [22], but according to our best knowledge, CE-MS was not applied so far for the determination of insulin
deamidation.
Although CZE is a very efficient tool for the separation of charge
variants, only the 1-2 deamidated forms have been separated from
insulin and no multiply deamidated forms have been detected using this technique. In this work we developed a CE method which
can be efficiently applied for monitoring the degradation of insulin
and the formation of a large number of different deamidation isoforms. This is the first work in which even 10 deamidated forms
have been separated and quantitatively determined, thus the determinations could be applied to study the formation of deamidated
insulin isoforms in time. The aim of the present study was to optimize CZE for UV and MS detection, which would enable the separation and determination of a large number of deamidation isoforms of human insulin.
2. Materials and methods
2.1. Reagents and materials
All chemicals were of analytical grade. Ammonium-acetate,
methanol, acetonitrile, isopropylalcohol, ammonium hydroxide solution, NaOH, HCl were purchased from Sigma Aldrich (St. Louis,
MO, USA), and diluted with de-ionized water (Millipore Synergy
UV) prior to use. The 3.5 mg/mL human insulin (Humulin R) solution was obtained from Lilly (France). The pH of the background
electrolyte (50 mM ammonium acetate in 20 % v/v isopropylalcohol for CE-UV and 50 mM ammonium acetate for CE-MS) was 9.0.
The buffer was prepared by dissolving solid ammonium acetate,
which was then titrated by 25 % m/m ammonium hydroxide solution. All solutions were filtered using a membrane filter of 0.45
μm pore size and stored at +4°C. Running buffers were degassed
in an ultrasonic bath for at least 5 min. Prior to first use, the fused
silica capillary was rinsed with 1 M NaOH for 20 min, de-ionized
water for 10 min and running buffer for 20 min.
M. Andrasi, B. Pajaziti and B. Sipos et al. / Journal of Chromatography A 1626 (2020) 461344
3
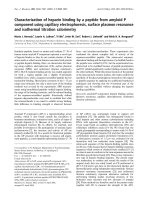
Fig. 2. Study of the formation of deamidated products of insulin. The analysed insulin sample was acidified (pH= 1) and stored for 0.1 hour (a,), 6 hours (b,), 1 day (c,), 7
days (d,), 30 days (e,) and 60 days (f,) at room temperature. Conditions were same as in Fig. 1.b.
2.2. Degradation of insulin samples
Acid catalyzed forced degradation of human insulin was carried
out. Stock solution of insulin was mixed with 6 M HCl solution to
get a final concentration of 0.1 M HCl. The acidified insulin solution was kept at room temperature for 60 days and analyzed at
different times.
2.3. Measurements with CE
Analyses were conducted using a 7100 model CE instrument
(Agilent, Waldbronn, Germany) with UV and MS (maXis II UHR ESIQTOF MS instrument, Bruker, Bremen, Germany) detection. For CE
measurements with UV detection, fused silica capillaries of 85 cm
x 50 μm I.D. and 370 μm O.D. (Polymicro, Phoenix, AZ, USA) were
used (Leff = 77 cm). UV detection was carried out by on-capillary
photometric measurement (detection wavelength: 200 nm). Samples were introduced hydrodynamically (50 mbar, 2 s) at the an-
odic end of the capillary. The BGE consisted of 50 mM NH4 Ac with
20 % v/v isopropylalcohol. The applied voltage was +25 kV. The
capillaries were preconditioned with 1 M NaOH for 10 min, acetonitrile for 5 min and finally with BGE for 8 min. OpenLAB CDS
Chemstation (Agilent) software was used for both controlling the
CE instrument and processing the obtained electropherograms.
As concerns MS detection, a CE-ESI sprayer interface (G1607B,
Agilent) provided on-line hyphenation to the CE instrument.
Sheath liquid was transferred with a 1260 Infinity II isocratic
pump (Agilent). MS instrument was controlled by otofControl version 4.1 (build: 3.5, Bruker). The following analysis conditions
were used for CE-MS determinations: 100 cm x 50 μm I.D. and
370 μm O.D fused silica capillary; hydrodynamic sample injection
(50 mbar, 6 s), BGE: 50 mM NH4 Ac, pH=9.0; sheath liquid (SL):
isopropylalcohol:water= 1:1 with 0.1 % v/v formic acid; SL flow
rate: 7 μL/min; applied voltage: +25 kV. The capillaries were preconditioned with the BGE and postconditioned with acetonitrile
and BGE for 2-2 min. MS parameters: positive ionization mode;
4
M. Andrasi, B. Pajaziti and B. Sipos et al. / Journal of Chromatography A 1626 (2020) 461344
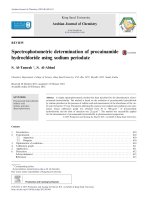
Fig. 3. CZE separation of insulin and its deamidated isoforms. The sample was acidified (pH= 1) and stored at room temperature for 10 days (a,). Separation conditions
were same as in Fig. 1.b. Effect of time on the formation of deamidated insulin isoforms studied up to 700 min (b,) and 30 days (c, d,). Deamidated isoforms are marked as
D1-D10. Conditions were same as in Fig. 1.b.
nebulizer pressure: 0.4 bar; dry gas temperature: 220°C; dry gas
flow rate: 8 L min−1 ; capillary voltage: 4500 V; end plate offset:
500 V; spectra rate: 6 Hz; mass range: 80 0-220 0 m/z. Nebulizer
gas pressure was turned off for 5 min at the beginning of each run
in order to reduce the syphoning effect generated by the nebulizer
gas flow, thereby improving the resolution of peaks and providing constant current during the electrophoresis. Na-formate calibrant was injected after each separation, which enabled internal
m/z calibration. Mass spectra were processed by Compass DataAnalysis version 4.4 (build: 200.55.2969).
3. Results and discussions
3.1. CZE separation of deamidation isoforms of insulin
Insulin is a peptide hormon of 5.8 kDa, that is, it is a quite
small protein. Large proteins (above 30 kDa) often strongly adsorb on the bare (non-modified) fused silica capillary, but the separation of peptides and small proteins are quite common in such
capillaries without their considerable adsorption. However, to keep
the possible adsorption effects to a minimum, acidic or basic conditions for the separations are suggested. Insulin has a pI= 5.3,
thus its adsorption in basic electrolyte (having negative net charge)
onto the negatively charged capillary wall should not be significant. In CZE, the separation is based on the difference in electric charge relative to molecular size. The electric charge depends
on the number of carboxyl and amino groups of the component,
but also on the pH of the electrolyte which controls the dissociation of these groups. Basic buffer electrolyte is preferred, because at this pH the carboxyl group(s) formed via deamidation add
negative charge(s) to the peptide. Using pH below 4, no separation of the deamidated forms could be achieved (Fig. SM-2). In
our work we intended to use both UV photometric and MS detection, the choice of electrolytes were limited by the fact that
those should be compatible with MS. Based on the above considerations ammonium acetate buffer of pH=9 seemed suitable. Although this BGE is much simpler than those applied in the literature of deamidation isoforms [19–23], insulin and several deamidated variants could be well separated (in order to develop an
electrophoretic method able to separate the deamidation isoforms,
an acidified insulin solution incubated for 1 week was employed
as test sample (Fig. 1.a and e)). 50 mM concentration of NH4 Ac
was found optimal for the separation as it ensured proper ionic
strength but current less than 30 μA. Although various (statically
or dynamically) coated capillaries are commonly and efficiently
used for the separation of proteins [16–18], in our measurements
the application of non-modified bare fused silica capillaries provided proper resolving power for the separation of the deamidation isoforms of insulin. Similarly, other works [12,19,23,24]
dealing with CZE analysis of insulins used bare fused silica
capillaries.
For enhancing the separation efficiency and resolution of the
deamidated isoforms, it was suggested to add organic solvents like
acetonitrile, methanol and isopropylalcohol (IPA) to the BGE [22].
Separation could be improved with these solvents; the best resolution but longest separation was obtained with IPA (Fig. SM-3).
Since IPA content above 30 % v/v started to broaden the peaks and
led to long analysis time, 20 % v/v IPA was found optimal (Fig. 1.ad). Careful postconditioning (washing with 1 mM NaOH for 10 min
and with BGE for 8 min) and application of cresol as a time reference component for the normalization led to repeatable separations, the precision data of insulin were 0.36 RSD% and 2.63 RSD%
for migration times and peak areas, respectively (the application
of internal standard (cinnamic acid) did not improve the data). The
precision study for the acidified insulin showed similar data for the
migration times: 0.49 RSD% and 0.14 RSD% for insulin and the D1
deamidation form. However, peak areas continuously decreased for
insulin and increased for D1, which makes the repeatability measurements meaningless (Fig. SM-4).
M. Andrasi, B. Pajaziti and B. Sipos et al. / Journal of Chromatography A 1626 (2020) 461344
5
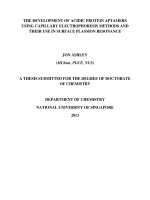
Fig. 4. MS spectra (isotopic distribution) of human insulin and D1-D6 deamidated isoforms (molecular ions with charge number of 5) obtained after CZE separation of the
components. The acidified insulin (c= 3.43 mg/ml, pH = 1) was stored for 7 days before analysis. MS parameters: positive ionization mode; nebulizer pressure: 0.4 bar; dry
gas temperature: 220°C; dry gas flow rate: 8 L min-1; capillary voltage: 4500 V; end plate offset: 500 V; spectra rate: 6 Hz.
In the case of CE-MS analysis, the length of the separation capillary was 100 cm, long enough for the proper and convenient hyphenation between the CE and MS. It was found that this long
separation distance (migration times around 50 min) made analyte peaks wider compared to the separation with no IPA content
(Fig. 1.e-f). Therefore, no IPA modifier was added to the BGE for the
CE-MS measurements.
In an earlier work, where a single desamido peak was separated
from the insulin, it was stated that this peak probably contained
several monodesamido insulin derivatives which would not be separated from each other by CZE [23]. Our results show that using
a simple and MS compatible ammonium acetate buffer of pH=9.0
probably all possible (3 different) monodesamido (and even several two, three or four-fold) insulin degradants were properly separated. The MS measurements revealed that the D1-D10 peaks were
indeed of only a given molecular mass, verifying the separation efficiency of the proposed method.
In a recent work the separation efficiency for the characterization of multiple deamidated degradation products of a peptide therapeutic [22] was similar to that of our measurements.
Dominguez-Vega et al used ammonium formate (pH 6.0) BGE in
combination with a capillary coated with a bilayer of Polybrenedextran sulfate. MS detection made it possible to easily distinguish the deamidated from deacetylated-deamidated degradation
products.
3.2. Study of the deamidaton of insulin
The rate of deamidation reactions of insulin is mainly influenced by temperature and pH [3–8]. Upon deamidation, asparagine
is first converted to a five carbon cyclic intermediate, which is then
hydrolysed to form either iso-aspartate or aspartate. At low pH the
hydrolysis of the side chain amide generates mainly aspartate [12].
It is widely accepted that the desamido-(A21)-insulin is formed at
6
M. Andrasi, B. Pajaziti and B. Sipos et al. / Journal of Chromatography A 1626 (2020) 461344
Fig. 5. MS spectra (isotopic distribution) of human insulin and D1, D4, D7, D10 deamidated isoforms (molecular ions with charge number of 5) obtained after CZE separation
of the components. The acidified insulin (c= 3.43 mg/ml, pH = 1) was stored for 51 days before analysis. MS parameters were same as in Fig. 4.
the highest rate and two L-aspartate isoforms can be formed: Laspartic acid (Asp) and isoaspartic acid (isoAsp). Besides, other isoforms such as desamido-(B3)-insulin or isoAsp-(B3)-insulin can be
created as well [6,28]. No data about the desamido-(A18)-insulin
or the deamidation of Glu were found, but their occurance cannot be excluded during the deamidation processes. It is also known
that isoAsp can be generated by spontaneous isomerisation of Asp
residues via succinimide ring formation [29]. The number of the
deamidation variants of insulin is further increased by multiple
deamidation, when two- or three-fold deamidated forms can form
as two or three Asn or Gln transform to Asp (or isoAsp) or Glu in
a single molecule. These possible processes suggest that not only a
few but quite a large number deamidation isoforms can be formed
from insulin.
After the insulin sample was acidified with HCl to pH=1, fast
formation of deamidated isoforms could be experienced, which
was followed in time up to 2 months (Fig. 2). Within 24 h after
acidification, the peak of insulin was resolved to two overlapped
peaks (Fig. 2.b-c.) with the same mass, but then only a single
peak appeared. This interesting phenomenon is perhaps caused by
a change in the tertiary structure of insulin (eg. T→R insulin transformation [6]). Here further investigation is required. Within 10
days after acidification, 10 degradation products (D1-D10) could be
clearly separated from insulin (Figs. 2 and 3.a). These D1-D10 components should be deamidated forms since the molecular masses
of these components are 1, 2, 3 or 4 Da larger than insulin and
their migration rates gradually decrease, as the negative charge of
the molecule increases with the degree of deamidation. The inten-
sities (peak areas) are the largest for the D1-D3 (monodeamidated
forms) as the formation of those has the highest probability. Since
asparagine deamidation at A21 resulted in the formation of aspartic acid and iso-aspartic acid, these degradation products probably
correspond to two of the D1-D3 peaks (the rate of deamidation
is much lower at position B3 because Asn is followed by valine,
which has a large side chain (compared to cysteine at A20) [1]).
The third peak from among D1-D3 most probably indicates the
product of B3 deamidation.
Two months after acidification more than thirty peaks can be
observed in the electropherogram, because presumably, degradation products other than deamidated components were formed,
as well. The peak of insulin largely declined to 10% of its initial
area 1 month after acidification of the solution. The D1-D3 (onefold deamidated) and D4 (two-fold deamidated) forms reached the
highest concentration in 2-8 days, additional two-fold or three-fold
deamidated components (D5>) are slowly formed after 1 month
(Fig. 3.c-d). However, the quantitation of the degradation forms in
these samples is difficult due to the overlapping of a large number
of peaks.
3.3. Identification of deamidation isoforms with MS
The identification of deamidation isoforms is a challenging analytical task, which requires high performance separation technique
and high resolution, selective detector. The best strategies may be
developed on a case-by-case basis and the hyphenation of CE with
MS can provide a promising solution [2]. The mass spectra (iso-
M. Andrasi, B. Pajaziti and B. Sipos et al. / Journal of Chromatography A 1626 (2020) 461344
topic distributions) are clearly applicable to determine the exact
mass of the components, and through this the identification of insulin and its deamidated isoforms can be accomplished (Fig. SM-6,
SM-7).
Fig. 4 demonstrates the MS spectra (isotopic distribution) of human insulin and D1-D6 deamidated isoforms obtained within a
CZE run shown in Fig. 3.a. The first peak in the electropherogram is
assigned to human insulin at a monoisotopic mass of 1161.692 m/z
(5808.675 Da after deconvolution as the molecular ions are present
with charge number of +5) and the following peaks D1-D3 show
an m/z increase of approximately 0.197 Da (0.984 Da after deconvolution). The mass spectra of D4-D6 peaks are further shifted
with an additional mass difference which corresponds to the mass
change due to an additional deamidation process. D1-D3 and D4D6 are supposed to be the one and two-fold deamidated insulins,
respectively, the determination of which would be problematic
without the proper separation of these isoforms, due to their overlapping isotopic distributions. The CZE separation of these isoforms
is made possible by the introduction of additional carboxyl groups
(thereby increasing the number of negatively charged side chains,
affecting their mass to charge ratio) as well as alterations in their
molecular shape induced by deamidation. The mass spectra obtained from an electropherogram of the sample incubated at pH=1
for 2 months (Fig. 2.f) is shown in Fig. 5. It can be clearly observed that the isotopic distributions (monoisotopic peaks) of D1,
D4, D7 and D10 are successively shifted with approximately 0.197
Da (0.984 Da after deconvolution), that is the method is applicable
to separate the one, two, three and four-fold deamidated insulins
from insulin.
Although the above CE-MS measurements demonstrate the degree of deamidation by retrieving the mass spectra of each electrophoretic peak, the determination of the exact positions of
deamidation would be of crucial importance, as well. A sensible
approach would be the dissociation of molecular ions, preferably
those having higher charge states, using the coulombic repulsion
in our favor. However, our CE-MS/MS experiments using collisioninduced dissociation (CID) yielded no fragment ions that would
show the expected 0.984 Da mass increase (the most abundant
ions of 1162 m/z were selected for CID). Despite applying collision energies ranging between 15-150 eV, only poor fragmentation
could be observed (Fig. SM-8). We presume this high resistance to
fragmentation can be derived from the presence of 2 interchain
and 1 intrachain disulphide bond. It has been shown in the literature, as well that disulphide linkages are less prone to fragmentation under CID conditions [30], especially in the case of insulin
[31].
A convenient strategy for the investigation of insulins with
MS/MS could be the pretreatment of the oxidized cysteins with
a reducing agent in order to separate the A and B chains of the
molecule [32,33]. Generally, it is the peptide bonds that cleave
upon CID in positive ion mode. However, the immediate reduction of disulphide bridges cannot be achieved in the on-line system
of HPLC/CE-MS. On the other hand, electron capture dissociation
(ECD) [34], electron transfer dissociation (ETD) [30] and ultraviolet
photodissociation [35] might be more suitable candidates for the
fragmentation of disulphide bonds. However, no site-specific identification of multiple peptide-deamidation was demonstrated in insulin by HPLC or CE and MS combinated system. Our ongoing research aims at developing a CE-MS/MS method, which enables the
determination of exact deamidation sites.
4. Conclusion
In pharmaceutical products deamidation is often observable and
it causes problems as the structure of the protein goes through
changes. In this work we studied the possibilities of determining
7
the potential deamidation isoforms of human insulin. CZE provided
a proper separation of a large number of components having only
a minimal difference in their molecular mass (0.017%) or shape of
the molecules. It was found that the use of UV detection provided
a slightly better separation for these components than MS detection. This can be explained by the peak broadening due to long migration length of the analytes, the laminar flow induced by suction
effect of the ESI nebulization and the off-capillary feature of the
detection. However, MS detection made possible the determination
of the exact mass of the components, and through this the identification of insulin and its deamidated isoforms. Therefore, both UV
and MS detections (separately) are advised to use.
The developed CZE separation method can be efficiently applied
for monitoring the degradation of insulin and the formation of different deamidation isoforms. This is the first work in which even
10 deamidated forms have been separated and determined. However, developing a CE-MS/MS method, which enables the determination of the exact deamidation sites in insulin is still challenging.
Declaration of Competing Interest
The authors declare that they have no known competing financial interests or personal relationships that could have appeared to
influence the work reported in this paper.
CRediT authorship contribution statement
M. Andrasi: Data curation, Investigation, Methodology, Supervision. B. Pajaziti: Conceptualization, Data curation, Supervision. B.
Sipos: Data curation, Supervision. C. Nagy: Supervision, Writing original draft. N. Hamidli: Data curation. A. Gaspar: Conceptualization, Methodology, Supervision, Writing - original draft.
Acknowledgments
The research was supported by the EU and co-financed by
the European Regional Development Fund under the project
GINOP-2.3.2-15-2016-0 0 0 08, GINOP-2.3.3-15-2016-0 0 0 04. The authors also acknowledge the financial support provided for this
project by the National Research, Development and Innovation Office, Hungary (K127931). BP thanks the Central European Exchange
Program for University Studies (CEEPUS) for her fellowship (CIIIRO-0010-14-1920-M-134320).
The authors declare that they have no known competing financial interests or personal relationships that could have appeared to
influence the work reported in this paper.
Supplementary materials
Supplementary material associated with this article can be
found, in the online version, at doi:10.1016/j.chroma.2020.461344.
References
[1] N.E. Robinson, A.B. Robinson, Molecular Clocks: deamidation of asparaginyl
and glutaminyl residues in peptides and proteins, Althouse Press, Cave Junction, OR, USA (2004), doi: 10.1016/B978-0-12-152808-9.50013-4.
[2] D. Gervais, Protein deamidation in biopharmaceutical manufacture: understanding, control and impact, J. Chem. Technol. Biotechnol. 91 (2016) 569–575,
doi:10.1002/jctb.4850.
[3] S.A. Berson, R.S. Yalow, Deamidation of insulin during storage in frozen state,
Diabetes 15 (1966) 875–879, doi:10.2337/diab.15.12.875.
[4] J. Brange, L. Langkjaer, Chemical stability of insulin. 3. Influence of excipients,
formulation and pH, Acta Pharm. Nord. 4 (3) (1992) 149–158.
[5] F. Sundby, Separation and characterization of acid-induced insulin transformation products by paper electrophoresis in 7 M urea, J. Biol. Chem. 237 (1962)
3406–3411.
[6] J. Brange, L. Langkjaer, S. Havelund, A. Vølund, Chemical stability of insulin. 1.
Hydrolytic degradation during storage of pharmaceutical preparations, Pharm.
Res. 9 (1992) 715–726, doi:10.1023/A:1015835017916.
8
M. Andrasi, B. Pajaziti and B. Sipos et al. / Journal of Chromatography A 1626 (2020) 461344
[7] M.R. Nilsson, C.M. Dobson, Chemical modification of insulin in amyloid fibrils,
Protein Sci. 12 (2003) 2637–2641, doi:10.1110/ps.0360403.
[8] D. Jacob, M.J. Taylor, P. Tomlins, T. Sahota, Insulin solution stability and biocompatibility with materials used for implantable insulin delivery device using reverse phase HPLC methods, Appl. Sci 9 (2019) 4794–4503, doi:10.3390/
app9224794.
[9] European Pharmacopoeia (Ph. Eur.) Edition 10.0 (2020).
[10] B. Sarmento, A. Ribeiro, F. Veiga, D. Ferreira, Development and validation of
a rapid reversed phase HPLC method for the determination of insulin from
nanoparticulate systems, Biomed. Chromatogr. 20 (2006) 898–903, doi:10.
1002/bmc.616.
[11] R. Tyler-Cross, V. Schirch, Effects of amino acid sequence, buffers, and ionic
strength on the rate and mechanism of deamidation of asparagine residues in
small peptide, J. Biol. Chem. 266 (1991) 22549–22556.
[12] M. Krishnappa, S. Koduru, A. Naik, P. Kodali, Separation and characterization
of deamidated isoforms in insulin analogue and its underlying mechanism, J.
Pharm. Biol. Sci. 5 (6) (2017) 258–264.
[13] J. Kahle, H. Watzig, Determination of protein charge variants with (imaged)
capillary isoelectric focusing and capillary zone electrophoresis, Electrophoresis 39 (2018) 2492–2511, doi:10.10 02/elps.20180 0 079.
[14] G. Hunt, T. Hotaling, A.B. Chen, Validation of a capillary isoelectric focusing
method for the recombinant monoclonal antibody C2B8, J. Chromatogr. A 800
(1998) 355–367, doi:10.1016/S0021-9673(97)01134-5.
[15] Y. Shi, Z. Li, Y. Qiao, J. Lin, Development and validation of a rapid capillary zone
electrophoresis method for determining charge variants of mAb, J. Chromatogr.
B 906 (2012) 63–68, doi:10.1016/j.jchromb.2012.08.022.
[16] M. Dawod, N.E. Arvin, R.T. Kennedy, Recent advances in protein analysis by
capillary and microchip electrophoresis, Analyst 142 (2017) 1847–1866, doi:10.
1039/C7AN00198C.
[17] S. Stepanova, V. Kasicka, Recent applications of capillary electromigration
methods to separation and analysis of proteins, Anal. Chim. Acta 933 (2016)
23–42, doi:10.1016/j.aca.2016.06.006.
[18] I. Miksik, Coupling of CE-MS for protein and peptide analysis, J. Sep. Sci. 42
(2019) 385–397, doi:10.10 02/jssc.20180 0817.
[19] G. Mandrup, Rugged method for the determination of deamidation products in insulin solutions by free zone capillary electrophoresis using an untreated fused-silica capillary, J. Chromatogr. A 604 (1992) 267–281, doi:10.
1016/00219673(92)85138-J.
[20] Y. He, N. Lacher, W. Hou, Q. Wang, C. Isele, J. Starkey, M. Ruesch, Analysis of
identity, charge variants and disulfide isomers of monoclonal antibodies with
capillary zone electrophoresis in an uncoated capillary column, Anal. Chem. 82
(2010) 3222–3230, doi:10.1021/ac9028856.
[21] L.A. Gennaro, O. Salas-Solano, Characterization of deamidated peptide variants
by micro-preparative capillary electrophoresis and mass spectrometry, J. Chromatogr. A 1216 (2009) 4499–4503, doi:10.1016/j.chroma.2009.03.025.
[22] E. Dominguez-Vega, T.D. Vijlder, E.P. Romijn, G.W. Somsen, Capillary
electrophoresis-tandem mass spectrometry as a highly selective tool for the
[23]
[24]
[25]
[26]
[27]
[28]
[29]
[30]
[31]
[32]
[33]
[34]
[35]
compositional and site-specific assessment of multiple peptide-deamidation,
Anal. Chim. Acta 982 (2017) 122–130, doi:10.1016/j.aca.2017.06.021.
R.G. Nielsen, G.S. Sittampalam, E.C. Rickard, Capillary zone electrophoresis of
insulin and growth hormone, Anal. Biochem. 177 (1989) 20–26, doi:10.1016/
0 0 03-2697(89)90 0 06-7.
A. Kunkel, S. Günter, C. Dette, H. Watzig, Quantitation of insulin by capillary
electrophoresis and high performance liquid chromatography. Method comparison and validation, J. Chromatogr. A 781 (1997) 445–455, doi:10.1016/
S0 021-9673(97)0 0530-X.
P. Hao, S.S. Adav, X. Gallart-Palau, S.K. Sze, Recent advances in mass spectrometric analysis of protein deamidation, Mass Spec. Rev. 36 (2016) 677–692,
doi:10.1002/mas.21491.
A.I. Nepomuceno, R.J. Gibson, S.M. Randall, D.C. Muddiman, Accurate identification of deamidated peptides in global proteomics using a quadrupole orbitrap mass spectrometer, J. Proteome Res. 13 (2014) 777–785, doi:10.1021/
pr400848n.
K. Joob, J. Hühner, S. Kiessig, B. Moritz, C. Neusüß, Two-dimensional capillary zone electrophoresis-mass spectrometry for the characterization of intact
monoclonal antibody charge variants, including deamidation products, Anal.
Bioanal. Chem. 409 (2017) 6057–6067, doi:10.10 07/s0 0216- 017- 0542- 0.
D.W. Aswad, M.V. Paranandi, B.T. Schurter, Isoaspartate in peptides and proteins: formation, significance, and analysis, J. Pharm. Biomed. Anal. 21 (20 0 0)
1129–1136, doi:10.1016/S0731- 7085(99)00230- 7.
F. Aylin, S. Konuklar, V. Aviyente, Modelling the hydrolysis of succinimide: formation of aspartate and reversible isomerization of aspartic acid via succinimide, Org. Biomol. Chem. 1 (2003) 2290–2297, doi:10.1039/B211936F.
J.C. Lakbub, J.T. Shipman, H. Desaire, Recent mass spectrometry-based techniques and considerations for disulfide bond characterization in proteins, Anal.
Bioanal. Chem. 410 (2018) 2467–2484, doi:10.10 07/s0 0216- 017- 0772- 1.
A. Thomas, M. Thevis, Recent advances in the determination of insulins from
biological fluids, Adv. Clin. Chem. 93 (2019) 115–167, doi:10.1016/bs.acc.2019.
07.003.
A. Thomas, W. Schänzer, P. Delahaut, M. Thevis, Sensitive and fast identification
of urinary human, synthetic and animal insulin by means of nano-UPLC coupled with high-resolution/high-accuracy mass spectrometry, Drug Test Analysis
1 (2009) 219–227, doi:10.1002/dta.35.
M. Thevis, A. Thomas, P. Delahaut, A. Bosseloir, W. Schänzer, Doping control analysis of intact rapid-acting insulin analogues in human urine by liquid
chromatography-tandem mass spectrometry, Anal. Chem. 78 (2006) 1897–1903
/>A.J. Soulby, J.W. Heal, M.P. Barrow, R.A. Roemer, P.B O’Connor, Does deamidation cause protein unfolding? A top-down tandem mass spectrometry study,
Prot. Sci. 24 (2015) 850–860, doi:10.1002/pro.2659.
Y.M.E. Fung, F. Kjeldsen, O.A. Silivra, T.W.D. Chan, R.A. Zubarev, Facile disulfide
bond cleavage in gaseous peptide and protein cations by ultraviolet photodissociation at 157 nm, Angew. Chem. Int. Ed. 44 (2005) 6399–6403, doi:10.1002/
anie.200501533.