Determination of recovery rates of adsorbents for sampling very volatile organic compounds (C1–C6) in dry and humid air in the sub-ppb range by use of thermal desorption gas
Bạn đang xem bản rút gọn của tài liệu. Xem và tải ngay bản đầy đủ của tài liệu tại đây (753.8 KB, 9 trang )
Journal of Chromatography A 1626 (2020) 461389
Contents lists available at ScienceDirect
Journal of Chromatography A
journal homepage: www.elsevier.com/locate/chroma
Determination of recovery rates of adsorbents for sampling very
volatile organic compounds (C1 –C6 ) in dry and humid air in the
sub-ppb range by use of thermal desorption gas chromatography-mass
spectrometry
Matthias Richter∗, Elevtheria Juritsch, Oliver Jann
Bundesanstalt für Materialforschung und -prüfung (BAM), Unter den Eichen 87, 12205 Berlin, Germany
a r t i c l e
i n f o
Article history:
Received 13 March 2020
Revised 2 July 2020
Accepted 3 July 2020
Available online 4 July 2020
Keywords:
VVOC
Indoor air: Adsorbent performance
Recovery rate
Thermal desorption
Gas chromatography
a b s t r a c t
The reliable measurement of very volatile organic compounds (VVOC) in indoor air by use of thermal
desorption gas chromatography (TD-GC) in order to include them into evaluation schemes for building
products even nowadays is a great challenge. For capturing these small molecules with carbon numbers ranging from C1 –C6 , strong adsorbents are needed. In the present study, recovery rates of nine suitable adsorbents of the groups of porous polymers, graphitised carbon blacks (GCB) and carbon molecular
sieves (CMS) are tested against a complex test gas standard containing 29 VVOC. By consideration of the
recovery and the relative humidity (50% RH), combinations of the GCB Carbograph 5TD, the two CMS
Carboxen 1003 and Carbosieve SII as well as the porous polymer Tenax® GR were identified to be potentially suitable for sampling the majority of the VVOC out of the gas mix. The results reveal a better
performance of the adsorbents in combination than being used alone, particularly under humid sampling
conditions. The recovery rates of the chosen compounds on each adsorbent should be in the range of
80–120%.
© 2021 The Authors. Published by Elsevier B.V.
This is an open access article under the CC BY-NC-ND license
( />
1. Introduction
In the indoor environment, residents are exposed to a large
number of various chemical pollutants originating from both the
ingress from the outside and emissions from permanent sources
indoors like building materials, furniture, electronic devices or
non-permanent sources like household chemicals, etc. Most of
them are organic compounds, which are classified into very
volatile, volatile and semi-volatile organic compounds (VVOC, VOC,
SVOC). In the last decades, many studies have shown that these
substances are responsible for health complaints often referred to
as the Sick Building Syndrome (SBS) [1,2]. The study discussed in
this paper is focusing on the group of the VVOC, and follows the
definition of the European testing standard EN 16516, in which
VVOC are defined as “…volatile organic compounds eluting before
n-hexane on the gas chromatographic column specified as a 5%
phenyl / 95% methyl polysiloxane capillary column, …” (non-polar
column) [3].
∗
Corresponding author.
E-mail address: (M. Richter).
In Europe, the Construction Products Regulation (CPR,
2011/305/EU) sets basic requirements (BR) on how construction works must be designed and built. BR 3 “hygiene, health
and the environment” states low emissions of toxic gases, VOC,
particles, etc. from building materials. The relevant procedures
for the determination of chemical emissions from materials used
indoors in emission test chambers are described in the international standard series ISO 160 0 0 [4–7] and are specified in the
harmonized European testing standard EN 16516 [3]. This standard
focuses on the analysis of pollutants in the VOC range, which it
defines as all compounds eluting between C6 and C16 on a slightly
polar capillary column with a 5%phenyl-/95%methyl-polysiloxane
phase using thermal desorption gas chromatography coupled with
a mass selective detector (TD-GC/MS). Measurement and analysis
procedures are described in one document, yet it lacks an evaluation of the results. To account for this gap, an expert group from
EU member states has developed a roadmap towards an EU-wide
harmonised framework for the health-based evaluation of indoor
emissions from construction products published in the ECA-reports
No. 24, 27 and 29 [8–10]. Relevant target compounds to be identified and traceably quantified in the test chamber air are listed on
/>0021-9673/© 2021 The Authors. Published by Elsevier B.V. This is an open access article under the CC BY-NC-ND license ( />
2
M. Richter, E. Juritsch and O. Jann / Journal of Chromatography A 1626 (2020) 461389
the EU-LCI list. Currently, this list is limited to only a few VVOCs
(< C6 ), such as formaldehyde, acetaldehyde, butanal, pentanal and
2-butanone [11], since these analytes are measurable with HPLC
using 2,4-dinitrophenylhydrazine (DNPH) as sorbent according to
the ISO 160 0 0-3 procedure. The porous polymer type adsorbent
Tenax® TA is very well suited for the sampling of compounds in
the VOC and SVOC range. However, what poses a challenge on
the TD-GC/MS method required by the testing standards EN 16516
and ISO 160 0 0-6 is the decrease of the retention volume of the
stipulated adsorbent Tenax® TA with increasing volatility [12,13].
Therefore, other adsorbents need to be selected to solve this
problem. A selection of suitable adsorbents can be found in the
literature, e.g. in Dettmer and Engewald [13] Woolfenden [14],
ISO 16017-1 [15] or in manufacturers’/suppliers’ information, e.g.
Camsco [16].
A standardised method for the analysis of VVOC is currently not
available. In his review, Salthammer [17] gives a good overview of
approaches that have been published to date. Only few are dedicated to a systematic validation of adsorbents and combinations of
adsorbents to cover a wide VVOC range from carbon number C1
to C6 . Schieweck, Gunschera, et al. [18] went into this direction by
systematically testing six different graphitized carbon blacks (GCB)
and carbon molecular sieves (CMS) adsorbents for covering the
compounds range of C3 –C6 . For testing the suitability of the adsorbents, a recovery rate was determined by referring the arithmetic peak areas of the target compounds for each adsorbent to
the arithmetic mean of the areas obtained by measurements on
Tenax TA. This procedure enables a rating of potentially suitable
adsorbents but is neglecting matrix effects affecting measurement
uncertainty. On the one hand the test standards the adsorbents
are spiked with are solutions of methanol, which is beyond sampling practice, and on the other hand the use of an adsorbent serving as reference is improper. Pech, Wilke, et al. [19] compared the
three adsorbents Tenax TA, Carbograph 5TD and Carbopack X as to
their suitability to retain a VVOC mix of 20 components in the gas
phase. However, they used Carbograph 5TD as reference. In both
studies, the performance of the adsorbents in the presence of water vapour in the sample air was excluded.
The aim of the present study is to determine the recovery
rates of commercially available adsorbents suitable for the sampling of VVOC including compounds with carbon numbers C1 to
C6 . Nine adsorbents involving porous polymers, GCB and CMS were
checked under consideration of relative humidity of the sampled
air and loaded with a complex gas standard mixture composed of
29 VVOC and 3 VOC around the C6 limit in the sub-ppb range.
Finally, based on the values obtained, possible combinations of adsorbents should be tested to get indication if this will lead to improved recovery.
2. Methods
2.1. Test gas preparation
The gas mixture listed in Table 1 was prepared in a gas collecting tube (GCT) with a volume of 500 mL and equipped with
a septum and a valve for additional tightness. Benzene, pentanal
Table 1
Analytes in gas mixes used for experiments. Compound properties, such as retention time (RT), molecular weight (MW) and boiling point (b.p.) are given as well as the
absolute mass loaded on adsorbent tubes for injection volumes 60 and 100 μL. Substances printed in italic do not belong to the group of VVOC according to the definition
of ISO 160 0 0-6 and EN 16516.
Carbon No.
C1
C2
C3
C4
C5
C6
ISTD1
Compound
CAS No.
Formula
RT (min)
Chlorodifluoromethane
Methanol
Dichlorodifluoromethane
Carbon disulfide
Chloroform
Vinyl chloride
Ethanol
Acetonitrile
Propene
n-Propane
Acrolein
Propanal
Acetone
Isopropyl alcohol
Methyl acetate
2-Chloro propane
1-Propanol
1,3-Butadiene
trans-2-Butene
n-Butane
cis-2-Butene
Furan
Diethyl ether
Vinyl acetate
2-Butanone
Ethyl acetate
Isoprene
n-Pentane
Pentanal
2-Methylpentane
Benzene
n-Hexane
Ethanol-d6
Benzene-d6
75–45–6
67–56–1
75–71–8
75–15–0
67–66–3
75–01–4
64–17–5
75–05–8
115–07–1
74–98–6
107–02–8
123–38–6
67–64–1
67–63–0
79–20–9
75–29–6
71–23–8
106–99–0
624–64–6
106–97–8
590–18–1
110–00–9
60–29–7
108–05–4
78–93–3
141–78–6
78–79–5
109–66–0
110–62–3
107–83–5
71–43–2
110–54–3
1516–08–1
1076–43–3
CHClF2
7.326
7.795
CH4 O
CCl2 F2
9.845
18.348
CS2
24.164
CHCl3
11.225
C2 ClH3
C2 H6 O
13.562
14.864
C2 H3 N
7.945
C3 H6
8.635
C3 H8
C3 H4 O
16.788
17.715
C3 H6 O
17.967
C3 H6 O
18.709
C3 H8 O
19.801
C3 H6 O2
20.272
C3 H7 Cl
20.645
C3 H8 O
14.394
C4 H6
15.116
C4 H8
15.396
C4 H10
15.483
C4 H8
C4 H4 O
17.528
21.059
C4 H10 O
23.671
C4 H6 O2
24.296
C4 H8 O
25.333
C4 H8 O2
21.287
C5 H8
C5 H12
21.957
29.962
C5 H10 O
26.800
C6 H14
C6 H6
27.351
27.767
C6 H14
CD3 CD2 OD 13.375
27.044
C6 D6
MW (g mol−1 ) b.p. (°C)
86.5
32.0
120.9
76.1
119.4
62.5
46.1
41.1
42.1
44.1
56.1
58.1
58.1
60.1
74.1
78.5
60.1
54.1
56.1
58.1
56.1
68.1
74.1
86.1
72.1
88.1
68.1
72.2
86.1
68.2
78.1
86.2
52.1
48.1
−40.7
64.6
8.9
46.0
61.1
−13.3
78.3
81.7
−47.7
−42.1
52.6
48.0
56.1
82.3
56.8
35.0
97.2
−4.5
0.9
0.5
0.9
3.7
35.0
71.6
79.5
77.1
34.0
36.1
103.1
60.2
80.0
69.0
Loaded mass (ng) Stability1 (%) Note
60 μL
100 μL
22
16
30
61
71
13
17
15
10
17
14
47
38
15
18
33
15
13
14
14
14
44
34
21
38
22
17
18
47
21
42
21
106
22
36
27
50
101
119
26
29
26
17
28
23
78
63
25
31
20
25
22
23
24
23
74
57
36
64
37
28
30
79
36
70
36
177
37
7
7
12
4
1
5
12
2
5
10
3
9
4
11
4
4
7
5
5
5
5
5
5
2
2
2
5
4
47
4
0
3
7
7
customised gas cylinder
customised gas cylinder
customised gas cylinder
pure compound
pure compound
customised gas cylinder
customised gas cylinder
customised gas cylinder
customised gas cylinder
customised gas cylinder
customised gas cylinder
pure compound
pure compound
customised gas cylinder
customised gas cylinder
customised gas cylinder
customised gas cylinder
customised gas cylinder
customised gas cylinder
customised gas cylinder
customised gas cylinder
pure compound
pure compound
customised gas cylinder
pure compound
customised gas cylinder
customised gas cylinder
customised gas cylinder
pure compound
customised gas cylinder
pure compound
customised gas cylinder
pure compound
pure compound
1
relative standard deviation of samplings out of the gas collecting tubes over a period of 14 days and calculated relative to the ISTD benzene-d6 . Direct injection via
split/splitless injector2 internal standard.
M. Richter, E. Juritsch and O. Jann / Journal of Chromatography A 1626 (2020) 461389
3
Table 2
Adsorbents used for the study. Data provided by Woolfenden, manufacturer/supplier and Schieweck, Gunschera et al. [14,16,18]. Tdes corresponds to the desorption
temperature used in this study (Section 2.2).
Physical properties
Surface area
(m² g−1 )
Packing density
(g cm−3 )
Tmax
Tcond
(°C)
Tdes
Mesh size
Volatility
range
35
0.28
350
320
300
60/80
C6 –C26
24
0.41
350
320
300
60/80
C7 –C30
Carbograph 5TD
560
n/a
>400
350
350
40/60
C3 –C8
Carbopack B
100–200
0.35
>400
350
325
60/80
C5 –C12
Carbopack Z
Carbosieve SII
220
1060
0.18
0.61
400
>400
350
350
325
330
60/80
60/80
C3 –C9
C1 –C2
Carboxen 569
485
0.61
>400
350
330
20/45
C2 –C5
Carboxen 1003
1000
0.46
>400
350
330
40/60
C2 –C5
Carboxen 1018
675
0.6
400
350
330
n/a
C2 –C3
Adsorbent type
Name
Porous polymers
Tenax TA
Tenax GR
Graphitized carbon
black (GCB)
Carbon molecular
sieve (CMS)
1
1
Features
Low affinity for water,
hydrophobic
Lower affinity for water
than Tenax TA
High thermal stability, low
artifacts, hydrophobic
High thermal stability, low
artifacts, hydrophobic
High thermal stability
Different data available:
some hydrophilicity to
significant water retention,
low artifacts
Different data available:
hydrophobic to some
hydrophilicity
Different data available:
hydrophobic to some
hydrophilicity, inert
Different data available:
hydrophobic to some
hydrophilicity, inert
mixture of Tenax TA and a GCB type adsorbent.
and n-hexane do not belong to the group of the VVOC but were
chosen as compounds of the transition region between the VVOC
and VOC range. The mixture contained 23 compounds taken from a
pressurised gas cylinder, custom-made by Linde AG, Germany. The
remaining 10 compounds were mixed in equal proportions without solvent to two solutions. Aliquots were spiked with a gas-tight
syringe through the septum of the GCT that was already filled with
the gas mix of the pressurized cylinder. The temperature was kept
at 23 °C. For the tests, volumes of 60 or 100 μL of the test gas
mix were taken with a gas-tight syringe and injected either directly into the split/splitless injector of the GC or onto the adsorbent to be tested as described in Section 2.4. Resulting amounts
are given in Table 1. To compensate measurement-related variations, benzene-d6 and ethanol-d6 were added as internal standards
(ISTD).
Prior to the experiments, the GCT was thoroughly checked for
tightness and the generated test gas mixture for its stability. Following a test gas mix injection into the GCT, constant amounts
of the mixes were directly injected on a daily basis into the GC’s
split/splitless injector over a period of 14 days with the relative
standard deviation (RSD) being calculated.
2.2. Analysis
All test series were carried out on a gas chromatograph
equipped with a split/splitless injector (Agilent 7890 N), an automated thermal desorption system (TDS 3/TDS A, Gerstel) using liquefied nitrogen cooling (CIS 4) and a mass selective detector (Agilent MSD 5975 C inert XL). A PLOT column (PoraBond
Q, 50 m × 0.32 mm × 5 μm, Agilent) with a polystyrenedivinylbenzene phase suitable for the separation of low boiling
compounds was installed flushed with helium (ALPHAGAS, Air Liquide) as carrier gas. Additionally, a particle trap was installed between column and MSD. The m/z scan range was between 25 and
131.
During the analyses, the test gas mix was injected in two ways:
a) Directly with a gas-tight syringe via the split/splitless injector
(splitless mode) to obtain an unaffected analysis signal (reference value): The oven programme started at 35 °C for 1 min,
then heating with 8 °C min−1 to 80 °C for 1 min, further heating with 5 °C min−1 to 230 °C. A carrier gas pressure of 0.97 bar
was adjusted.
b) Via thermal desorption of the loaded adsorbent. Since sampling
of humidified air may have an impact on the analysis, two different thermal desorption modes were applied: b1) the splitless mode when dry air was used and b2) the solvent venting dry purge mode at humid conditions to prevent icing in
the cold injection system (CIS). The TDS in both cases was programmed to start at 35 °C for 1 min, then heating with a rate of
60 °C s − 1 to 300–350 °C depending on the used adsorbent (Tdes
in Table 2) for 5 min. The CIS programme started at −150 °C,
heating at 12 °C s − 1 to 30 °C for 1 min followed by further
heating at 12 °C s − 1 to 150 °C held for 1 min. A quartz wool
filled liner was installed. For the measurements of the adsorbents the GC oven was programmed to start at 35 °C for 1 min,
then heating at 6 °C min−1 to 80 °C for 1 min, further heating at
4.8 °C min−1 to 200 °C immediately followed by further heating
at 5 °C min−1 to 230 °C. The carrier gas pressure was adjusted
to 1.4 bar.
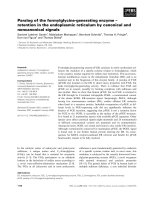
Fig. 1 depicts a chromatogram of the VVOC test gas mixture after injection via the split/splitless injector.
2.3. Selection of adsorbents
Sampling air always contains water that potentially affects sampling and analysis. Helmig, Schwarzer, et al. [20] report injected
water can cause peak shifting due to restricted flow of carrier gas
through the column, changes in carrier gas viscosity, and changes
in the stationary phase polarity and split ratios. Moreover, water
vapour is able to condense in the small pores of molecular sieves
[21]. Other authors report on competition between analytes and
water for active adsorbent sites [14,22], which may impact breakthrough volumes of analytes. Vallecillos, Maceira, et al. [23] report
on significantly decreased breakthrough volumes for 1,3-butadiene
on a multi-sorbent bed (Carbotrap B/Carbopack X/Carboxen 569) of
66% at an RH of 56–68%.
For the present study, mainly hydrophobic or slightly hydrophilic common adsorbents were selected (Table 2). However,
4
M. Richter, E. Juritsch and O. Jann / Journal of Chromatography A 1626 (2020) 461389
Fig. 1. Chromatogram of the VVOC test gas mixture analysed after direct injection into the split/splitless injector on a PoraBond Q (50 m × 0.32 mm × 5 μm).
the data provided for this parameter diverge in the literature.
Tenax® TA was used as benchmark.
Glass tubes (Gerstel, Germany) with an outer diameter of 6 mm
and a length of 176 mm were filled with the selected adsorbents.
Using the manufacturer’s marking, equal volumes of each adsorbent were filled into the tubes. This resulted in the exact same bed
lengths (60 mm) but in different absolute masses depending on the
materials’ densities (Table 3). Tube conditioning was carried out
according to the manufacturer’s recommendations (Table 2). Prior
to the analysis, blank measurements were carried out.
injector were connected with the column via a Y-splitter. Disactivated pre-columns were used to connect the injector with the Ysplitter. This set-up enabled switching between both injectors and
allowing a direct comparison of the amount of substance directly
injected over the split/splitless injector with the amount that was
desorbed from the tested adsorbent.
The recovery Ri was calculated according to Eq. (1).
Ri =
Ai,T D × AIST D,re f
Ai,T D,rel
× 100% =
× 100%,
Ai,re f,rel
AIST D,T D × Ai,re f
(1)
with
2.4. Determination of recovery
The recovery is affected by the sorption behaviour, the desorption temperature and the relative humidity at the time of sampling. Generally, for a distinct indication of the recovery of compounds from each adsorbent type, a reference value is required
that represents 100% of the loaded amount (without losses). The
reference value will then be related to the amount of substance
desorbed from the adsorbent. All effects of above discussed influences can be evaluated with this single value.
In some studies, clean adsorbent tubes are loaded with a test
mixture of known composition and concentration and compared
with the performance of other adsorbent types or the same adsorbent type impacted by variations of test parameters [18,24–
28]. The adsorbent retaining the highest amounts of the target
molecules is then taken as reference. These procedures disregard
any effects on the reference value obtained that might be resulting
from interactions of the test sample molecules with the adsorbent,
e.g. breakthrough phenomena, insufficient desorption or chemical
reactions.
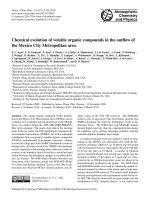
Similar to the procedure reports by Dettmer, Knobloch, et al.
[29], the recovery in this study was determined with a test setup depicted in Fig. 2. The TD injector as well as the split/splitless
Ri Recovery of component i in%
Ai,TD Peak area of component i obtained by thermal desorption
(TD) of adsorbent tube
Ai,TD,rel Ai,TD in relation to the area of ISTD
Ai,ref Peak area of component i obtained by direct injection onto
GC column via split/splitless injector (reference)
Ai,ref,rel Ai,ref in relation to the area of ISTD
AISTD,TD Peak area of ISTD obtained by thermal desorption of adsorbent tube
AISTD,ref Peak area of internal standard obtained by direct injection onto GC column via split/splitless injector
For any experiment as described in this section, the reference
value was determined by injection (n = 6) of an aliquot of the test
gas mix directly into the split/splitless injector of the GC (route
A in Fig. 2) by use of a gas-tight syringe. The average of the obtained peak areas was taken as Ai,ref and AISTD,ref , respectively. The
adsorbent tubes from Table 2 were spiked with the same volume
of test gas mix by injection into a carrier gas flow (V = 1 L) passing
through the adsorbent. This spiking took place in the same room
as the determination of the reference value to ensure the same
ambient conditions. The analysis of the adsorbent tubes, also given
as peak areas, resulted in the values for Ai,TD and AISTD,TD respec-
Table 3
Recovery rates of tested adsorbents under dry (0% RH) and humid (50% RH) sampling conditions in order of their elution from the column. The values are related to the internal standard (ISTD) benzene-d6 . Recovery rates
between 80% and 120% were allowed (bold numbers). Water retention at 50% RH is given as well. Compounds in italic do not belong to the group of VVOC as to definition in ISO 160 0 0-6 or EN 16516.
Adsorbent (mass per tube)
Compound
Methanol
Propene
n-Propane
Dichlorodifluoromethane
Vinyl chloride
Ethanol
1,3-Butadiene
Acetonitrile
trans-2-Butene
n-Butane
cis-2-Butene
Acrolein
Furan
Propanal
Acetone
Carbon disulfide
Isopropyl Alcohol
Methyl acetate
RH (%)
0
50
0
50
0
50
0
50
0
50
0
50
0
50
0
50
0
50
0
50
0
50
0
50
0
50
0
50
0
50
0
50
0
50
0
50
0
50
Tenax GR
(240 mg)
Carbograph
Carbopack B
5TD (300 mg) (275 mg)
Carbopack Z
(140 mg)
Carbosieve S
II (500 mg)
n. d.
n. d.
n. d.
(35 ± 17)%
(5 ± 4)%
(3 ± 4)%
(16 ± 3)%
n. d.
(2 ± 1)%
n. d.
n. d.
n. d.
(3 ± 1)%
(73 ± 5)%
(12 ± 7)%
(2 ± 2)%
(17 ± 3)%
(71 ± 4)%
(72 ± 12)%
(1 ± 1)%
(15 ± 6)%
(1 ± 1)%
(14 ± 2)%
(1 ± 1)%
(18 ± 4)%
(83 ± 5)%
(85 ± 8)%
(12 ± 8)%
(67 ± 9)%
(114 ± 12)%
(94 ± 7)%
(101 ± 4)%
(89 ± 6)%
(7 ± 6)%
(74 ± 9)%
(120 ± 69)%
(53 ± 8)%
(89 ± 2)%
(75 ± 4)%
n. d.
(3 ± 2)%
(73 ± 7)%
(8 ± 1)%
(24 ± 22)%
(54 ± 6)%
(7 ± 5)%
(36 ± 7)%
(91 ± 15)%
(90 ± 4)%
(80 ± 15)%
(73 ± 4)%
(66 ± 13)%
(77 ± 10)%
(100 ± 3)%
(75 ± 4)%
(75 ± 3)%
(93 ± 20)%
(103 ± 4)%
(76 ± 3)%
(99 ± 2)%
(77 ± 5)%
(101 ± 1)%
(76 ± 3)%
(85 ± 14)%
(116 ± 8)%
(105 ± 1)%
(93 ± 3)%
(91 ± 19)%
(87 ± 4)%
(100 ± 4)%
(95 ± 2)%
(95 ± 4)%
(96 ± 4)%
(83 ± 22)%
(84 ± 22)%
(72 ± 13)%
(83 ± 2)%
n. d.
(107 ± 5)%
(73 ± 4)%
(95 ± 17)%
(102 ± 18)%
(169 ± 43)%
(106 ± 11)%
(104 ± 6)%
(49 ± 5)%
(113 ± 6)%
(28 ± 2)%
(105 ± 6)%
(18 ± 2)%
(83 ± 4)%
(93 ± 15)%
(72 ± 20)%
(75 ± 5)%
(80 ± 12)%
(146 ± 20)%
(103 ± 7)%
(92 ± 6)%
(102 ± 5)%
(102 ± 6)%
(97 ± 4)%
(88 ± 5)%
(90 ± 7)%
(97 ± 6)%
(96 ± 8)%
(95 ± 3)%
(45 ± 30)%
(60 ± 5)%
(99 ± 3)%
(103 ± 5)%
(103 ± 4)%
(103 ± 5)%
(65 ± 36)%
(30 ± 9)%
(92 ± 2)%
(96 ± 4)%
(107 ± 2)%
(61 ± 16)%
(95 ± 17)%
(152 ± 39)%
(112 ± 4)%
(83 ± 30)%
(105 ± 3)%
(56 ± 17)%
(114 ± 0)%
(24 ± 6)%
(104 ± 4)%
(81 ± 14)%
(80 ± 6)%
(58 ± 5)%
(79 ± 19)%
(31 ± 8)%
(76 ± 6)%
(188 ± 40)%
(103 ± 2)%
(53 ± 8)%
(105 ± 2)%
(103 ± 20)%
(97 ± 6)%
(39 ± 6)%
(82 ± 10)%
(45 ± 7)%
(105 ± 3)%
(88 ± 5)%
(74 ± 21)%
(18 ± 6)%
(101 ± 3)%
(76 ± 8)%
(100 ± 5)%
(50 ± 9)%
(117 ± 66)%
(20 ± 12)%
(92 ± 1)%
(55 ± 8)%
(5 ± 5)%
(1 ± 2)%
(1 ± 1)%
n. d.
n. d.
(17 ± 6)%
(2 ± 0)%
(25 ± 12)%
(2 ± 0)%
(2 ± 1)%
(2 ± 1)%
(28 ± 5)%
(9 ± 5)%
(33 ± 4)%
(38 ± 2)%
(10 ± 6)%
(60 ± 38)%
(61 ± 5)%
n. d.
n. d.
(49 ± 13)%
(17 ± 2)%
(8 ± 6)%
(12 ± 1)%
n. d.
(3 ± 1)%
n. d.
n. d.
n. d.
(1 ± 2)%
(68 ± 4)%
(1 ± 2)%
(41 ± 36)%
(69 ± 4)%
(62 ± 15)%
(16 ± 3)%
(62 ± 31)%
(76 ± 3)%
(15 ± 18)%
(58 ± 4)%
(9 ± 9)%
(59 ± 4)%
(46 ± 1)%
(56 ± 12)%
(10 ± 9)%
(61 ± 4)%
(90 ± 5)%
(68 ± 5)%
(104 ± 5)%
(54 ± 9)%
(3 ± 1)%
(59 ± 2)%
(62 ± 24)%
(20 ± 2)%
(46 ± 21)%
(17 ± 4)%
(57 ± 12)%
(8 ± 5)%
n. d.
n. d.
n. d.
(41 ± 3)%
(103 ± 1)%
(67 ± 5)%
(103 ± 2)%
(100 ± 2)%
(102 ± 2)%
(25 ± 7)%
(105 ± 1)%
(69 ± 4)%
(91 ± 18)%
(91 ± 5)%
(48 ± 31)%
(20 ± 9)%
(106 ± 3)%
(52 ± 6)%
(85 ± 1)%
(120 ± 20)%
(113 ± 29)%
(61 ± 9)%
(103 ± 3)%
(55 ± 7)%
(113 ± 3)%
(98 ± 17)%
(105 ± 4)%
(90 ± 3)%
(79 ± 2)%
(84 ± 12)%
(81 ± 11)%
(64 ± 7)%
(68 ± 13)%
(162 ± 53)%
(102 ± 4)%
(85 ± 4)%
(101 ± 4)%
(89 ± 5)%
(99 ± 4)%
(75 ± 2)%
(82 ± 11)%
(122 ± 11)%
(104 ± 4)%
(93 ± 2)%
(40 ± 18)%
(38 ± 8)%
(96 ± 4)%
(83 ± 12)%
(104 ± 4)%
(83 ± 5)%
(90 ± 23)%
(33 ± 7)%
(91 ± 3)%
(52 ± 7)%
Tx GR/Cx
1003/Cs SII 1
(85/105/115)
Carboxen
1018 (570 mg) mg
Cg 5TD/Cx
1003/Cs SII 1
(95/95/140)
mg
(108 ± 3)%
(82 ± 3)%
8%
(116 ± 4)%
0%
(136 ± 5)%
8%
(129 ± 3)%
134%
(86 ± 4)%
71%
(108 ± 3)%
97%
(133 ± 0)%
85%
(108 ± 2)%
127%
(108 ± 5)%
126%
(105 ± 0)%
117%
(129 ± 5)%
148%
(105 ± 3)%
116%
(100 ± 1)%
129%
(91 ± 1)%
111%
(145 ± 6)%
171%
(134 ± 2)%
120%
(118 ± 1)%
87%
(125 ± 5)%
106%
(130 ± 1)%
124%
(80 ± 9)%
(131 ± 28)%
(102 ± 4)%
(110 ± 4)%
(103 ± 5)%
(77 ± 7)%
(66 ± 17)%
(74 ± 1)%
(103 ± 3)%
(101 ± 3)%
(97 ± 4)%
(82 ± 4)%
(102 ± 4)%
(46 ± 13)%
(98 ± 3)%
(102 ± 5)%
(71 ± 28)%
(92 ± 2)%
(88 ± 1)%
9%
(114 ± 5)%
0%
(225 ± 4)%
25%
(153 ± 6)%
106%
(86 ± 1)%
66%
(113 ± 3)%
91%
(115 ± 10)%
87%
(85 ± 5)%
99%
(117 ± 2)%
120%
(110 ± 2)%
108%
(138 ± 4)%
135%
(102 ± 4)%
101%
(100 ± 3)%
107%
(91 ± 6)%
98%
(92 ± 15)%
120%
(113 ± 12)%
86%
(106 ± 1)%
69%
(109 ± 9)%
80%
(130 ± 5)%
98%
Carbotrap
300 (n. a.)
(93 ± 2)%
(11 ± 1)%
(87 ± 1)%
(100 ± 33)%
(189 ± 11)%
(190 ± 3)%
(134 ± 6)%
(148 ± 12)%
(97 ± 1)%
(83 ± 3)%
(92 ± 4)%
(107 ± 6)%
(77 ± 2)%
(73 ± 6)%
(35 ± 2)%
(80 ± 22)%
(99 ± 2)%
(127 ± 2)%
(85 ± 2)%
(117 ± 18)%
(114 ± 3)%
(158 ± 12)%
(83 ± 3)%
(109 ± 12)%
(37 ± 10)%
(93 ± 6)%
(79 ± 2)%
(93 ± 3)%
(86 ± 6)%
(128 ± 9)%
(124 ± 5)%
(119 ± 7)%
(80 ± 1)%
(70 ± 8)%
(94 ± 1)%
(82 ± 12)%
(110 ± 3)%
(95 ± 21)%
M. Richter, E. Juritsch and O. Jann / Journal of Chromatography A 1626 (2020) 461389
Chlorodifluoromethane
Tenax TA
(200 mg)
Carboxen
Carboxen 569 1003
(440 mg)
(365 mg)
(continued on next page)
5
6
Table 3 (continued)
Adsorbent (mass per tube)
Compound
1-Propanol
Diethyl ether
Isoprene
n-Pentane
Vinyl acetate
Chloroform
2-Butanone
Ethyl acetate
2-Methylpentane
Benzene
n-Hexane
Pentanal
Number of retained
compounds in the range
of 80–120% recovery
Water uptake at 50% RH
per sampling volume
(mg H2 O/g adsorbent)
Tenax GR
(240 mg)
Carbograph
Carbopack B
5TD (300 mg) (275 mg)
Carbopack Z
(140 mg)
Carbosieve S
II (500 mg)
Carboxen 569 Carboxen
(440 mg)
1003
(365 mg)
Carboxen
Tx GR/Cx
1018 (570 mg) 1003/Cs SII 1
(85/105/115)
mg
Cg 5TD/Cx
1003/Cs SII 1
(95/95/140)
mg
Carbotrap
300 (n. a.)
(21 ± 1)%
(29 ± 9)%
(62 ± 5)%
(67 ± 5)%
(49 ± 13)%
(93 ± 3)%
(87 ± 3)%
(56 ± 8)%
(79 ± 4)%
(42 ± 9)%
(70 ± 5)%
(75 ± 13)%
(62 ± 5)%
(101 ± 2)%
(108 ± 1)%
(85 ± 3)%
(83 ± 2)%
(87 ± 1)%
(92 ± 1)%
(75 ± 4)%
(76 ± 3)%
(94 ± 87)%
(276 ± 123)%
(97 ± 0)%
(88 ± 2)%
(56 ± 8)%
(80 ± 3)%
11
(87 ± 11)%
(82 ± 8)%
(58 ± 9)%
(80 ± 17)%
(98 ± 1)%
(88 ± 4)%
(102 ± 1)%
(90 ± 4)%
(97 ± 1)%
(80 ± 3)%
(28 ± 18)%
(64 ± 8)%
(97 ± 5)%
(105 ± 1)%
(77 ± 11)%
(84 ± 2)%
(76 ± 10)%
(95 ± 2)%
(96 ± 1)%
(81 ± 1)%
(119 ± 5)%
(127 ± 4)%
(98 ± 1)%
(86 ± 2)%
(39 ± 11)%
(79 ± 4)%
20
(87 ± 4)%
(78 ± 4)%
(50 ± 17)%
(47 ± 13)%
(98 ± 0)%
(88 ± 2)%
(103 ± 1)%
(92 ± 2)%
(98 ± 0)%
(81 ± 2)%
(24 ± 6)%
(38 ± 9)%
(103 ± 0)%
(107 ± 1)%
(81 ± 5)%
(85 ± 1)%
(68 ± 15)%
(92 ± 8)%
(98 ± 0)%
(82 ± 1)%
(103 ± 23)%
(99 ± 2)%
(98 ± 1)%
(87 ± 1)%
(48 ± 1)%
(81 ± 3)%
11
(100 ± 4)%
(100 ± 5)%
(38 ± 5)%
(57 ± 7)%
(74 ± 72)%
(96 ± 1)%
(82 ± 4)%
(57 ± 19)%
(34 ± 3)%
(98 ± 3)%
(85 ± 4)%
(35 ± 24)%
(22 ± 2)%
(104 ± 2)%
(113 ± 2)%
(46 ± 23)%
(37 ± 3)%
(81 ± 7)%
(91 ± 7)%
(93 ± 4)%
(65 ± 4)%
(107 ± 10)%
(97 ± 2)%
(93 ± 5)%
(64 ± 4)%
(13 ± 10)%
(14 ± 5)%
23
(92 ± 4)%
(19 ± 5)%
(61 ± 5)%
(46 ± 56)%
(96 ± 3)%
(39 ± 9)%
(87 ± 10)%
(20 ± 8)%
(98 ± 1)%
(76 ± 5)%
(66 ± 22)%
(12 ± 9)%
(101 ± 4)%
(43 ± 11)%
(77 ± 5)%
(19 ± 9)%
(86 ± 1)%
(49 ± 11)%
(97 ± 0)%
(66 ± 5)%
(120 ± 10)%
(104 ± 2)%
(98 ± 1)%
(52 ± 10)%
(23 ± 6)%
(6 ± 3)%
25
(83 ± 6)%
(25 ± 2)%
(55 ± 4)%
(25 ± 16)%
(97 ± 3)%
(77 ± 4)%
(86 ± 11)%
(58 ± 6)%
(97 ± 2)%
(82 ± 2)%
(40 ± 24)%
(8 ± 2)%
(95 ± 3)%
(72 ± 5)%
(64 ± 15)%
(29 ± 5)%
(84 ± 4)%
(39 ± 8)%
(95 ± 3)%
(75 ± 3)%
(133 ± 43)%
(96 ± 1)%
(96 ± 4)%
(74 ± 5)%
(13 ± 8)%
(10 ± 3)%
24
(92 ± 5)%
(86 ± 28)%
37%
(104 ± 8)%
107%
(114 ± 3)%
94%
(66 ± 10)%
54%
(133 ± 4)%
121%
(69 ± 29)%
64%
(78 ± 8)%
51%
(79 ± 3)%
65%
(98 ± 2)%
92%
(129 ± 3)%
105%
(88 ± 7)%
91%
(106 ± 1)%
102%
(62 ± 25)%
54%
21
(125 ± 1)%
117%
(117 ± 2)%
120%
(115 ± 1)%
107%
(94 ± 2)%
106%
(129 ± 2)%
132%
(94 ± 7)%
98%
(91 ± 1)%
68%
(84 ± 2)%
89%
(97 ± 1)%
98%
(127 ± 1)%
132%
(92 ± 1)%
93%
(104 ± 2)%
115%
(70 ± 8)%
92%
20
(51 ± 17)%
(87 ± 29)%
(102 ± 2)%
(91 ± 27)%
(112 ± 1)%
(138 ± 1)%
(96 ± 1)%
(112 ± 3)%
(125 ± 3)%
(158 ± 4)%
(32 ± 8)%
(117 ± 2)%
(72 ± 4)%
(80 ± 5)%
(83 ± 3)%
(85 ± 1)%
(92 ± 1)%
(113 ± 2)%
(123 ± 2)%
(148 ± 4)%
(97 ± 1)%
(87 ± 2)%
(104 ± 1)%
(112 ± 2)%
(57 ± 4)%
(84 ± 1)%
19
50
1L
9
n. d.
19
1.5
10
n. d.
16
20
5
8.5
11
10.7
19
n. a.
18
n. a.
21
n. a.
3L
5L
n. d.
n. d.
1.7
2.2
n. d.
n. d.
42
62
12.0
14.4
11.6
12.2
n. a.
n. a.
n. a.
n. a.
n. a.
n. a.
0
50
0
50
0
50
0
50
0
50
0
50
0
50
0
50
0
50
0
50
0
50
0
50
0
50
0
(54 ± 3)%
(55 ± 6)%
(32 ± 2)%
(24 ± 1)%
(75 ± 4)%
(86 ± 7)%
(85 ± 3)%
(88 ± 3)%
(40 ± 2)%
(105 ± 19)%
(85 ± 5)%
(59 ± 9)%
5
n. d.: not detectable.
1
measurements under humid conditions carried out without repetition.
(31 ± 9)%
(99 ± 2)%
(104 ± 2)%
(98 ± 2)%
(3 ± 3)%
(103 ± 1)%
(69 ± 6)%
(28 ± 12)%
(97 ± 2)%
(109 ± 9)%
(98 ± 1)%
(34 ± 7)%
15
(51 ± 5)%
(95 ± 3)%
(69 ± 18)%
(97 ± 3)%
(66 ± 30)%
(97 ± 6)%
(63 ± 21)%
(84 ± 3)%
(94 ± 1)%
(104 ± 12)%
(94 ± 3)%
(12 ± 3)%
21
M. Richter, E. Juritsch and O. Jann / Journal of Chromatography A 1626 (2020) 461389
2-Chloro propane
Tenax TA
(200 mg)
M. Richter, E. Juritsch and O. Jann / Journal of Chromatography A 1626 (2020) 461389
7
Fig. 2. Set-up for the determination of the VVOC recovery of the adsorbent tubes.
tively. The calculation of the recovery in% was carried out according to Eq. (1). A tolerance of the recovery of ± 20% around 100%
was permitted as this variation might be resulting from other effects not necessarily related to the sampling, e. g. measurementrelated variations.
The recovery rate was firstly determined under dry conditions
(0% RH of carrier gas) with an injection of 60 μL of the test gas mix
leading to a first selection of potentially suitable adsorbents. These
were then investigated with a humidified carrier gas flow adjusted
at 50% RH, since this degree of humidity is required in the relevant testing standards mentioned in the introduction section. As
the analysis is impacted by humidity, the TD method was adjusted
by switching to the solvent venting dry purge mode. This in turn
led to a decrease of the sensitivity of the analysis, which was compensated by an increase of the injected amount of the test gas mix
to 100 μL. The resulting loading amounts are given in Table 1.
3. Results and discussion
3.1. Stability of gas standards and GCT tightness
As shown in Table 1, for the majority of the compounds the stability expressed by the RSD determined by single injections over 14
days was better than 10%, the maximum was obtained for pentanal
with 47%. Based on the analyses carried out for the experiments,
a satisfying explanation for this result cannot be given. However,
tightness of the GCT and compound stability could be regarded as
sufficient for use of the gas standard for at least 14 days.
3.2. Determination of recovery under dry and humid sampling
conditions
In Table 3, the recovery rates determined for dry and humid air
sampling on single and combined adsorbents are listed. The mean
values and standard deviations of four (dry air) and seven (humidified air) repetitions are given, except for the multi-bed tubes.
Here, the loadings were repeated only three times. For the reference values Ai,ref and AISTD,ref , relative standard deviations (RSD)
between 1 and 8% throughout both measurement series were obtained. From the two ISTD only for benzene-d6 recovery rates
near 100% were obtained on all tested adsorbents. Benzene-d6 was
hence used to compensate variation of measurement performance.
Chromatograms of the analysis of the adsorbents under both sampling conditions are provided in the supplementary material (S1–
S12).
3.2.1. Dry sampling conditions (0% RH)
In view of the amount of retained compounds within the average recovery range of 80–120%, the CMS Carbosieve S II, Carboxen 569 and Carboxen 1003 showed the best retention ability
for the majority of the VVOCs at 0% RH followed by the GCB Carbograph 5TD. The weaker Carbopack B and Tenax GR performed well
for the polar compounds 2-butanone [(85 ± 2)% and (81 ± 5)%],
propanal [(114 ± 12)% and (90 ± 5)%] and Carbopack B for the less
polar compound isoprene (103 ± 1)% compared to the others. Finally, these six adsorbents were selected for further tests under
humid sampling conditions. Although Carboxen 1018 showed as
good recovery rates as the other CMS it was not selected, since sulphur dioxide (SO2 ) is produced in the adsorbent (cf. Section 3.2.5).
3.2.2. Humid sampling conditions (50% RH)
The repetition of the recovery tests under humid sampling conditions revealed a significant impact of water vapour. From the two
Carboxens, the number of retained compounds with average recoveries between 80 and 120% decreased from 25 to 5 for Carboxen
569 and from 24 to 11 for Carboxen 1003. As reported by Vallecillos, Maceira, et al. [23] this may also be linked with the active
sites on the adsorbents’ surfaces covered by water molecules and
is correlating with the relatively high water uptake compared to
the other adsorbents. Moreover, breakthrough volumes of the target compounds can also be affected by the presence of humidity
during the sampling [30]. Carbosieve S II as well showed decreased
retention capacity for some VVOC, however, to a much lower extent (from 23 to 16 compounds) and at a significantly higher water
uptake as observed for the Carboxens. The GCBs Carbopack B, Carbograph 5TD and Tenax GR, which is a mixture of Tenax TA and a
graphitised carbon, are only slightly affected by air humidity corresponding to their low water uptake.
As could be observed, the recovery of some – mainly polar –
compounds increased in presence of water vapour in the supply
air. These are methanol on Carboxen 1003 [increase from (85 ± 1)%
to (120 ± 20)%] and ethyl acetate on Carbopack B [(68 ± 15)% to
(92 ± 8)%] and Carbograph 5TD [(76 ± 10)% to (95 ± 2)%]. For pentanal, which is less polar - and not a VVOC - the recovery increased significantly on Tenax GR [(56 ± 8)% to (80 ± 3)%], Carbopack B [(48 ± 1)% to (81 ± 3)%] and Carbograph 5TD [(39 ± 11)%
to (79 ± 4)%]. Generally, for all adsorbents, dissatisfying recoveries
(< 80%) under humid conditions were observed for chlorodifluoromethane, n-propane, 1,3-butadiene, isopropyl alcohol and vinyl
acetate.
3.2.3. Testing of multi-bed tubes
The high standard deviations of the recovery for a few compounds can either be explained by analytical reasons or by incomplete desorption or breakthrough. Therefore, combinations of
adsorbents should be taken into consideration. Based on the recoveries in Table 3 and under consideration of a relative humidity of 50%, the combinations Carbograph 5TD/Carboxen 1003/Carbosieve SII and Tenax GR/Carboxen 1003/Carbosieve SII were considered for further testing following the procedure described in
8
M. Richter, E. Juritsch and O. Jann / Journal of Chromatography A 1626 (2020) 461389
Section 2.4 and compared to the commercial multi-bed tube Carbotrap 300 (Gerstel, Germany) containing Carbotrap C/Carbotrap
B/Carbosieve SIII.
The results in Table 3 show an improvement of the performance
of the multi-bed tubes compared to the single adsorbents. However, there is no significant difference between the combinations
identified in this study compared to the commercial tube. Furthermore, the results are comparable to the recoveries determined for
Carbograph 5TD, which is part of one multi-sorbent tube tested. It
is noticeable that the polar VVOC methanol is not retained apart
from Carbotrap 300, although its very good recovery determined
on both Carbosieve S II and Carboxen 1003. Since the assumption
can be made that the adsorbents in combination will complement
each other, optimisation might be obtained by adapting the bed
lengths.
3.2.4. Water management
For an efficient measurement method, water management is
highly recommended. Some authors propose the use of pre-tubes
filled with drying agents, e.g. CaCl2 or Nafion® [14,23,24,26]. However, since these might serve as adsorbents themselves, losses at
non-targeted analysis might be the result. Pollmann, Helmig, et al.
[31] used a Peltier-cooled, regenerable water trap inserted into the
sample flow to condensate water prior to analysis. Dry-purging of
the adsorbents would also be an option [14]. During the research
for this study, good experiences were made with the solvent venting dry-purge mode of the thermal desorption system, which indeed led to reduced sensitivity of measurement, but which could
be compensated with an enhanced sample amount (Table 1). However, to obtain a reliable measurement method, more efforts must
be made to solve the humidity issue.
3.2.5. Chemical reactions
Although Carboxen 1018 showed as good recovery rates as the
other CMS it was not selected, since sulphur dioxide (SO2 ) is produced in the adsorbent giving a large peak at the beginning of the
chromatogram impacting the analysis. The same was also observed
in the other Carboxen type sorbents but to a much lower extent.
The SO2 peak disappeared or reduced at least to a negligible area
after the tube was thermally handled prior to use (∼ 20 °C above
recommended desorption temperature). Although the test gas mixture was containing CS2 , there was no significant indication for it
to trigger any reaction, since SO2 was also occurring in the blank
measurements. However, Brown and Shirey [32] reported that the
formation of SO2 or CO2 is common to most carbon molecular
sieves, and does not pose a problem unless the user is trying to
sample for these two analytes. They do not explain why the formation of these molecules takes place but Boehm [33] reports that
surface oxides inherent to carbon materials decompose to CO2 and
CO on heating to high temperatures and that highly reactive sites
remain on the carbon surface. After cooling to room temperature,
they can react with oxygen (air) or even water vapour, giving new
surface oxides. It can be assumed that this mechanism is also responsible for the oxidation of sulphur, inherently occurring in carboxen type adsorbents, which are produced from sulfonated polymers [34]. Since the group of the VVOC contains highly reactive
compounds, a close look into the occurrence of chemical reactions in the employed adsorbents must be taken. Some insight into
this already is given in the literature, e.g. in Schieweck, Gunschera,
et al. [18].
Moreover, for some single adsorbents but particularly for the
multi-bed combinations recoveries greater than the tolerated 120%
for some compounds were determined. These observations can
only partially be explained as the blank measurements carried
out prior to loading revealed blank values for some components
that even did not decrease after repeated desorption. Artefacts or
residues of propene and n-propane were found on Carbosieve S II
as well as on Carbotrap 300 together with n-butane. Tenax GR and
Carbograph 5 TD showed high benzene blanks, whereupon artefact formation of benzene in Tenax adsorbents is well known. Artefact formation might furthermore be promoted by the presence of
water. However, detailed investigations on this issue are necessary
and objective of ongoing work. A suitable method for this might be
the standard elevation method to get indication on matrix effects.
Chromatograms of blank measurements of each adsorbent are
added to the supplementary material (S13–S24).
4. Conclusions
The recovery rates of 29 VVOC and three VOC in nine different
adsorbent materials (porous polymers, GCB and CMS) were determined. The recovery calculation was obtained by direct and, hence,
unaffected measurement of the gas standard mixture. This way,
any effects that might be resulting from interactions of the test
sample molecules with the adsorbent, e.g. breakthrough phenomena, insufficient desorption or chemical reactions are considered
and evaluated.
Sampling performance is strongly affected by water vapour in
the sample air. A comparison between dry (0% RH) and humid
(50% RH) sampling conditions revealed that the number of retained
VVOC with average recoveries between 80 and 120% dropped significantly for the CMS Carboxen 569 and Carboxen 1003 compared
to the recoveries under dry sampling conditions. This was furthermore well correlating with the relatively high water uptake compared to the other adsorbents. Water management measures are
therefore highly recommended. In this context, the common practice of calibration with liquid standard solutions followed by flushing with a dry inert gas flow should be rethought. Due to the obvious impact of air humidity leading to lower adsorption capacity
particularly of the GCB and CMS, underestimations during analysis
are likely.
Chemical reactions in the carbon-based adsorbents themselves
or surface reactions with analytes might be a problem. In this
study, the generation of SO2 in the CMS and particularly in Carboxen 1018 was observed. This can be a problem when analytes of
interest elute with the same retention time or close to it.
For the measurement of complex gas samples, combinations of
adsorbents should be used. With the procedure described here, the
combinations Carbograph 5TD/Carboxen 1003/Carbosieve SII and
Tenax GR/Carboxen 1003/Carbosieve SII were identified to be potentially suitable. The improvement of the performance compared
to the single adsorbents particularly under humid sample conditions could be shown. The comparison with a commercial tube
revealed no significant difference. However, one third of the target analytes could not be satisfyingly retained so that potential for
optimisation can be seen in the adaptation of the adsorbent bed
lengths.
Future research should focus on investigations on the optimum
composition of multi-bed sampling tubes, the recovery under realistic sampling conditions, also including the always present VOC
and SVOC, possible chemical reactions, storage effects (compounds
migration between sorbent beds) and the loss-free water management. These items are objectives of a research project recently
started and funded by the German Environment Agency (UBA). Its
outcome will be published in a forthcoming paper.
Declaration of Competing Interest
The authors declare that they have no known competing financial interests or personal relationships that could have appeared to
influence the work reported in this paper.
M. Richter, E. Juritsch and O. Jann / Journal of Chromatography A 1626 (2020) 461389
CRediT authorship contribution statement
Matthias Richter: Conceptualization, Methodology, Formal
analysis, Supervision, Writing - original draft. Elevtheria Juritsch:
Methodology, Investigation, Formal analysis, Writing - review &
editing. Oliver Jann: Conceptualization, Resources, Writing - review & editing.
Acknowledgements
This research did not receive any specific grant from funding
agencies in the public, commercial, or not-for-profit sectors. The
authors would like to thank Timo Juritsch for proofreading the
manuscript.
Supplementary materials
Supplementary material associated with this article can be
found, in the online version, at doi:10.1016/j.chroma.2020.461389.
References
[1] P. Wolkoff, Indoor air pollutants in office environments: assessment of comfort,
health, and performance, Int. J. Hyg. Envir. Heal 216 (2013) 371–394.
[2] P. Burge, Sick building syndrome, Occup. Environ. Med. 61 (2004) 185–190.
[3] ISO, Indoor air - Part 6: determination of volatile organic compounds in indoor
and test chamber air by active sampling on Tenax TA® sorbent, thermal desorption and gas chromatography using MS/FID (ISO 160 0 0-6:2011)International
Organization for Standardization, Beuth, Berlin, 2011.
[4] ISO, Indoor air – Part 9: determination of the emission of volatile organic
compounds from building products and furnishing - emission test chamber method (ISO 160 0 0-9:20 06)International Organization for Standardization,
Beuth, Berlin, 2006.
[5] ISO, Indoor air - Part 11: determination of the emission of volatile organic
compounds from building products and furnishing - sampling, storage of samples and preparation of test specimens (ISO 160 0 0-11:20 06)International Organization for Standardization, Beuth, Berlin, 2006.
[6] ISO, Indoor Air - Part 3: determination of formaldehyde and other carbonyl
compounds - active sampling method (ISO 160 0 0-3:2011)International Organization for Standardization, Beuth, Berlin, 2011.
[7] ENConstruction Products - Assessment of Release of Dangerous Substances Determination of Emissions Into Indoor Air (EN 16516:2017), Beuth, Berlin,
2017.
[8] ECAECA report no. 27 - Harmonisation framework for indoor products labelling
schemes in the EU, European Collaborative Action, Publications Office of the
European Union, Luxembourg, 2012.
[9] ECAECA report no. 29 - Harmonisation framework for health based evaluation
of indoor emissions from construction products in the European Union using
the EU-LCI concept, Publications Office of the European Union, Luxembourg,
2013.
[10] ECAReport No 24 - Harmonisation of indoor material emissions labelling systems in the EU, European Collaborative Action, Publications Office of the European Union, Luxembourg, 2005.
[11] EU, Agreed EU-LCI values, in, 2018.
[12] E. Gallego, F.J. Roca, J.F. Perales, X. Guardino, Comparative study of the adsorption performance of a multi-sorbent bed (Carbotrap, Carbopack X, Carboxen
569) and a Tenax TA adsorbent tube for the analysis of volatile organic compounds (VOCs), Talanta 81 (2010) 916–924.
9
[13] K. Dettmer, W. Engewald, Adsorbent materials commonly used in air analysis for adsorptive enrichment and thermal desorption of volatile organic compounds, Anal. Bioanal. Chem. 373 (2002) 490–500.
[14] E. Woolfenden, Sorbent-based sampling methods for volatile and semi-volatile
organic compounds in air. Part 2. Sorbent selection and other aspects of optimizing air monitoring methods, J. Chromatogr. A 1217 (2010) 2685–2694.
[15] ISO, Indoor, ambient and workplace air - Sampling and analysis of volatile organic compounds by sorbent tube/thermal desorption/capillary gas chromatography - Part 1: pumped sampling (ISO 16017-1:20 0 0)International Organization for Standardization, Beuth, Berlin, 20 0 0.
[16] I. Camsco, Camsco Sorbent Selection Chart, in, 2009.
[17] T. Salthammer, Very volatile organic compounds: an understudied class of indoor air pollutants, Indoor Air 26 (2016) 25–38.
[18] A. Schieweck, J. Gunschera, D. Varol, T. Salthammer, Analytical procedure for
the determination of very volatile organic compounds (C3–C6) in indoor air,
Anal. Bioanal. Chem. 410 (2018) 3171–3183.
[19] A. Pech, O. Wilke, W. Horn, O. Jann, Analysis of very volatile organic compounds (VVOC) with thermal desorption GC–MS, in: Indoor Air 2016 - The
14th International Conference on Indoor Air Quality and Climate, Ghent, Belgium, 2016, p. 2.
[20] D. Helmig, N. Schwarzer, J. Steinhanses, Flame control accessory for GC-FID operation with autosampler injection, J. High Res. Chromatog. 13 (1990) 849–851.
[21] F. Stoeckli, T. Jakubov, A. Lavanchy, Water adsorption in active carbons described by the Dubinin–Astakhov equation, J. Chem. Soc. Faraday Trans. 90
(1994) 783–786.
[22] J. Koziel, M.Y. Jia, J. Pawliszyn, Air sampling with porous solid-phase microextraction fibers, Anal. Chem. 72 (20 0 0) 5178–5186.
[23] L. Vallecillos, A. Maceira, R.M. Marce, F. Borrull, Evaluation of active sampling
strategies for the determination of 1,3-butadiene in air, Atmos. Environ. 176
(2018) 21–29.
[24] A. Maceira, L. Vallecillos, F. Borrull, R.M. Marce, New approach to resolve the
humidity problem in VOC determination in outdoor air samples using solid adsorbent tubes followed by TD-GC-MS, Sci. Total Environ. 599 (2017) 1718–1727.
[25] G.K.S. Wong, S.J. Ng, R.D. Webster, Quantitative analysis of atmospheric volatile
organic pollutants by thermal desorption gas chromatography mass spectrometry, Anal. Methods-UK 5 (2013) 219–230.
[26] P. Ciccioli, A. Cecinato, E. Brancaleoni, M. Frattoni, A. Liberti, Use of carbon
adsorption traps combined with high resolution gas chromatography – mass
spectrometry for the analysis of polar and non-polar C4-C14 hydrocarbons involved in photochemical smog formation, Separ. Sci. 15 (1992) 75–84.
[27] V.M. Brown, D.R. Crump, An investigation into the performance of a multi-sorbent sampling tube for the measurement of VVOC and VOC emissions from
products used indoors, Anal. Methods-UK 5 (2013) 2746–2756.
[28] A. Pech, O. Wilke, B. Mull, W. Horn, O. Jann, Development of a TDS-GC-FID
method for the determination of methanol and ethanol in air, Gefahrst Reinhalt L 73 (2013) 477–482.
[29] K. Dettmer, T. Knobloch, W. Engewald, Stability of reactive low boiling hydrocarbons on carbon based adsorbents typically used for adsorptive enrichment
and thermal desorption, Fresen. J. Anal. Chem. 366 (20 0 0) 70–78.
[30] D. Helmig, L. Vierling, Water adsorption capacity of the solid adsorbents Tenax
TA, Tenax GR, Carbotrap, Carbotrap C, Carbosieve SIII, and Carboxen 569 and
water management techniques for the atmospheric sampling of volatile organic trace gases, Anal. Chem. 67 (1995) 4380–4386.
[31] J. Pollmann, D. Helmig, J. Hueber, D. Tanner, P.P. Tans, Evaluation of solid adsorbent materials for cryogen-free trapping - gas chromatographic analysis of
atmospheric C2-C6 non-methane hydrocarbons, J. Chromatogr. A 1134 (2006)
1–15.
[32] J. Brown, B. Shirey, Technical Report - A Tool for Selecting an Adsorbent for
Thermal Desorption Applications, Supelco (2001) 36.
[33] H.P. Boehm, Surface oxides on carbon and their analysis: a critical assessment,
Carbon N Y 40 (2002) 145–149.
[34] Y. Juillet, S. Le Moullec, A. Begos, B. Bellier, Optimisation of sorbent trapping and thermal desorption-gas chromatography-mass spectrometric conditions for sampling and analysis of hydrogen cyanide in air, Analyst 130 (2005)
977–982.