Algorithms to optimize multi-column chromatographic separations of proteins
Bạn đang xem bản rút gọn của tài liệu. Xem và tải ngay bản đầy đủ của tài liệu tại đây (1.43 MB, 6 trang )
Journal of Chromatography A 1637 (2021) 461838
Contents lists available at ScienceDirect
Journal of Chromatography A
journal homepage: www.elsevier.com/locate/chroma
Algorithms to optimize multi-column chromatographic separations of
proteins
Santiago Codesido a,b, Davy Guillarme a,b, Szabolcs Fekete a,b,∗
a
b
Institute of Pharmaceutical Sciences of Western Switzerland (ISPSO), University of Geneva, CMU-Rue Michel Servet 1, 1211, Geneva 4, Switzerland
School of Pharmaceutical Sciences, University of Geneva, CMU-Rue Michel Servet 1, 1211, Geneva 4, Switzerland
a r t i c l e
i n f o
Article history:
Received 28 September 2020
Revised 17 December 2020
Accepted 19 December 2020
Available online 23 December 2020
Keywords:
Column coupling
On-column fractioning
Optimization
Multi-isocratic elution
Monoclonal antibody
Protein analysis
a b s t r a c t
The goal of this work was to provide a technical solution for the automated optimization of multi-column
systems for protein separation and fractionation. Both algorithm and a software that can be downloaded
are provided. In this algorithm, the length and order of the individual column segments can be considered. Various solutions are provided by the algorithm, including i) to obtain uniform peak distribution, ii)
to park the different species at the inlet of the individual column segments, and iii) to elute all species
as a single peak.
Two representative examples are presented, showing the possibility to obtain uniform selectivity between
monoclonal antibody (mAb) sub-units, and the on-column fractioning of intact mAbs.
1. Introduction
To improve the separation of complex mixtures, a possible solution is the modulation of the stationary phase through serial
coupling of different columns having different chemistries [1]. The
most common way of using tandem columns consists of connecting two or more different columns directly in series and running
the same mobile phase – either isocratic or gradient – through
the entire coupled system. This column setup is often referred
to as “serially coupled columns (SCC)”, “multi-segment columns”
or “stationary phase optimized selectivity liquid chromatography
(SOSLC)” [1–3]. The serial column coupling approach has been
commercialized under the name of POPLC (phase optimized liquid
chromatography, provided by Bischoff Chromatography), and studies have reported the possible increase in selectivity resulting in
improved separation quality, compared to the use of a single column [4,5,6]. Besides the development of analytical procedures, SCC
was also applied in preparative chromatography to separate complex multi-component mixtures [5].
Conventional columns available in laboratories possess a discrete length (e.g. 50, 100 or 150 mm). However, the possibility of
coupling multiple combinations of columns having various lengths
can further improve the selectivity of a given separation. As an ex-
∗
© 2020 The Author(s). Published by Elsevier B.V.
This is an open access article under the CC BY-NC-ND license
( />
ample, this additional variable (length of a given column segment)
can be handled with the commercialized POPLC system, where a
given phase chemistry is available in 10, 20, 40, 60 and 80 mm
long segments [6,7].
A few approaches have been suggested to optimize the stationary phase combinations [4,7]. An important difference compared
to mobile phase optimization is that stationary phase is a discrete
factor and cannot be varied arbitrarily. Those works demonstrated
that serial coupling of columns introduce new degrees of freedom,
such as the type, number, relative length and the order of the individual columns [2,8]. However, the full benefit of such coupling
is only taken through the interpretive optimization of both the column nature and length, along with the elution conditions. Important early works have been done in multi-column optimization by
Glajch et al., Lukulay and McGuffin [9–11]. Later, - with the commercial introduction of the POPLC system – a software package has
been developed for the optimization of coupled column systems
[2,6]. This approach is mostly applied in isocratic elution mode
however linear gradient optimization is also feasible. Detailed algorithms have been described in several reports [2,3,7,12–15].
It is worth mentioning that coupling columns of the same
chemistry (increasing column length) is also feasible and can be
beneficial, since the achievable kinetic performance can be improved (high resolution separations) through additional plate numbers. Then, the so called kinetic plot method is a helpful approach
Corresponding author.
E-mail address: (S. Fekete).
/>0021-9673/© 2020 The Author(s). Published by Elsevier B.V. This is an open access article under the CC BY-NC-ND license
( />
S. Codesido, D. Guillarme and S. Fekete
Journal of Chromatography A 1637 (2021) 461838
Let us set the linear velocity of the mobile phase to a speed v0
(which can either be measured or easily derived from the flow rate
and column void volume). It is then convenient to consider not
the times for the different positions of the compound, but rather
their delay (τ ) with respect to where they would be if they were
moving together with the solvent:
to maximize performance (plate count, peak capacity) in the shortest possible analysis time [16–18].
Liquid chromatography (LC) is commonly used for both the analytical characterization and purification of innovative protein-based
drugs such as monoclonal antibodies (mAbs). However, LC separations often suffer from inadequate resolving power for closely
related proteins (large solutes). Very recently a column-coupling
approach was proposed to improve both the selectivity and efficiency of protein separations compared to a single column separation [19]. The idea is to couple columns possessing different selecivity in the order of their increasing retentivity. Then, applying the
newly developed “multi-isocratic” elution mode opens the way either to improve separation or to perform uniform peak distribution
(obtaining an equidistant spacing between the peaks) [20]. Such
elution mode consists in the combination of binding isocratic segments and eluting steep short gradient segments. Furthermore, it
is also possible to park the different protein species on the head
of the different column segments applying isocratic condition and
thus to perform online on-column fractioning in a very short analysis time and without sample dilution. The peaks of interest could
be eluted with any gradient program from the selected column
segments [20]. In this new approach, columns maintaining the elution order of the peaks but providing difference between their absolute retentivity are required.
The purpose of this work was to study the possibilities of this
multi-column system for protein separation and fractionation. Algorithms were developed to optimize such multi-column system
considering both the length and order of the individual column
segments. The purpose of the optimization can be either to obtain
equidistant spacing between the peaks (1), to park the different
species at the inlet of the individual column segments (on-column
fractioning) (2) or to elute all species as a single peak (3). The procedure and representative examples are presented and discussed
below.
τ =t−
(2)
Since the speed at which the compound moves is:
v=
dz
v0
=
dt
1+k
(3)
the equivalent “speed” for the position z with respect to the delay
τ is:
dz
v0
=
dτ
k
(4)
This allows computing the positions for a certain compound C with the following algorithm: positions = LIST(0),
times = LIST(0) step = 1, column = 1, event = 1 z = 0, tau = 0
next_column_position = L_1 next_step_tau = t_{step,1}
WHILE column <= Ncol phi = φstep
k · = · exp{logkw,C,column − phi SC,column } speed_factor = k /
v0 next_column_remaining_distance = next_column_position – z
next_step_remaining_tau = next_step_tau – (tau IF step <= Nsteps
ELSE ∞)
∗
IF
next_column_remaining_distance
speed_factor
<
next_step_remaining_tau z += next_column_remaining_distance
tau += next_column_remaining_distance ∗ speed_factor column
+= 1
IF column <= N_col next_column_position += L_column
ELSE z += next_step_remaining_tau / speed_factor tau +=
next_step_remaining_tau step += 1 next_step_tau = tstep,step
APPEND z TO positions
APPEND tau + z / v0 TO times retention_time = LAST(times)
RETURN positions, times, retention_time
The loop goes on until the last column is reached, so that the
last element in the positions list will always be the total length of
the columns, and the last time the observed retention time tR,C for
the compound.
The optimization step involves the computation of a target
function M to be minimized. We have considered three alternatives. First, achieving uniform peak distribution between the peaks
that can be defined by the minimization of:
2. Theory
2.1. Algorithm to optimize a multi-column separation
The theoretical cornerstone of the optimizer is the well-known
Linear Solvent Strength (LSS) model, that describes the retention
(k) of a certain compound (C) experiences in a mobile phase with
volume fraction (φ ) of a strong eluting solvent:
k = kw e−S φ
z
v0
(1)
M=
where kw and S are intrinsic properties of the compound determined by the mobile phase, temperature and column [21].
Assume now that we have a collection of compounds ranging
from C = 1 . . . Ncomp , and a series of coupled columns indexed by
column = 1 . . . Ncol , whose lengths are given by L j . If we apply a
multi-isocratic gradient, characterized by step = 1 . . . Nsteps steps of
constant solvent compositions (isocratic segments), then we can
further characterize them by their ending times tstep,k and solvent
volume fractions φk , plus the final solvent fraction φend that is normally used to wash out (elute) the solutes from the column.
The migration speed of a given compound will be constant
as long as it does not change columns, or for as long as it is
not overtaken by the front of a solvent composition change. This
means that we can describe its trajectory inside the column as
linear functions between a list of “event” points (tm , zm ) marking
the occurrence of either a column change or a solvent composition change, with tm denoting the time at which it occurs, and zm
the overall position along the system of coupled columns (where
m counts the velocity changes of the compound, either due to a
change of column or of gradient step).
Ncomp
t0 + C
C=1
tmax − t0
− tR,C
Ncomp
2
(5)
where t0 is the dead time and tmax is the desired run time.
Another option, useful for fixed gradient step times, is to use
each step to expel the compounds in a single peak from the setup.
This can be achieved by minimizing the delay between the i-th
step and the i-th compound,
M=
Ncomp
C=1
tstep,C − tR,C
2
(6)
which of course requires to have at least as many gradient steps as
compounds.
Finally, we can also optimize the setup for parking a compound
at a column (to perform on-column fractioning), that is, to stop
the i-th compound on the i-th column. This can be achieved by
penalizing the time spent in the previous columns (to accelerate
its passing as much as possible) and rewarding the time spent in
the target column.
M=−
2
Ncomp
C=1
(2 (time in col.C ) − (time in cols.before C ) )
(7)
S. Codesido, D. Guillarme and S. Fekete
Journal of Chromatography A 1637 (2021) 461838
Fig. 1. Solver configuration.
Again, this requires having at least as many columns as target
compounds.
The parameters over which we want to optimize these functions are the step times and volume fractions, tstep,k and φk . Of
course, none of the three versions of the minimization target M
can be written in a closed form, even less in one that allows us to
find an explicit solution for its minimum. Instead, we opt to use
a combination of the gradient descent method and Monte Carlo
methods. The former computed the numerical derivate of the target function with respect to the parameters, and modifies them in
small steps in the direction that best minimizes the result. Because
this is prone to getting the parameters trapped in “false solutions”
(i.e. locally optimal, but not globally), we add the Monte Carlo step,
in which we try random variations of a random number of parameters. If this improves the solution, the algorithm jumps to it.
Both the speed of the gradient descent and the randomness of the
Monte Carlo part can be controlled by parameters of the optimization algorithm.
This kind of algorithm is widely used for numerical problems.
An important addition to our program, for the specific purposes
of chromatographic gradient optimization, is giving visual feedback
of the process directly as it happens. While the optimization algorithm can be fine-tuned to achieve good solutions more consistently, it is important to allow the user to insert their knowledge about their particular system at any point. If the optimization
seems to be getting stuck in a suboptimal solution (for example by
trying to elute a more retentive compound before another) the interface allows to stop the process, assess the situation by displaying the compound trajectories and gradient configuration, manually change any parameter, and resume the process from there.
2.2. Interface of the LC multicolumn optimizer
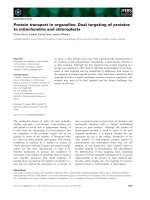
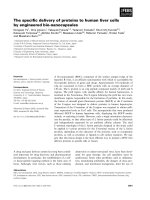
The interface first asks for the basic configuration – substance
names, columns lengths, LSS model parameters, column void volume, run time and initial values for the solver. The initial values (max_logk, step_phis, step_times, end_phi and run_time) are
based on our experimental experiences observed with therapeutic
proteins (antibody related proteins) in reversed phase liquid chromatography (RPLC). Those values are reasonable for most mAb separations but can be changed arbitrary. Fig. 1 shows the solver configuration.
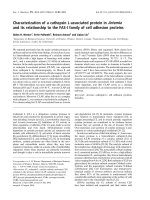
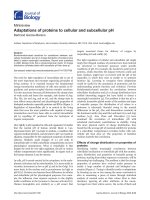
Once this is done, the interface displays two plots, with the trajectories of each compound along the columns on the left, and the
gradient steps on the right.
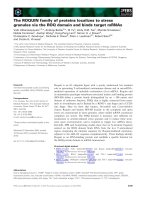
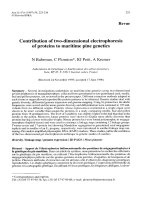
Figs. 2 and 3 show two possible solutions suggested by the program. On the interface of the optimizer, the left side Time/Position
plot shows the movement of the compounds through the columns.
The blue lines represent each compound, the vertical lines correspond to the joints between the columns, while the nearlyhorizontal thin black lines are the gradient step fronts as they advance through the columns. The right side plot shows as a black
line the value of the gradient steps ( , phi) as a function of the
time at which they arrive at the inlet, and as vertical blue lines
the retention times of each compound minus the dead time. Please
note how in “parking” mode a single value of φ is found (isocratic
elution) that keeps each of the three compounds stopped inside
of each column. The software has been made available to everyone and can be downloaded from the following address: https:
//ispso.unige.ch/labs/fanal/lc_multicolumn_optimizer
3
S. Codesido, D. Guillarme and S. Fekete
Journal of Chromatography A 1637 (2021) 461838
Fig. 2. Solution in “max separation” mode (to obtain uniform peak distribution).
Fig. 3. Solution in “parking” mode (to perform on-column fractioning).
4
S. Codesido, D. Guillarme and S. Fekete
Journal of Chromatography A 1637 (2021) 461838
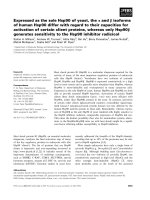
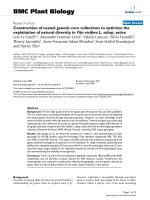
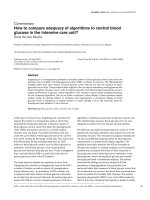
Fig. 4. Finding condition to obtain equidistant spacing between antibody fragment peaks (uniform peak distribution) on a three column system within 10 minute analysis
time, running a multi-isocratic elution program.
3. Case studies
3.1. Setting uniform peak distribution between mAb fragment species
A typical application of mAb analysis is the separation of antibody fragments [22]. This case study shows an example on the
optimization of the separation of three subunits of daratumumab,
namely the (1) fragment crystallizable unit (Fc), the (2) light chain
(Lc) and the (3) heavy chain fragment of the antigen binding unit
(Fd).
The LSS model parameters were first determined for the Fc
fragment (logkw = 11.67, 15.82, 18.20, S = 42.46, 46.82, 49.31),
Lc fragment (logkw = 17.88, 21.91, 24.37, S = 52.13, 54.81, 57.60)
and the Fd fragment (logkw = 23.68, 27.24, 29.78, S = 60.24, 63.30,
66.19) – for three RPLC columns providing the largest difference
in retentivity. (The LSS parameters have been determined experimentally on individual wide pore C4, C18 and diphenyl stationary phases, running acetonitrile-water gradients with 0.1% trifluoroacetic acid as mobile phase additive and at T = 80 °C column
temperature.) We assumed three column segments of 5 cm and
a desired analysis time of 10 minutes. Then, we were interested
in finding a separation attaining uniform peak distribution within
the set time window (10 min). Thus, we selected the “max separation” mode (on the interface of our software, this option corresponds to obtain uniform peak distribution) and ran the solver.
It found the following elution program: 0 min ( φ = 0.088), 2.44
min (φ = 0.448), 3.32 min (φ = 0.464), 5.81 min (φ = 0.485)
and 7.34 min (φ = 1). Fig. 4 A shows the set φ values vs. time
(black curve) and the expected retention times of the three solutes (blue horizontal lines). Another visualization of the results is
presented in Fig. 4 B where the elution time program is plotted
as a function of the distance migrated along the coupled system.
The blue lines show where the compounds are located at a certain
time. It seems that none of the solutes start migration with the
initial mobile phase composition (φ = 0.088). Then, when setting
φ = 0.448 (at 2.44 min), the least retained solute is suddenly desorbed and has not enough retention to be adsorbed along the entire coupled column system and thus is released and elutes with
the dead time (t0 ) of the coupled system (tr = 2.44 min + t0 ).
The second compound is also released from the first column and,
when entering the second column it will be slightly retained (position between 5 and 10 cm). After that – within this same elu-
Fig. 5. Optimizing on-column online fractioning of three intact mAbs on a threecolumn system.
tion step (between 2.44 and 3.32 min), it enters the third column too where it becomes highly retained (steep slope on the
blue curve just after 10 cm corresponds to a decrease in migration speed). At 3.32 minutes, when setting φ = 0.464, its retention
decreases significantly and it leaves the third column at 4.8 minutes. For the third (most retained) solute, it is practically fully retained on the first column until setting φ = 0.485 (at 5.81 min).
With such mobile phase composition, it starts migrating, but travels only about 1 cm along the first column (till 7.34 min). At
the end, when setting φ = 1 (at 7.34 min), it becomes fully desorbed and just migrates through the whole system with the mobile phase velocity and reaches suddenly the outlet of the third
column.
3.2. Performing on-column fractioning of intact mAbs (peak parking)
In this case, columns were coupled in their order of increasing
retentivity and an isocratic mobile phase composition had to be
5
S. Codesido, D. Guillarme and S. Fekete
Journal of Chromatography A 1637 (2021) 461838
found to send the different solutes to the different column segments (one solute per column), whilst parking them (providing
very high retentivity) at the inlet of their corresponding column
segment.
In this example, our purpose was to fractionate three intact
mAbs on three columns of a serially coupled system. The LSS
model parameters were first determined for mAb 1 (logkw = 36.8,
44.3, 34.3, S = 109.1, 129.4, 96.4), mAb 2 (logkw = 35.1, 57.5,
46.0, S = 101.3, 163.6, 126.3) and mAb 3 (logkw = 29.4, 43.9,
40.5, S = 80.2, 117.1, 105.2) – for three RPLC columns (the same
columns and mobile phase were used as described in section
3.1). We assumed two 5 cm long columns and one 10 cm long
column, with a total run time of 5 minutes. Accordingly, we
selected the “parking” mode and run the solver. It was found
that φ = 0.335 provides a good solution and we only need
to wait 0.6 minute to distribute the three solutes on different
columns (Fig. 5). At 0.6 minute, the most retained compound
was strongly retained (parked) on the first column segment, the
second compound just reaches the second column’s inlet, while
the least retained compound migrates through the first and second segments and will be highly retained (parked) on the third
column.
References
[1] T. Alvarez-Segura, J.R. Torres-Lapasio, C. Ortiz-Bolsico, M.C. García-AlvarezCoque, Stationary phase modulation in liquid chromatography through the
serial coupling of columns: A review, Anal. Chim. Acta 923 (2016) 1–23,
doi:10.1016/j.aca.2016.03.040.
[2] S. Nyiredy, Z. Szücs, L.S zepesy, Stationary phase optimized selectivity liquid
chromatography: basic possibilities of serially connected columns using the
“PRISMA” principle, J.Chromatogr 1157 (2007) 122–130, doi:10.1016/j.chroma.
2007.04.041.
[3] K. Chen, F. Lynen, M. De Beer, L. Hitzel, P. Ferguson, M. Hanna-Brown, P. Sandra, Selectivity optimization in green chromatography by gradient stationary phase optimized selectivity liquid chromatography, J. Chromatogr. A 1217
(2010) 7222–7230, doi:10.1016/j.chroma.2010.09.029.
[4] M. De Beer, Development of gradient stationary phase optimized selectivity
approaches for improved method development in high performance liquid
chromatography, University of Ghent, Belgium, 2015 PhD thesis.
[5] A. Sreedhar, A. Seidel-Morgenstern, Preparative separation of multicomponent
mixtures using stationary phase gradients, J. Chromatogr. A 1215 (2008) 133–
144, doi:10.1016/j.chroma.20 08.11.0 03.
[6] K. Bischoff, S. Nyiredy, Z. Szücs, Elements for separating substances by distributing between a stationary and a mobile phase, and method for the production of a separating device, 2006 WO/2006/125564; PCT/EP2006/004744.
[7] C. Ortiz-Bolsico, J.R. Torres-Lapasio, M.J. Ruiz-Angel, M.C. García-Alvarez-Coque,
Comparison of two serially coupled column systems and optimization software
in isocratic liquid chromatography for resolving complex mixtures, J. Chromatogr. A 1281 (2013) 94–105, doi:10.1016/j.chroma.2013.01.064.
[8] J. Lu, M. Ji, R. Ludewig, G.K.E. Scriba, D.Y. Chen, Application of phase optimized
liquid chromatography to oligopeptide separations, J. Pharm. Biomed. Anal. 51
(2010) 764e767, doi:10.1016/j.jpba.2009.09.036.
[9] H.J. Issaq, J. Gutierrez, Mixed packings in high performance liquid chromatography: II. mixed packings vs. mixed ligands, J. Liq. Chromatogr. 11 (1988) 2851–
2861, doi:10.1080/01483918808076765.
[10] J.L. Glajch, J.C. Gluckman, J.G. Charikofsky, J.M. Minor, J.J. Kirkland, Simultaneous selectivity optimization of mobile and stationary phases in RPLC for
isocratic separations of phenylthiohydantoin amino acid derivatives, J. Chromatogr. 318 (1985) 23–39, doi:10.1016/S0021-9673(01)90661-2.
[11] P.H. Lukulay, V.L. McGuffin, Solvent modulation in liquid chromatography: extension to serially coupled columns, J. Chromatogr. A 691 (1995) 171–185,
doi:10.1016/0021-9673(94)01184-G.
[12] M. De Beer, F. Lynen, K. Chen, P. Ferguson, M. Hanna-Brown, P. Sandra,
Stationary-phase optimized selectivity liquid chromatography: development
of a linear gradient prediction algorithm, Anal. Chem. 82 (2010) 1733–1743,
doi:10.1021/ac902287v.
[13] C. Ortiz-Bolsico, J.R. Torres-Lapasio, M.C. García-Alvarez-Coque, Simultaneous
optimization of mobile phase composition, column nature and length to analyse complex samples using serially coupled columns, J. Chromatogr. A 1317
(2013) 39–48, doi:10.1016/j.chroma.2013.06.035.
[14] C. Ortiz-Bolsico, J.R. Torres-Lapasio, M.C. García-Alvarez-Coque, Optimisation of
gradient elution with serially-coupled columns. part I: single linear gradients,
J. Chromatogr. A 1350 (2014) 51–60, doi:10.1016/j.chroma.2014.05.017.
[15] C. Ortiz-Bolsico, J.R. Torres-Lapasio, M.C. García-Alvarez-Coque, Optimisation of
gradient elution with serially-coupled columns. part II: multi-linear gradients,
J. Chromatogr. A 1373 (2014) 51–60, doi:10.1016/j.chroma.2014.10.100.
[16] D. Cabooter, F. Lestremau, F. Lynen, P. Sandra, G. Desmet, Kinetic plot method
as a tool to design coupled column systems producing 10 0,0 0 0 theoretical
plates in the shortest possible time, J. Chromatogr. A 1212 (2008) 23–34,
doi:10.1016/j.chroma.2008.09.106.
[17] G. Desmet, D. Clicq, P. Gzil, Geometry-independent plate height representation
methods for the direct comparison of the kinetic performance of LC supports
with a different size or morphology, Anal. Chem. 77 (2005) 4058–4070, doi:10.
1021/ac050160z.
[18] Optimization of Peak capacity, chapter K. Horváth, S. Fekete, I. Molnar (Eds.)
World Scientific, New Jersey, 2018.
[19] S. Fekete, H. Ritchie, J. Lawhorn, J.L. Veuthey, D. Guillarme, Improving selectivity and performing online on-column fractioning in liquid chromatography
for the separation of therapeutic biopharmaceutical products, J. Chromatogr. A
1618 (2020) 460901, doi:10.1016/j.chroma.2020.460901.
[20] S. Fekete, A. Beck, J.L. Veuthey, D. Guillarme, Proof of concept to achieve infinite selectivity for the chromatographic separation of therapeutic proteins,
Anal. Chem. 91 (2019) 12954–12961, doi:10.1021/acs.analchem.
[21] L.R. Snyder, J.W. Dolan, High-performance Gradient Elution: the Practical Application of the Linear Solvent Strength Model, John Wiley & Sons, Inc, 2007.
[22] S. Fekete, D. Guillarme, P. Sandra, K. Sandra, Chromatographic, electrophoretic,
and mass spectrometric methods for the analytical characterization of protein
biopharmaceuticals, Anal. Chem. 88 (2016) 480–507, doi:10.1021/acs.analchem.
5b04561.
4. Conclusion
A new tool has been developed to assist method optimization and on-column fractioning of mAbs (intact or sub-units) performed on multi-column systems. This work is an extension of
recently developed (1) multi-isocratic elution mode and (2) oncolumn protein fractioning [18,19]. With the help of the developed algorithms (combination of gradient descent and Monte Carlo
methods), one can quickly find the most suitable multi-isocratic
elution program to perform equidistant band spacing, or the required isocratic composition to fractionate the solutes on individual columns (on-column fractioning). In addition, it is also possible
to find gradient program to elute the compounds in a single peak
from the entire coupled system.
The solver enables to set various column lengths, number of
column segments and target analysis time. The input data required for the optimization are the LSS parameters of the solutes determined on each individual column. This program can
be downloaded from our website ( />lc_multicolumn_optimizer).
5. Credit authorship contribution statement
Santiago Codesido: methodology, conceptualization, writing &
editing Davy Guillarme: supervision, writing – review & editing Szabolcs Fekete: writing – original draft, methodology, investigation,
experiments
Declaration of Competing Interest
The authors declare that they have no known competing financial interests or personal relationships that could have appeared to
influence the work reported in this paper.
The authors declare the following financial interests/personal
relationships which may be considered as potential competing interests:
6