Towards using high-performance liquid chromatography at home
Bạn đang xem bản rút gọn của tài liệu. Xem và tải ngay bản đầy đủ của tài liệu tại đây (2 MB, 11 trang )
Journal of Chromatography A 1639 (2021) 461925
Contents lists available at ScienceDirect
Journal of Chromatography A
journal homepage: www.elsevier.com/locate/chroma
Towards using high-performance liquid chromatography at home
Jan Lankelma a,c,∗, Dirck J. van Iperen b, Paul J. van der Sluis c
a
Department of Molecular Cell Physiology, VU University Amsterdam, O|2 Lab Building, De Boelelaan 1108, 1081 HZ Amsterdam, The Netherlands
Department of Fine mechanics and Engineering VU - Bèta, VU University Amsterdam, The Netherlands
c
Foundation for Chromatography at home, Demonstrator Lab, Amsterdam, The Netherlands
b
a r t i c l e
i n f o
Article history:
Received 2 September 2020
Revised 13 January 2021
Accepted 16 January 2021
Available online 20 January 2021
Keywords:
Chromatography at home
low-cost HPLC
low-cost electrochemical HPLC detector,
low-cost HPLC pump
quantified self
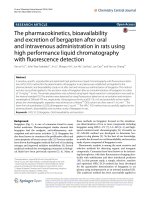
a b s t r a c t
In order to make high-performance liquid chromatography (HPLC) more widely available at home and
in small-scale settings, we have simplified two of its most costly modules, namely the pump and the
detector. This should make the setup affordable for home or small laboratory use. A manual HPLC pump
was constructed so as to fit into a caulk gun from a local hardware store enabling the generation of 100150 bar of pressure. In order to limit the pressure drop during the running of a chromatogram, a pulse
dampener was developed. We further modified the electrochemical detection (ECD) system so as to use
a cheap boron-doped diamond electrode with an overlay of thin filter paper, causing an eluent flow over
the electrode by wicking and gravity. Both the pump and the detector are at least ten times cheaper than
conventional HPLC modules.
Using a home-packed Jupiter R Proteo reversed phase capillary column we show how this low-cost HPLC
system generates well resolving chromatograms after direct injection of fresh urine. The ECD did not
lose its sensitivity during regular use over more than half a year. For homovanillic acid (HVA), which is
of medical interest, we measured a linear dynamic range of two orders of magnitude, a detection limit
of HVA in the injected sample of 3 μM and a coefficient of variation <10%. The contribution to peak
broadening by the detector was much smaller than the contributions by the injector and by the column.
After consumption of table olives containing hydroxytyrosol (HT), its metabolite HVA in the corresponding urine could be measured quantitatively. An approach to quantify HT in table olives is presented, as
well. This method provides a new tool for investigating physiology of oneself or of dear ones at home.
© 2021 The Author(s). Published by Elsevier B.V.
This is an open access article under the CC BY license ( />
1. Introduction
The trend towards self-monitoring for possible life style adjustments is supported by new devices and methods. Moreover,
health data tracking technologies further enable the quantified self
movement [1]. The ultra-low cost microfluidic paper-based analytical devices (μPADs) with colorimetric or electrochemical detection
[2-4] are recent developments. Here the paper is mostly used for
transport by wicking rather than for separation. Among separation
methods HPLC is a powerful tool for the analysis of e.g. body fluids, but is generally too expensive for use at home or in small-scale
settings. Moreover, sample pretreatment can be time consuming.
Urine may be considered as a clear filtrate of blood and can be
injected directly into a reverse phase column. Indeed, measuring
metabolite profiles in human urine has the potential to monitor an
individual’s general health status [5].
∗
Corresponding author.
E-mail address: (J. Lankelma).
Significant efforts to make HPLC smaller, portable and cheaper
have been made [6-9]. These developments were aimed at enabling analysis in the field or in a point-of-care system. In parallel to miniaturization operating costs were lower due to a lower
consumption of eluent, which made the new methods greener as
well. Lower construction costs have been mentioned [9,10], but
these portable systems are generally still too complex to construct
and use at home. In a recent review the history of the development of portable systems and the importance of pumps yielding a
pulse-free flow, has been highlighted [11]. Most pumps are batterypowered and such batteries may add a considerable weight to the
instrument, compromising their portability. An approach circumventing the relatively high power requirement for pumping was
the application of high-pressure gas [12]. Although relatively inexpensive, for its use at home we foresee that the safety of highpressure gas may become an issue. Another interesting pumping system is the electroosmotic pump [13] that was used for a
portable HPLC by Lynch et al. [14]. The 5V power of a USB socket
of a laptop could be used to generate a pressure of 1200 bar. The
/>0021-9673/© 2021 The Author(s). Published by Elsevier B.V. This is an open access article under the CC BY license ( />
J. Lankelma, D.J. van Iperen and P.J. van der Sluis
Journal of Chromatography A 1639 (2021) 461925
construction of this pump and of its high voltage generating electronics is still relatively complex. Most of the reported miniaturized HPLC systems are still prototypes, with the exception of a few
that have been commercialized [15], but of which we have not yet
found indications of widespread use.
When using capillary LC a low eluent flow rate does not require continuous pumping, as long as the pressure can be held
high by a pulse dampener. Quantitative electrochemistry can be
used at very low cost, as proven by millions of glucose meters
that are used by diabetics. These two ideas led us to develop a
HPLC system with a highly simplified pump and detector: capillary
HPLC columns [16] with low eluent flow rates and boron-doped diamond (BDD) electrodes for electrochemical detection with a stable sensitivity, which are essential components integrated in this
new setup. Thereby we have built on HPLC developments during
the sixties of the previous century.
We have tested home use for the detection of homovanillic acid
in urine. We have shown that with relatively cheap instrumentation the urinary concentration of HVA may yield valuable medical
information that can be obtained at home.
2. Materials and methods
2.1. Reagents
Homovanillic acid (HVA), hydroxytyrosol (HT), sodium phosphate dibasic dihydrate (Na2 HPO4 ) and sodium azide (NaN3 ) were
purchased from Sigma-Aldrich (Zwijndrecht, The Netherlands).
Sodium chloride (NaCl) and sodium dihydrogenphosphate monohydrate (NaH2 PO4 ) were from Merck (Darmstadt, Germany). The
buffer solutions were prepared using demineralized water.
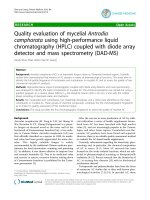
Fig. 1. Overview of the setup; 1) caulk gun with PEEK pump head, 2) T-valve, 3)
PEEK pulse dampener, 4) manometer, 5) PEEK connecting tubing, 6) HPLC injection
valve, 7) capillary column, 8) electrochemical detector, 9) multimeter.
2.2. Instrumentation
line solid-phase extraction and liquid chromatography. Mass spectrometric detection was performed by a Waters Xevo TQ-S micro
triple quadrupole mass spectrometer in positive mode. The method
has been validated according to the Dutch guideline for validation
of analytical methods in medical laboratories by the Dutch Society
of Clinical Chemistry and Laboratory Medicine (NVKC).
2.2.1. Overview of the setup
The manually driven pump head was connected by standard
PEEK (polyether ether ketone) HPLC tubing (outer diameter 1/16
inch, inner diameter 0.5 mm) to a 3-way SS-41GXS1 switching
valve purchased from Swagelok (Waddinxveen, The Netherlands).
Through this valve the eluent from a syringe could fill the cylinder
space of the pump head at low pressure. This filling of the pump
head with eluent was facilitated by pulling the caulk gun piston
away (i.e. to the right in Fig. 1). By switching the 3-way valve,
the pump cylinder space was then connected to a flow-through
manometer via a pulse dampener. A high pressure was generated
by squeezing the caulk gun, thereby pushing its piston to the left
in Fig. 1. Downstream the manometer a standard HPLC valve had
an external loop of 20 μL, followed by a fused-silica capillary LC
column of which the outlet was directly positioned on the working electrode of the electrochemical detector. The type of the HPLC
valve and the use of timed injection for sub-μL injection volumes
will be elaborated upon below. The wooden support construction
was of pressed bamboo. Anodic oxidation currents were recorded
in Volts by a VC820 digital multimeter (Conrad Electronic Benelux,
Oldenzaal, The Netherlands). This HPLC setup weighed less than 5
Kg. The digital signal was transferred to a laptop running under
Windows XP with Datalyse software () for
data logging as described before [17]. In a single run 30 0 0 data
points could be collected. For chromatograms with relatively “slow
peaks” every 10 sec a data point was collected by the software. For
rapid peaks, e.g. without column for detector testing, every 1 sec a
data point was collected.
For HVA we have compared several urine samples with analysis
by HPLC-MS-MS with the help of Dr. Martijn van Faassen of the
University Medical Center Groningen. HVA-13 C6 was used as internal standard. A Spark Holland Symbiosis system was used for on-
2.2.2. Pump head
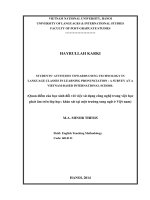
We developed a PEEK pump head module (Figs. 1, 2) that
was machined by Microtherm B.V. (Oudkarspel, The Netherlands).
The outer diameter of the left-hand part (38 mm) as shown in
Fig. 2 was such that the module fitted into a standard caulk gun
from a local hardware store (Fig. 1). A DS 119 PTFE seal (6 mm x
12 mm, 6 mm long) was obtained from Eriks (Alkmaar, The Netherlands). A stainless steel (SS 316) piston with a diameter of 6 mm
was generating the high pressure when pushing the piston to the
left (Fig. 2). The piston was guided by a Teflon slider within the
shaft for positioning. A side branch was welded to the piston for
better grasp when pulling it for filling with new eluent.
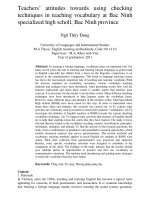
2.2.3. Pulse dampener
In order to reduce the fall in pressure during the running of
a chromatogram, a pulse-dampener with a PEEK body was designed by us and machined at the Technics Campus Den Helder,
The Netherlands. It consists of two PEEK disks of 24 mm (upper
disk) and 10 mm thick (lower disk) that are pressed together by
twelve M5 bolts (see Figs. 1 and 3) with a Viton O-ring (dimensions 33 mm x 3 mm; obtained from Eriks, Alkmaar, The Netherlands) between them. In the lower disk a circular groove (width
3 mm and depth 2 mm) contained the O-ring. The space created
by the O-ring and both PEEK walls of the chamber formed by the
O-ring will be elastically reshaped at high pressures.
2
J. Lankelma, D.J. van Iperen and P.J. van der Sluis
Journal of Chromatography A 1639 (2021) 461925
Fig. 2. Construction of the pump head module. The left-hand part (outer diameter 38 mm) contained the seal with an internal back-up ring and was connected through a
female VICI Valco fitting to 1/16 inch PEEK capillary tubing. Left and right PEEK parts were assembled as indicated by the arrows using two bolts and nuts.
Fig. 3. Pulse dampener for keeping the pressure sufficiently constant during a chromatographic run. It consists of two PEEK disks, with an O-ring in between, and firmly
connected to one another with 12 bolts and 12 nuts. The chamber thus formed is connected to the eluent by two female VICI Valco fittings connected to two small channels
(disk on the right, see arrows).
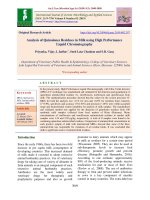
2.2.4. Electrochemical detector
The electrochemical detector presented here is a modification of
a previous design in which liquid transport along the working electrode was driven by wicking and gravity alone [17], rather than by
the pressure generated using the caulk gun. The electronics were
modified for amplifying small currents (Fig. S1). The column end
was directly positioned onto a triangular piece of 105 Whatman
lens cleaning tissue with a thickness of approximately 35 μm covering a part of the electrode. We have used a 10 mm x 10 mm
boron-doped diamond electrode obtained from Condias (Itzehoe,
Germany) (Fig. 4), for obtaining a better stability than when using
a glassy carbon electrode [18,19]. Downstream the working electrode, the lens cleaning tissue was in contact with a piece of 1
mm thick filter paper that was itself in contact with filter paper at
the bottom of a small Petri dish with an outer diameter of 35 mm.
An Ag/AgCl reference electrode (middle electrode) and a stainless
steel auxiliary electrode (left behind the reference electrode) were
standing on the wetted bottom paper disk. The level of the eluent did not rise during elution because of a hole near the bottom of the small Petri dish through which a cotton wire established contact with a strip of filter paper reaching to the bottom
of the glass vial (Fig. 1). Adherence between the different pieces of
wet filter paper was achieved through capillary force just by gentle
touching.
2.2.5. Capillary columns
For packing capillary LC columns [16], fused silica capillaries
from Polymicro (Phoenix, AZ, U.S.A.) with an OD of approximately
0.35 mm and an ID of 0.20 mm were used at various column
lengths, as indicated below. A porous ceramic frit was made using potassium silicate and formamide, followed by polymerization
at elevated temperatures using a procedure modified from Meiring et al. [20], heating at approximately 1 °C/min to 150 °C, holding for 120 minutes at 150 °C and then cooling down at approximately 2 °C/min. Instead of the usual oven of a gas chromatograph, a home gas furnace was used. A 4 mm hole was drilled
into a refractory brick, ending approximately 3 cm above the gas
flame. Together with a thermocouple the capillaries were both positioned at the end of this hole. After calibration using an oil bath,
the readout of the thermocouple was followed in mV and the gas
flame was readjusted if necessary to create the right temperature
track. The columns were packed at approximately 100 bar using an
in-house built stainless steel module containing an internal space
with 1 ml of a stirred slurry of 50 mg/ml of column packing material (Jupiter 4u Proteo 90A from Phenomenex, Torrance, CA, U.S.A.)
in 2-propanol, that was first sonicated for 5 min. When irregularities of the packing were observed at the top of the column after packing at home the corresponding piece was cut off by a ceramic capillary cutter. The columns were run using 50 mM phos3
J. Lankelma, D.J. van Iperen and P.J. van der Sluis
Journal of Chromatography A 1639 (2021) 461925
a stator bore of 0.5 mm) allowed column cleaning and abolish
phase collapse [21] by injecting the complete loop volume with 2propanol/0.1 N nitric acid in a volume ratio 4/1 [22]. For small injection volumes timed injection was used, whereby the valve was
temporarily switched to “INJECT” and switched back to “FILL” after 10 or 20 sec, creating an injection volume of 0.17 μL or 0.33
μL at a typical eluent flow rate of 1 μL/min. The eluent flow rate
was estimated by dividing the void volume by the unretained retention time. The fraction void volume/total volume (total column
porosity) was taken as 0.6 [23]. A VICI Valco micro-injection valve
(model Cheminert C4-1004-.5 with stator bore of 0.25 mm and an
internal loop of 0.5 μL) was used in cases where an exact and fixed
injection volume was needed, e.g. when the number electrons per
oxidized molecule was calculated during oxidation at different flow
rates.
3. Results and discussion
3.1. Functioning of the pump module and the pulse dampener
A working pressure of 100 bar was used most of the time.
For building up this pressure, manual compression of one cylinder volume of the pump module (see Fig. 2) was sufficient. However, by strong squeezing of the caulk gun a pressure of 170 bar
could also be reached. At the start we injected approximately 20
μL of the propanol/nitric acid mixture (for details, see above) in
order to abolish phase collapse at zero flow rate and for removing
highly retained compounds of previous injections. To avoid pollution of the electrode the column was uncoupled from the detector during this procedure. The best time for this was late in the
evening, since the following morning a series of chromatograms
could be started without losing too much time for stabilization. In
this study isocratic elution with a buffer without organic modifier
was used. Under these conditions phase collapse is a serious danger when the flow is stopped, e.g. by leaving the HPLC valve in
an intermediate position. In case phase collapse happened, 20 μL
of the propanol/nitric acid mixture was injected (see above, under 2.2.6), and the column was allowed to stabilize for at least 1
h. Phase collapse during the night could be avoided by applying
a starting pressure of 150 bar in the evening before. The purpose
of a pulse dampener is to reduce pressure variations. Omitting the
pulse dampener could lead to a rapid drop in pressure, and unacceptable peak broadening, as shown in Fig. 5. This figure also
shows how the pressure evolved for starting pressures of 50, 100
and 150 bar as well as the corresponding effect on the HVA peak
when using the pulse dampener. To prevent leaking back along the
seal in the pump module, the T-valve was set in the filling position during a chromatographic run. This meant that at the highpressure side the T-valve was closed and the eluent under high
pressure was not connected to either the caulk gun or to the filling
syringe. After switching the T-valve, the pressure was raised manually to the starting pressure at the start of a new chromatogram
by squeezing and reading the pressure gauge. Using a 15 cm column the pressure did not decrease by more than 20% during one
hour. Usually, two times squeezing the caulk gun (corresponding
to about 1/3 of the cylinder volume) was enough to restore the
pressure for the next one-hour run. The eluent flow was pulse-free
and resulted in a stable amperometric baseline. This work shows
the generation of chromatographic peaks at relatively low cost. The
cost was low not only thanks to the simplified instrumentation,
but also consequent to minimal use of eluent, because of the low
flow rate. The pump is not a black box with an on/off switch, but
users generate the pressure by hand and come in direct contact
with the pressure generating process. Therefore this pump may become an instructive tool, useful for HPLC education.
Fig. 4. Above, electrochemical detection cell (see also Fig. 1). Using a lid of a Petri
dish (a) and a pipet tip end, the outlet of the capillary column was positioned on
the upstream corner of a triangular piece of lens cleaning tissue (b) partially covering the working electrode. The reference electrode (c) and the auxiliary electrode
(d) can also be seen.
Below, schematic representation. The outlet of the capillary column touched the
working electrode (we) that was partly covered by a triangular piece of tissue (paper strip 1); this filter paper touched a wet 1 mm thick piece of filter paper (paper
strip 2) that was in contact with the reference electrode (ref) and the auxiliary electrode (aux) at the bottom of the Petri dish (containing a wet 1 mm thick filter paper
disk). A cotton wire guided the flow to another strip of filter paper (paper strip 3)
reaching to the bottom of the glass vial. In this way the amount of fluid in the Petri
dish stayed constant and was limited to wetting the bottom paper disk.
phate buffer (pH 6.82) containing 10 mM sodium chloride for electrical conductivity and for maintaining a stable reference potential. Sodium azide (0.02%) was added for prevention of growth of
microorganisms. The capillary columns were operated at ambient
temperature.
2.2.6. Sampling valves
A macroscopic VICI Valco HPLC injection valve with a sample loop of 20 μL (model Cheminert C2-1006D with, in our case,
4
J. Lankelma, D.J. van Iperen and P.J. van der Sluis
Journal of Chromatography A 1639 (2021) 461925
Fig. 6. Normalized output signal after quickly touching the working electrode surface (red line) with a tip of a pipette made from a disposable insulin syringe [17],
after a 2 sec. timed injection (blue line) with a Vici micro-injection valve (model
Cheminert C4-1004-.5 with stator bore of 0.25 mm and an internal loop of 0.5 μL)
and (green line) after a 2 sec. timed injection with a “macroscopic” HPLC Vici valve
(model Cheminert C2-1006D with, in our case, a stator bore of 0.5 mm and an external loop of approximately 20 μL). The valves were connected with the working
electrode by low-volume fused silica tubing (length 15 cm, ID 25 μm). The flow
rate for all three cases was 1.7 μL/min. For these signals the data were collected
every second by the Datalyse software.
Fig. 5. Effect of the pulse dampener on the reduction in pressure (broken lines;
axis on the right). Homovanillic acid (drawn lines; axis on the left) peaks at starting
pressures of 50 (green), 100 (black) or 150 bar (blue) with pulse dampener. Without
pulse dampener, the pressure (starting at 100 bar) dropped rapidly (the red broken
line), leading to significant peak broadening caused by reduction of the eluent flow
rate (the red HVA peak). HVA concentration 0.2 mM; calculated injection volume
0.28 μL; column length 30 cm.
The noise level was about 1 nA (see Fig. S4). After injection of
0.5 μL of a HVA solution the detection limit taken to reside at
three times the noise level corresponded to a concentration of approximately 3 μM in the injected sample. At 0.2 mM and 10 sec
on INJECT, the coefficient of variation between HVA peak heights
was smaller than 10% (n=8). The linear range, expressed as the
ratio between the upper limit of the linear range and the detection limit was 102 . This was in the same range as that reported in
a previous publication on the measurement of HVA in urine with
macroscopic HPLC and electrochemical detection at a flow rate of
1.3 mL/min [27].
When comparing different chromatograms, the retention times
may differ somewhat (see Fig. S5). If necessary, in the future a
direct overlay of chromatograms may be accomplished by time
warping algorithms [28].
The same electronics were used as described earlier for measuring glucose concentrations using 6 V and 9 V battery power for
the amplifier and the multimeter, respectively [17]. This amplifier
was chosen for its low price and simplicity and has not yet been
optimized for HPLC detection. Further optimization by choosing
low-noise amplifiers might well decrease the detection limit and
expand the linear range. Preliminary measurements using a new
open source amplifier [29] that also allowed other electrochemical modes, such as cyclic voltammetry, confirmed this expectation
(data not shown). This will be worked out in a future paper.
3.2. Functioning of the electrochemical detector
After working for over half a year with the same electrode and
without any electrode cleaning we observed no loss of sensitivity
for HVA at +0.7 V (vs. Ag/AgCl/Cl− ) [24]. This is an advantage over
a glassy carbon electrode, which needs regular polishing to prevent loss of sensitivity [25]. At the potential of +0.7 V used, the
sodium azide that had been added to prevent microbial growth,
did not increase the background current significantly. The reference electrode must be close to the working electrode in order
to minimize a so-called iR-drop and maximize the linear detection
range [25]. In the present configuration the upper limit of the linear range was measured to be 0.6 μA (see Fig. S2). The detector
was tested further in the linear range below this upper limit. Normalized per molecule applied to the column, the integrated peak
area should provide information on the number of electrons transferred per molecule during the oxidation accompanying the detection. We had aimed for a thin diffusional liquid layer during wicking through the thin filter paper on the working electrode. In this
way we facilitated the diffusion so that most molecules should be
oxidized by the electrode. In accordance with coulometric detection [25] we indeed measured no change in total peak area when
the pressure was lowered down from 100 bar to 20 bar, supporting the idea that all molecules were being oxidized. For HVA, using the law of Faraday [25] we measured 3.3 electrons/molecule
under our detection conditions (see Fig. S3). This number is high
compared to the number expected on the basis of the number of
OH-moieties per molecule [26]. Rapid polymerization reactions after the first one-electron oxidation could lead to reactive intermediates reacting further to molecules with more oxidizable groups,
possibly explaining this high number [26]. Using this number of
electrons in the data analysis, it might still be possible to quantify HVA without the need for comparison with a standard solution. However, because the number is not an integer and cannot
robustly be explained from a chemical reaction scheme at present,
we prefer calibration through spiking, because unforeseen variations in the reaction conditions may occur leading to variations in
the net number of electrons per molecule. In order to minimize
influence of ambient temperature fluctuations we advise frequent
comparisons with a standard and to position the setup in a spot
with relatively stable temperature, not close by a heat source.
3.3. Peak broadening
Contributions by injection volume and couplings to peak broadening merit attention when using capillary columns. Peak broadening by the coupling between the column and the detector is
expected to be minimal, as the end of the fused silica column
rests directly on the triangular piece of lens cleaning tissue on
the working electrode (Fig. 4). Indeed, introduction of a pulse of
HVA directly onto this filter paper by a tip of a home-made pipette
[17] showed a relatively sharp peak (red line in Fig. 6), when compared to the peaks by using two different HPLC injection valves
with timed injection (only 2 sec on INJECT). For this measurement
both valves were connected to the working electrode by a lowvolume fused silica capillary (length 15 cm, ID 25 μm). The direct
detection peak shape was asymmetrical. Peak broadening caused
5
J. Lankelma, D.J. van Iperen and P.J. van der Sluis
Journal of Chromatography A 1639 (2021) 461925
Fig. 7. On the left the normalized injection peak shape after timed injection with the micro-injection valve during 1 sec (red), 2 sec (dark blue), 5 sec (green), 15 sec
(magenta) at INJECT and the complete loop of 0.5 μL (light blue). In the middle the normalized injection peak shape using a normal macroscopic valve (see Fig. 6) for 2
sec (magenta), 5 sec (red), 10 sec (blue) and 20 sec (green) at INJECT. For experimental setup, see Fig. 6. On the right the resulting volume dispersion σ v values for the
micro-valve (blue) and the macroscopic valve (brown).
Fig. 8. Chromatographic homovanillic acid (HVA) peaks after using a “normal macroscopic HPLC valve” (as mentioned under Fig. 6)) for various times at INJECT (magenta
2 sec, green 10 sec, red 30 sec, dark blue 60 sec, light blue 180 sec); the HVA concentration was 40 μM. On the left the primary signal and on the right comparison of
normalized peaks. The flow rate was inferred by dividing the estimated void volume by the elution time of the unretained peak (tRo ).
the present configuration. At the highest INJECT time (180 sec) a σ t
of 95 sec was found and a corresponding σ v of 1.7 μL. Again assuming Gaussian distributions and independence, variances in volumetric units of the fluid path up- and downstream from the column can be added to the column variance to obtain the total peak
variance [31,32]. As below INJECT times of 60 sec σ v did not decrease, while the influence on peak broadening by the injection did
(Fig. 7), this σ v (0.6 μL) was taken as the peak broadening caused
by the column. The calculated injection variance in volume by INJECT at 180 sec, according to Prüss et al. [30], σ v, inj 2 , was added
to the column variance. The square root gave a σ v for the total
peak of 1.1 μL, which was in the same range as the σ v of 1.7 μL,
measured experimentally.
An increase of the INJECT time and thus an increase in the injection volume will lead to higher peaks, with a better signal to
noise ratio. However, as we have discussed above, increasing the
injection volume can increase the peak width. For peaks at a lower
retention time than that of HVA or for better columns with narrower peaks, INJECT times of 60 sec or less can have more impact
on total peak broadening than shown in Fig. 8. For such cases an
LC valve with a bore diameter of 0.25 mm is advised.
by an increased injection volume (Figs. 6 and 7) resulted in less
asymmetry. Approximating the peaks by Gaussians, the temporal
dispersion σ t was estimated as half the width at 0.6 of the maximal height. The corresponding volume dispersion σ v was calculated by multiplication with the flow rate. The flow rate was inferred from the void volume by division through the elution time
of the unretained peak (tRo ). As band broadening caused by the detector was much smaller (σ v of less than 0.1 μL) than that caused
by the injection volume of the HPLC valves (Fig. 6), the contribution of the detector to the peak width was negligible.
Next, we looked at the peak broadening caused by the injection.
For this, the sample injection volume was varied by using different
INJECT times. The resulting injection peaks for the two HPLC valves
are presented in Fig. 8.
At small injection volumes, the calculated values for σ v were
larger than predicted by the empirical formula presented by Prüss
et al. [30], but at higher injection volumes these differences became less. This can be explained by less influence of dispersion at
the edges of the peak profile [30]. However, it is not our aim to
theoretically dissect peak broadening over a large range of injection volumes. In practice, INJECT times of 10 or 20 sec could be
handled most conveniently.
Under the chromatographic conditions used to produce
Fig. 8 for up to 60 sec at INJECT, a “normal macroscopic” HPLC
valve could be used, because the chromatographic peak was only
affected for INJECT times > 60 sec. Therefore, neither a nanovolume injection valve (corresponding to < 1 sec on INJECT), nor a
splitter system [20] should significantly reduce peak broadening in
3.3. Applications
The aim of this work is to present a new tool for HPLC analysis
at home or in small laboratories. Attractive should be the analysis
of urine without or with a simple sample pretreatment (e.g. solid
phase extraction). After direct injection of fresh urine of a healthy
6
J. Lankelma, D.J. van Iperen and P.J. van der Sluis
Journal of Chromatography A 1639 (2021) 461925
Fig. 9. Analysis of two urine samples, one (A) just before, and one (B) collected at 1.8 h after taking 10 Kalamata table olives on an empty stomach, indicating the conversion
of hydroxytyrosol from the olives to homovanillic acid (at arrow). Column length 15 cm.
68-year old volunteer the present method generated 5-20 peaks
(Fig. 9A). As compared to frozen urine, fresh urine samples offer
the advantage that no precipitates have to be removed before injection and that there is no oxidation due to storage. We focused
on the effect of table olives as a key component of a Mediterranean
diet. HVA was determined after intake of table olives and quercetin
tablets. After taking 10 pitted Kalamata table olives on an empty
stomach, a rapid rise of the peak at the retention time of HVA was
detected in the first urine collected around 1.8 h after ingesting the
olives (Figs. 9A and 9B). This is in accordance with rapid absorption and a metabolic conversion of HT from the olives [33]. Subsequent urine samples showed a decline of the HVA peak. At retention times in excess of 40 0 0 sec the chromatogram of the urine
of Fig. 9B showed no significant peaks (Fig. 10), so under the presented chromatographic conditions the system showed to be ready
after about 1 h for the next sample. Cleaning of the column by
the propanol/nitric acid mixture (see above for details) was done
about one time per week and columns could be used for at least
half a year enabling HVA measurements, comparable to that shown
in Figs. 9A and 9B.
The HVA concentration in the first morning urine sample calculated with the standard plot (Fig. S2) and adjusted for the injection volume, was in the order of 10 μM. Stroe et al. showed that
the urinary HVA concentration is more than two orders of magnitude higher than the blood concentration [34], presumably by active tubular organic anion transport in the kidney [35]. The urine
results thereby yield (indirect) information of variations in the low
blood concentrations of HVA.
The content of HT in table olives was measured under the
present chromatographic conditions after the following extraction
procedure. The fruit flesh of three olives was cut into pieces of 23 mm and immersed in 200 ml of tap water overnight. The following morning, after stirring a couple of times, the mixture was
filtered through cotton wool and the filtrate was directly injected
into our chromatographic system (Fig. S7). A second extraction of
the residue (under the same conditions) yielded less than 5% of
the first extraction, indicating that almost all the HT had diffused
overnight into the water.
An additional experiment was the determination of HVA after intake of quercetin. After taking an oral dose of 500 mg of
7
J. Lankelma, D.J. van Iperen and P.J. van der Sluis
Journal of Chromatography A 1639 (2021) 461925
Fig. 10. The chromatogram of Fig. 9B at a longer time scale, showing the absence of significant peaks in the later phase.
400
quercetin and subsequent collection of urine samples from two
healthy volunteers, a peak at the retention time of HVA was
emerged much later (around 12 h, data not shown) than after the
consumption of Kalamata olives. This delay may reflect the intestinal transit time and conversion of quercetin to HVA by the microflora in the large intestine [36]. Therefore, the HVA pattern may
carry quantitative information on the composition of the microbiome.
The tool we present here does not identify the peaks at the retention times of HVA or HT as HVA or HT with 100% certainty,
even after spiking the sample with pure HVA or HT. For our test
compound HVA we have compared urinary concentrations with
those measured by HPLC-MS-MS. The agreement between both
methods (Fig. 11) confirms the identity of the measured peak to
be that of HVA.
Increasing the length of a home-packed column beyond 15 cm
enhanced separation power, with inherently longer elution times
(Figs. S5 and S6).
y = 0.9896x
R² = 0.9925
ECD: HVA (µM)
300
200
100
0
3.4. Perpectives
0
100
200
300
400
MS-MS: HVA (µM)
In an attempt at simplifying HPLC we have integrated a lowcost hand pump, a pulse dampener and a battery-powered detector. The estimated total cost of the presented setup amounts to
EUR 2200 for off-the-shelf components, including EUR 10 0 0 for a
commercial HPLC injection valve, and excluding the cost of construction labor. For other published comparable miniaturized and
low-weight HPLC systems [11] at least one HPLC sample valve was
needed for sample introduction. A refurbished valve could reduce
the price of the total setup significantly. By comparison, relatively
simple isocratic HPLC pumps by which the same chromatogram
can be created, range from EUR 50 0 0 to EUR 10 0 0 0. Although our
newly constructed modules are relatively simple, instrument construction skills are required. The amplifier could simply be constructed by any moderately experienced electronics craftsman, or
by using a breadboard for connecting the electronic resistances,
op-amps, etc. The PEEK pump module can be made using a lathe,
or ordered like we did. Interesting possibilities may exist in the
near future for 3-D printing of the PEEK modules or of the sampling valve. Increased demand should lower the price and stimulate commercial activities. Increasing quantities of machining of
the components can reduce the price drastically. In the setup presented here the HPLC valve is the most expensive module. If higher
Fig. 11. Comparison of urinary homovanillic acid concentrations between our HPLCECD method and an established HPLC-MS-MS method. A linear trend line was obtained using Excel R . For two samples with HVA concentrations of 352.7 μM and
279.5 μM (measured with MS-MS) we measured average HVA concentrations of
364.3 μM and 259.0 μM, respectively; the standard deviations were 8.7 μM (n=3)
and 16.3 μM (n=5), respectively. Samples of two human volunteers were collected
after taking Kalamata olives, mucuna pruriens and quercetin and without taking anything (after overnight fasting).
separation power is needed, peak broadening caused by the injection should be reduced. Then, a valve with a small stator bore may
be needed. This will be less available than e.g. a second-hand wide
bore valve.
For detecting compounds that are not electrochemically active,
a florescence detector or a recently published prototype of a UV
LED based detection cell [8] could serve. The use of alternative
commercially available detectors for capillary LC, also of a contactless conductivity detector, would add EUR 20 0 0 or more to the
cost. As HPLC is modular, our pump module or electrochemical detector may also be used to replace a pump or detector in another
portable system. In case a gradient elution will be needed one may
8
J. Lankelma, D.J. van Iperen and P.J. van der Sluis
Journal of Chromatography A 1639 (2021) 461925
chose a different miniaturized system [11] with the electronics for
gradient pump control. Alternatively, one may chose the setup by
Lynch switching to eluents with different compositions during a
run [14]. A simple variant could be a step-gradient after filling the
20 μL loop with a different eluent at some time point after the
loop has been used for timed sample injection.
Here we have focused on technical innovations. In order to promote further developments we advocate an open source model,
which may then also be applied to different biomolecules. We
have here focused only on HVA [37,38], which can be formed
from dopamine in the brain and other organs [35,39]. HVA also
increased after the consumption of an extract of seeds of mucuna
pruriens, containing the dopamine precursor L-dopa, which can be
used in the treatment of Parkinson’s disease [40].
A daily dose of 5 mg of HT and derivatives has been recommended by EFSA [41] for reduction of oxidation of LDL cholesterol
[42]. A large variation in the reduction of oxidation of LDL cholesterol by HT and derivates in humans has been reported [43-46].
Also the content of HT of table olives may vary widely [47,48].
Comparison with the peak height of a HT standard we found for
some Kalamata table olives that just one olive would already be
enough to obtain 9 mg of HT, while we found in Thassos table
olives less than 0.2 mg HT per olive, which is in line with earlier
findings [47]. This work may contribute to facilitating more measurements in this applied setting thereby providing bigger data and
thereby more understanding of variables involved in the conversion of HT to HVA, e.g. the way of administration and the time of
day olives are consumed.
Besides nutrition as a source for HVA, urinary HVA may be
produced by neuroblastomas and phaeochromocytomas [49-51]. A
further practical application of urinary HVA may be its use as a
biomarker that can be measured frequently at home, e.g. during
tumor treatment. We propose measurements after food interventions early in the morning after overnight fasting as a good timing
with relatively low influence of other food sources.
For home procedures packing of fused silica capillaries are
preferred over making monolithic columns (simpler and working with less toxic materials). Moreover, most of the polymerbased monolithic columns seem to be unable to efficiently separate small molecules [52]. Chromatography of hydrophilic oxidizable urinary components using reversed phase column material
has been shown here without organic modifier added to the eluent. When analyzing more lipophilic compounds with the present
system the use of organic modifiers in the eluent may negatively
affect the wicking speed of the eluent alongside the working electrode. When the transport becomes too slow, a make-up flow can
be added from the upper reservoir, analogous to the principle published before [17]. Alternatively the construction of the electrochemical cell may be adapted to make the flow over the electrode
independent of the wicking [53].
for electrochemical detection, when compared to piston or syringe
pumps [11]. Due to the “open air” construction, the presented detector is not bothered by gas bubbles that can develop, in case
UV detection will be used [11]. A radar chart assessing the system
according to “BETTER criteria 2020” [11] has been presented (Fig.
S8). In our present setup, the modules have not yet been placed
in a single casing for use in the field. Compared to other portable
and miniaturized HPLC systems we have reduced the construction
skills required to those that will often be available locally. Our
new Foundation for the promotion of the use of chromatography
at home will support local constructions by providing additional
information through the Internet.
The simplicity of our system also comes with limitations. For
example, when an application requires a gradient elution, other reported systems should be considered. The isocratic mode of elution
and the direct injection of urine contributed to a long elution time
before the next sample could be injected. However, for a limited
number of samples to be analyzed at home this should not constitute a problem. Other detectors could open a new window for
detecting compounds, but their acquisition could considerably increase the price of the setup.
As an application we analyzed fresh urine and focused on one
peak that was easily detectable and that showed a large variation during the day. This peak was at the retention time of HVA
and its concentration in urine was dependent on the intake of HT.
However, other compounds in the urine may be measured as well.
Other detectors and superficially porous silica particles or monolithic columns may be used to broaden the scope and speed of
analysis of easily measurable components without sample pretreatment. Hopefully, this low-cost approach will stimulate more research at home into the physiology of oneself or of dear ones and
in the near future it may contribute to managing health.
Declaration of Competing Interest
The authors declare that JL and PvdS are board members of a
non-profit Foundation for the promotion of the use of chromatography at home.
CRediT authorship contribution statement
Jan Lankelma: Investigation, Conceptualization, Methodology,
Writing - original draft. Dirck J. van Iperen: Investigation, Resources. Paul J. van der Sluis: Investigation, Writing - review &
editing.
Acknowledgements
We are grateful to Jaap Tijmes and Arthur van de Tetrix for their
help with the construction of the PEEK modules. Errol Dekkinga of
D-Tech Staalbouw has helped with a prototype of the pump module in stainless steel. Tom Tijmes is thanked for IT support and colleagues of the VU instrumental development group are gratefully
acknowledged for skillful technical advice. Martijn van Faassen
(Department of Laboratory Medicine, University Medical Center
Groningen, University of Groningen, Groningen, The Netherlands) is
gratefully acknowledged for analysis by HPLC-MS-MS. Henk Dekker
is acknowledged for advice on data management. We thank colleagues in the nutrition research field for valuable discussions and
colleagues in the lab for experimental support. Hans Westerhoff is
gratefully acknowledged for improvements in the style and structure of the manuscript.
4. Conclusions
The work presented shows the feasibility of constructing one’s
own low-cost HPLC system for urine analysis after food interventions at home. Key components are a hand pump, requiring no batteries and capillary LC, in combination with a simple electrochemical detection system with a flow generated by wicking and gravity
along a BDD electrode. The present system has a low weight (<
5 kg, excl. laptop) and is potentially a portable system for measurements in the field, but its robustness will have to be improved
for that purpose, especially regarding the electrochemical detector. Figures of merit also comprise its relatively easy construction,
when compared to other low-weight systems [11], its low price,
and its sensitive detection. In addition, a stable eluent flow resulting from the presented pump can be regarded as favorable
Supplementary materials
Supplementary material associated with this article can be
found, in the online version, at doi:10.1016/j.chroma.2021.461925.
9
J. Lankelma, D.J. van Iperen and P.J. van der Sluis
Journal of Chromatography A 1639 (2021) 461925
References
[23] N.M. Devitt, R.E. Moran, J.M. Godinho, B.M. Wagner, M.R. Schure, Measuring porosities of chromatographic columns utilizing a mass-based total poreblocking method: Superficially porous particles and pore-blocking critical pressure mechanism, J Chromatogr A 1595 (2019) 117–126, doi:10.1016/j.chroma.
2019.02.045.
[24] S.C.B. Oliveira, A.M. Oliveira-Brett, Boron doped diamond electrode pretreatments effect on the electrochemical oxidation of dsDNA, DNA bases,
nucleotides, homopolynucleotides and biomarker 8-oxoguanine, J Electroanal
Chem 648 (2010) 60–66, doi:10.1016/j.jelechem.2010.06.020.
[25] J. Lankelma, H. Poppe, Design and Characterization of a Coulometric Detector
with a Glassy Carbon Electrode for High-Performance Liquid-Chromatography,
J Chromatogr 125 (1976) 375–388, doi:10.1016/S0 021-9673(0 0)83369-5.
[26] H. Hotta, H. Sakamoto, S. Nagano, T. Osakai, Y. Tsujino, Unusually large numbers of electrons for the oxidation of polyphenolic antioxidants, Bba-Gen Subjects 1526 (2001) 159–167, doi:10.1016/S0304-4165(01)00123-4.
[27] J. Dutrieu, Y.A. Delmotte, Simultaneous Determination of Vanilmandelic Acid
(Vma), Homovanillic-Acid (Hva) and 5-Hydroxy-3-Indoleacetic Acid (5-Hiaa) in
Urine by High-Performance Liquid-Chromatography with Coulometric Detection, Fresen Z Anal Chem 317 (1984) 124–128, doi:10.10 07/Bf0 0594062.
[28] W.P.H. de Boer, J. Lankelma, Two-dimensional semi-parametric alignment of
chromatograms, J Chromatogr A 1345 (2014) 193–199, doi:10.1016/j.chroma.
2014.04.034.
[29] M.D.M. Dryden, A.R. Wheeler, DStat: A Versatile, Open-Source Potentiostat for
Electroanalysis and Integration, Plos One 10 (2015), doi:10.1371/journal.pone.
0140349.
[30] A. Prüss, C. Kempter, J. Gysler, T. Jira, Extracolumn band broadening in capillary liquid chromatography, Journal of Chromatography A 1016 (2003) 129–141,
doi:10.1016/S0021-9673(03)01290-1.
[31] A. Prüss, C. Kempter, J. Gysler, T. Jira, Evaluation of packed capillary liquid chromatography columns and comparison with conventional-size columns, Journal
of Chromatography A 1030 (2004) 167–176, doi:10.1016/j.chroma.2003.11.017.
[32] K. Vanderlinden, G. Desmet, K. Broeckhoven, Measurement of the Band Broadening of UV Detectors used in Ultra-high Performance Liquid Chromatography
using an On-tubing Fluorescence Detector, Chromatographia 82 (2019) 489–
498, doi:10.1007/s10337- 018- 3622- 1.
[33] M. Robles-Almazan, M. Pulido-Moran, J. Moreno-Fernandez, C. RamirezTortosa, C. Rodriguez-Garcia, J.L. Quiles, M. Ramirez-Tortosa, Hydroxytyrosol:
Bioavailability, toxicity, and clinical applications, Food Res Int 105 (2018) 654–
667, doi:10.1016/j.foodres.2017.11.053.
[34] A.E. Stroe, F. Amin, A. Hashmi, D. Densmore, T. Kahn, P.J. Knott, Diurnal variation in plasma homovanillic acid: not a renal phenomenon, Biol Psychiatry 41
(1997) 621–623, doi:10.1016/s0 0 06-3223(96)0 0526-4.
[35] F. Amin, M. Davidson, K.L. Davis, Homovanillic acid measurement in clinical
research: a review of methodology, Schizophr Bull 18 (1992) 123–148, doi:10.
1093/schbul/18.1.123.
[36] I.B. Jaganath, W. Mullen, C.A. Edwards, A. Crozier, The relative contribution of
the small and large intestine to the absorption and metabolism of rutin in
man, Free Radic Res 40 (2006) 1035–1046, doi:10.1080/1071576060 077140 0.
[37] S. Cohrs, Z. Guan, K. Pohlmann, W. Jordan, J. Pilz, E. Ruther, A. Rodenbeck,
Nocturnal urinary dopamine excretion is reduced in otherwise healthy subjects with periodic leg movements in sleep, Neurosci Lett 360 (2004) 161–164,
doi:10.1016/j.neulet.2004.02.056.
[38] M. Kanehisa, M. Araki, S. Goto, M. Hattori, M. Hirakawa, M. Itoh, T. Katayama,
S. Kawashima, S. Okuda, T. Tokimatsu, Y. Yamanishi, KEGG for linking genomes
to life and the environment, Nucleic Acids Res 36 (2008) D480–D484, doi:10.
1093/nar/gkm882.
[39] G.W. Lambert, G. Eisenhofer, G.L. Jennings, M.D. Esler, Regional homovanillic acid production in humans, Life Sci 53 (1993) 63–75, doi:10.1016/
0024- 3205(93)90612- 7.
[40] R. Katzenschlager, A. Evans, A. Manson, P.N. Patsalos, N. Ratnaraj, H. Watt,
L. Timmermann, R. Van der Giessen, A.J. Lees, Mucuna pruriens in Parkinson’s
disease: a double blind clinical and pharmacological study, J Neurol Neurosurg
Psychiatry 75 (2004) 1672–1677, doi:10.1136/jnnp.2003.028761.
[41] Carlo Agostoni, Jean-Louis Bresson, Susan Fairweather-Tait, Albert Flynn,
Ines Golly, Hannu Korhonen, Pagona Lagiou, Martinus Løvik, Rosangela Marchelli, Ambroise Martin, Bevan Moseley, Monika Neuhäuser-Berthold,
Hildegard Przyrembel, Seppo Salminen, Yolanda Sanz, Sean (J.J.) Strain,
Stephan Strobel, Inge Tetens, Daniel Tomé, Hendrik van Loveren, Hans Verhagen, Scientific Opinion on the substantiation of health claims related to
polyphenols in olive and protection of LDL particles from oxidative damage (ID
1333, 1638, 1639, 1696, 2865), maintenance of normal blood HDL-cholesterol
concentrations (ID 1639), maintenance of normal blood pressure (ID 3781),
“anti-inflammatory properties” (ID 1882), “contributes to the upper respiratory tract health” (ID 3468), “can help to maintain a normal function of gastrointestinal tract” (3779), and “contributes to body defences against external
agents” (ID 3467) pursuant to Article 13(1) of Regulation (EC) No 1924/20061 ,
Efsa J 9 (2011) 2033. https://efsa- onlinelibrary- wiley- com.vu- nl.idm.oclc.org/
doi/abs/10.2903/j.efsa.2011.2033.
[42] S.J. Rietjens, A. Bast, G.R. Haenen, New insights into controversies on the antioxidant potential of the olive oil antioxidant hydroxytyrosol, J Agric Food
Chem 55 (2007) 7609–7614, doi:10.1021/jf0706934.
[1] S.S. Gollamudi, E.J. Topol, N.E. Wineinger, A framework for smartphoneenabled, patient-generated health data analysis, PeerJ 4 (2016) e2284, doi:10.
7717/peerj.2284.
[2] E.L. Rossini, M.I. Milani, E. Carrilho, L. Pezza, H.R. Pezza, Simultaneous determination of renal function biomarkers in urine using a validated paper-based
microfluidic analytical device, Anal Chim Acta 997 (2018) 16–23, doi:10.1016/j.
aca.2017.10.018.
[3] C.M. Silveira, T. Monteiro, M.G. Almeida, Biosensing with Paper-Based Miniaturized Printed Electrodes-A Modern Trend, Biosensors-Basel 6 (2016), doi:10.
3390/bios6040051.
[4] E. Carrilho, A.W. Martinez, G.M. Whitesides, Understanding wax printing: a
simple micropatterning process for paper-based microfluidics, Anal Chem 81
(2009) 7091–7095, doi:10.1021/ac901071p.
[5] A.H. Emwas, C. Luchinat, P. Turano, L. Tenori, R. Roy, R.M. Salek, D. Ryan,
J.S. Merzaban, R. Kaddurah-Daouk, A.C. Zeri, G.A.N. Gowda, D. Raftery,
Y.L. Wang, L. Brennan, D.S. Wishart, Standardizing the experimental conditions for using urine in NMR-based metabolomic studies with a particular focus on diagnostic studies: a review, Metabolomics 11 (2015) 872–894,
doi:10.1007/s11306- 014- 0746- 7.
[6] S. Sharma, A. Plistil, R.S. Simpson, K. Liu, P.B. Farnsworth, S.D. Stearns, M.L. Lee,
Instrumentation for hand-portable liquid chromatography, J Chromatogr A
1327 (2014) 80–89, doi:10.1016/j.chroma.2013.12.059.
[7] Y. Li, K. Pace, P.N. Nesterenko, B. Paull, R. Stanley, M. Macka, Miniaturised
electrically actuated high pressure injection valve for portable capillary liquid
chromatography, Talanta 180 (2018) 32–35, doi:10.1016/j.talanta.2017.11.061.
[8] S.C. Lam, L.J. Coates, M. Hemida, V. Gupta, P.R. Haddad, M. Macka, B. Paull,
Miniature and fully portable gradient capillary liquid chromatograph, Anal
Chim Acta 1101 (2020) 199–210, doi:10.1016/j.aca.2019.12.014.
[9] Y. Li, M. Dvorak, P.N. Nesterenko, R. Stanley, N. Nuchtavorn, L.K. Krcmova, J. Aufartova, M. Macka, Miniaturised medium pressure capillary liquid chromatography system with flexible open platform design using off-the-shelf microfluidic components, Anal Chim Acta 896 (2015) 166–176, doi:10.1016/j.aca.2015.
09.015.
[10] T.S. Kephart, P.K. Dasgupta, J.N. Alexander, An affordable high-performance
pumping system for gradient capillary liquid chromatography, J
Microcolumn Sep 11 (1999) 299–304, doi:10.1002/(Sici)1520-667x(1999)11:
4 299::Aid- Mcs7 3.0.Co;2- 1.
[11] F. Rahimi, S. Chatzimichail, A. Saifuddin, A.J. Surman, S.D. Taylor-Robinson, A.
Salehi-Reyhani, A Review of Portable High-Performance Liquid Chromatography: the Future of the Field?, Chromatographia, 83 (2020) 1165-1195 DOI:
10.1007/s10337-020-03944-6.
[12] S. Chatzimichail, D. Casey, A. Salehi-Reyhani, Zero electrical power pump for
portable high-performance liquid chromatography, Analyst 144 (2019) 6207–
6213, doi:10.1039/c9an01302d.
[13] C.Y. He, Z.F. Zhu, C.Y. Gu, J. Lu, S.R. Liu, Stacking open-capillary electroosmotic
pumps in series to boost the pumping pressure to drive high-performance liquid chromatographic separations, Journal of Chromatography A 1227 (2012)
253–258, doi:10.1016/j.chroma.2011.12.105.
[14] K.B. Lynch, A.P. Chen, Y. Yang, J.J. Lu, S.R. Liu, High-performance liquid chromatographic cartridge with gradient elution capability coupled with UV absorbance detector and mass spectrometer for peptide and protein analysis, Journal of Separation Science 40 (2017) 2752–2758, doi:10.1002/jssc.
201700185.
[15] L.J. Coates, S.C. Lam, A.A. Gooley, P.R. Haddad, B. Paull, H.J. Wirth, Modular,
cost-effective, and portable capillary gradient liquid chromatography system
for on-site analysis, Journal of Chromatography A 1626 (2020), doi:10.1016/j.
chroma.2020.461374.
[16] Y. Saito, K. Jinno, T. Greibrokk, Capillary columns in liquid chromatography:
between conventional columns and microchips, J Sep Sci 27 (2004) 1379–1390,
doi:10.10 02/jssc.20 0401902.
[17] J. Lankelma, Z. Nie, E. Carrilho, G.M. Whitesides, Paper-based analytical device
for electrochemical flow-injection analysis of glucose in urine, Anal Chem 84
(2012) 4147–4152, doi:10.1021/ac3003648.
[18] K. Peckova, J. Musilova, J. Barek, Boron-Doped Diamond Film Electrodes-New
Tool for Voltammetric Determination of Organic Substances, Crit Rev Anal
Chem 39 (2009) 148–172, doi:10.1080/10408340903011812.
[19] A. Kraft, Doped diamond: A compact review on a new, versatile electrode material, Int J Electrochem Sc 2 (2007) 355–385. />papers/vol2/2050355.pdf.
[20] H.D. Meiring, E. van der Heeft, G.J. ten Hove, A.P.J.M. de Jong, Nanoscale
LC-MS(n): technical design and applications to peptide and protein analysis, Journal of Separation Science 25 (2002) 557–568, doi:10.1002/
1615-9314(20020601)25:9 557::Aid-Jssc557 3.0.Co;2-F.
[21] T.H. Walter, P. Iraneta, M. Capparella, Mechanism of retention loss when C8
and C18 HPLC columns are used with highly aqueous mobile phases, J Chromatogr A 1075 (2005) 177–183, doi:10.1016/j.chroma.2005.04.039.
[22] Timothy P. Bradshaw, Introduction to Peptide and Protein HPLC, Vol.
1., Phenomenex, p. 37. />d425ff1c- 61a8- 4bfe- 9c0a- 6abe585f1d24.pdf.
10
J. Lankelma, D.J. van Iperen and P.J. van der Sluis
Journal of Chromatography A 1639 (2021) 461925
[43] M.A. Perrone, P. Gualtieri, S. Gratteri, W. Ali, D. Sergi, S. Muscoli, A. Cammarano, S. Bernardini, L. Di Renzo, F. Romeo, Effects of postprandial hydroxytyrosol and derivates on oxidation of LDL, cardiometabolic state and gene expression: a nutrigenomic approach for cardiovascular prevention, J Cardiovasc
Med (Hagerstown) 20 (2019) 419–426, doi:10.2459/JCM.0 0 0 0 0 0 0 0 0 0 0 0 0816.
[44] C.D. Hohmann, H. Cramer, A. Michalsen, C. Kessler, N. Steckhan, K. Choi, G. Dobos, Effects of high phenolic olive oil on cardiovascular risk factors: A systematic review and meta-analysis, Phytomedicine 22 (2015) 631–640, doi:10.1016/
j.phymed.2015.03.019.
[45] R. Mateos, S. Martinez-Lopez, G. Baeza Arevalo, M. Amigo-Benavent, B. Sarria,
L. Bravo-Clemente, Hydroxytyrosol in functional hydroxytyrosol-enriched biscuits is highly bioavailable and decreases oxidised low density lipoprotein levels in humans, Food Chem 205 (2016) 248–256, doi:10.1016/j.foodchem.2016.
03.011.
[46] E. Lopez-Huertas, J. Fonolla, Hydroxytyrosol supplementation increases vitamin
C levels in vivo. A human volunteer trial, Redox Biol 11 (2017) 384–389, doi:10.
1016/j.redox.2016.12.014.
[47] E. Zoidou, E. Melliou, E. Gikas, A. Tsarbopoulos, P. Magiatis, A.L. Skaltsounis,
Identification of Throuba Thassos, a traditional Greek table olive variety, as
a nutritional rich source of oleuropein, J Agric Food Chem 58 (2010) 46–50,
doi:10.1021/jf903405e.
[48] S. Charoenprasert, A. Mitchell, Factors influencing phenolic compounds in table
olives (Olea europaea), J Agric Food Chem 60 (2012) 7081–7095, doi:10.1021/
jf3017699.
[49] N. Flynn, A. LeFebvre, B. Messahel, S.L. Hogg, Olive ingestion causing a false
suspicion of relapsed neuroblastoma: A case of "oliveblastoma? Pediatric Blood
& Cancer 65 (2018), doi:10.1002/pbc.27248.
[50] S. Barco, I. Gennai, G. Reggiardo, B. Galleni, L. Barbagallo, A. Maffia, E. Viscardi,
F. De Leonardis, V. Cecinati, S. Sorrentino, A. Garaventa, M. Conte, G. Cangemi,
Urinary homovanillic and vanillylmandelic acid in the diagnosis of neuroblastoma: report from the Italian Cooperative Group for Neuroblastoma, Clin
Biochem 47 (2014) 848–852, doi:10.1016/j.clinbiochem.2014.04.015.
[51] I.R.N. Verly, R. Leen, J.R. Meinsma, G.K.J. Hooijer, C.D. Savci-Heijink, J. van
Nes, M. Broekmans, R.J.A. Wanders, A.B.P. van Kuilenburg, G.A.M. Tytgat, Catecholamine excretion profiles identify clinical subgroups of neuroblastoma patients, Eur J Cancer 111 (2019) 21–29, doi:10.1016/j.ejca.2019.01.014.
[52] F. Svec, Y. Lv, Advances and recent trends in the field of monolithic columns
for chromatography, Anal Chem 87 (2015) 250–273, doi:10.1021/ac504059c.
[53] M. Komendova, R. Metelka, J. Urban, Monolithic capillary column with an integrated electrochemical detector, J Chromatogr A 1509 (2017) 171–175, doi:10.
1016/j.chroma.2017.06.057.
11