Expanding the range of sub/supercritical fluid chromatography: Advantageous use of methanesulfonic acid in water-rich modifiers for peptide analysis
Bạn đang xem bản rút gọn của tài liệu. Xem và tải ngay bản đầy đủ của tài liệu tại đây (2.3 MB, 12 trang )
Journal of Chromatography A 1642 (2021) 462048
Contents lists available at ScienceDirect
Journal of Chromatography A
journal homepage: www.elsevier.com/locate/chroma
Expanding the range of sub/supercritical fluid chromatography:
Advantageous use of methanesulfonic acid in water-rich modifiers for
peptide analysis
Gioacchino Luca Losacco a,b, Jimmy Oliviera DaSilva c, Jinchu Liu c, Erik L. Regalado c,
Jean-Luc Veuthey a,b, Davy Guillarme a,b,∗
a
School of Pharmaceutical Sciences, University of Geneva, CMU – Rue Michel-Servet 1, 1211 Geneva 4, Switzerland
Institute of Pharmaceutical Sciences of Western Switzerland, University of Geneva, CMU – Rue Michel-Servet 1, 1211 Geneva 4, Switzerland
c
Analytical Research and Development, MRL, Merck & Co, Inc., 126 E. Lincoln Ave, Rahway, NJ 07065, United States
b
a r t i c l e
i n f o
Article history:
Received 25 January 2021
Revised 1 March 2021
Accepted 2 March 2021
Available online 9 March 2021
Keywords:
Ultra-high performance supercritical fluid
chromatography
Ultra-high performance liquid
chromatography
Mass spectrometry
Peptides analysis
a b s t r a c t
The aim of this work was to expand the applicability range of UHPSFC to series of synthetic and commercialized peptides. Initially, a screening of different column chemistries available for UHPSFC analysis
was performed, in combination with additives of either basic or acidic nature. The combination of an
acidic additive (13 mM TFA) with a basic stationary phase (Torus DEA and 2-PIC) was found to be the
best for a series of six synthetic peptides possessing either acidic, neutral or basic isoelectric points. Secondly, methanesulfonic acid (MSA) was evaluated as a potential replacement for TFA. Due to its stronger
acidity, MSA gave better performance than TFA at the same concentration level. Furthermore, the use of
reduced percentages of MSA, such as 8 mM, yielded similar results to those observed with 15 mM of
MSA. The optimized UHPSFC method was, then, used to compare the performance of UHPSFC against
RP-UHPLC for peptides with different pI and with increasing peptide chain length. UHPSFC was found
to give a slightly better separation of the peptides according to their pI values, in few cases orthogonal
to that observed in UHPLC. On the other hand, UHPSFC produced a much better separation of peptides
with an increased amino acidic chain compared to UHPLC. Subsequently, UHPSFC-MS was systematically
compared to UHPLC-MS using a set of linear and cyclic peptides commercially available. The optimized
UHPSFC method was able to generate at least similar, and in some cases even better performance to
UHPLC with the advantage of providing complementary information to that given by UHPLC analysis. Finally, the analytical UHPSFC method was transferred to a semipreparative scale using a proprietary cyclic
peptide, demonstrating excellent purity and high yield in less than 15 min.
© 2021 The Author(s). Published by Elsevier B.V.
This is an open access article under the CC BY-NC-ND license
( />
1. Introduction
Peptides and peptide-like drugs are compounds which typically generated a lot of interest within the pharmaceutical industry. Their presence in several key biological processes makes them
an interesting class of molecules from which new drugs could
be developed [1,2]. There have been several developments in the
use of peptides as therapeutic agents: originally, they were simply used in replacement therapies, when patients lacked a specific
peptide in their organism [3,4]. A classic example of this strategy
∗
Corresponding author at: School of Pharmaceutical Sciences, University of
Geneva, CMU – Rue Michel-Servet 1, 1211 Geneva 4, Switzerland.
E-mail address: (D. Guillarme).
is the administration of insulin to patients suffering from type 1
diabetes [3]. Subsequently, synthetic analogs of different peptides
already present in the human body came along [5,6]. However,
peptides present several issues as drugs, mainly related to their
pharmacokinetic properties [7,8], because of their low bioavailability due to their size, up to 50 0 0 – 60 0 0 Da for peptides with
an amino acidic sequence of 40–50 amino acids, as well as an
facile metabolism [9]. To improve their properties, modern synthetic peptides have started to differ, from a structural point of
view, from their biological precursors, including new functional
groups in their structure (i.e. polymers and fatty acids) introduced
to develop a better bioavailability via their oral formulation [10,11].
The analytical strategy to characterize this class of molecules
has revolved on the use of ultra-high performance liquid
/>0021-9673/© 2021 The Author(s). Published by Elsevier B.V. This is an open access article under the CC BY-NC-ND license
( />
G.L. Losacco, J.O. DaSilva, J. Liu et al.
Journal of Chromatography A 1642 (2021) 462048
chromatography (UHPLC) as the preferred technique, mainly in
reversed-phase mode (RPLC) [12–14]. Its ease of use, high throughput capacity and ability to couple with ultraviolet (UV) detector
and, more importantly, mass spectrometry (MS) made it a popular technique for peptide analysis [15–17]. Despite the advantages
of UHPLC-UV-MS, a demand for greener, faster and complementary analytical techniques is always present [18]. Among them, one
of the most promising strategies is ultra-high performance supercritical fluid chromatography (UHPSFC). Thanks to the development
of dedicated sub-2 μm stationary phases, as well as the release of
chromatographic systems able to withstand the backpressures generated by these columns, UHPSFC has shown a great potential as
a complementary alternative to UHPLC. This was possible thanks
to the use of a mobile phase consisting in a mixture of supercritical carbon dioxide with polar organic modifier [19]. Moreover,
it presents an easy hyphenation to various detectors such as UV
and MS [20] and can provide fast analyses as the mobile phase
presents low viscosity, enabling higher flow-rates without experiencing high backpressures. Finally, a high degree of orthogonality
exists between UHPSFC and UHPLC, especially with the RPLC mode
[21].
The analysis of peptides in UHPSFC is described in the literature, and there have already been studies demonstrating the use
of UHPSFC for their analysis [22–25]. However, a systematic comparison between UHPSFC and UHPLC has not been made until now.
This is probably because UHPSFC is difficult to use for the analysis of highly polar compounds having high molecular weight (partial elution from the column, solubility issues, distorted peaks…).
Nonetheless, in the last 2–3 years a new trend appears in UHPSFC,
consisting in the use of gradient profiles reaching percentages of
organic modifier up to 90–100% [26–28]. Furthermore, the addition of water, up to 5–7% in the organic co-solvent has enabled
UHPSFC to give improved performance in the analysis of polar and
ionized metabolites, as it increases the elution strength of the mobile phase [28,29]. These new trends in UHPSFC could, therefore,
reinvigorate its applicability for the analysis of peptides.
The aim of this study was to evaluate the performance of UHPSFC, coupled to different detectors (UV and MS), for the analysis
of a series of synthetic and therapeutic peptides. Different chromatographic aspects, such as retention, selectivity and peak shape,
as well as compatibility with MS detection and, finally, scale-up to
the preparative scale, have been investigated. The impact of peptide isoelectric point, hydrophobicity and amino acids chain length,
on the UHPSFC separation was assessed. A systematic comparison
to UHPLC in the RPLC mode was also performed with the goal of
highlighting possible advantages and disadvantages of the newly
developed method.
2. Materials and methods
2.1. Chemicals, reagents and sample preparation procedures
For all experiments performed at the University of Geneva,
methanol (MeOH) and acetonitrile (ACN) of OPTIMA LC-MS grade
and water (H2 O) of UHPLC grade were purchased from Fischer
Scientific (Loughborough, UK). Carbon dioxide (CO2 ) of 4.5 grade
(99.995% purity level) was purchased from PanGas (Dagmerstellen,
Switzerland). Metanil yellow and methyl orange, lysine, arginine,
aspartic acid, glutamic acid, ammonia solution at 25% of MS grade,
trifluoroacetic acid (TFA) of MS grade and methanesulfonic acid
(MSA) at a purity level of 99.5% or higher were purchased from
Sigma-Aldrich (Buchs, Switzerland). Synthetic peptides 1N, 2N, 1B,
2B, 1A, 2A, 6mer, 9mer, 12mer, 15mer, 18mer and 21mer at a purity level of ≥ 95% have been purchased from GenScript Biotech
(Leiden, Netherlands). More information regarding their amino
acid sequences, molecular weights as well as predicted isoelectric
points (pI) and GRAVY numbers are provided in Table 1. GRAVY
number is a measure of the grade of hydrophilicity of a protein/peptide based on its hydropathy index, a value which varies
between −2 to 2 for most proteins; the higher the hydropathy
index, the higher the hydrophobicity. GRAVY number and pI values were obtained using the ProtParam tool available on the proteomic server ExPASy [30,31]. Commercial pharmaceutical formulations of liraglutide, leuprorelin, glucagon, cyclosporin A, eptifibatide and linaclotide (Table 1) have been purchased from the hospital pharmacy at the Geneva University Hospitals (HUG, Geneva,
Switzerland).
For all purification experiments, methanol (HPLC Grade) and
water (HPLC grade) were purchased from Fisher Scientific (Fair
Lawn, NJ, USA). Methanesulfonic acid (MSA), 99% extra pure was
¯ Organics (Morris Plains, NJ, USA). The cyclic
purchased from ARCOS
peptide was obtained in-house (Merck & Co., Inc., Kenilworth, NJ,
USA). Bone dry-grade CO2 was obtained from Air Gas (New Hampshire, USA).
Details regarding the sample preparation and stress procedures
used in this study can be found in the supplementary material.
Table 1
List of synthetic and commercial peptides used in this study.
Name
Sequence
Peptide 1N
Peptide 2N
Peptide 1B
Peptide 2B
Peptide 1A
Peptide 2A
Peptide 6mer
Peptide 9mer
Peptide 12mer
Peptide 15mer
Peptide 18mer
Peptide 21mer
Liraglutide
Trp-Asn-Ser-Val-Lys-Tyr-Asp-Ile-Ser-Tyr-His-Thr
Ala-Tyr-His-Asp-Gln-Trp-Lys-Tyr-His-Phe-Cys
Trp-Gln-Ser-Thr-Tyr-His-Asp-Lys-Phe-Ala-Trp-Arg-Tyr
Phe-Lys-Asn-Ser-Tyr-His-Gln-Ile-Arg-Trp-Val-Tyr-Asn-Phe
Phe-Asn-Glu-Cys-Tyr-Arg-Ser-Asp-Ala-Tyr-Ser-Asn-Thr-Phe
Tyr-Asn-Ser-Phe-Asp-Glu-Trp-Lys-Cys-Thr-Phe-Ser-Trp
Leu-Trp-His-Gly-Ser-Asn
Leu-Trp-His-Gly-Ser-Asn-Lys-Trp-Asp
Leu-Trp-His-Gly-Ser-Asn-Lys-Trp-Asp-Asn-Gly-Gln
Leu-Trp-His-Gly-Ser-Asn-Lys-Trp-Asp-Asn-Gly-Gln-Trp-Ser-Asn
Leu-Trp-His-Gly-Ser-Asn-Lys-Trp-Asp-Asn-Gly-Gln-Trp-Ser-Asn-Gly-Thr-Gln
Leu-Trp-His-Gly-Ser-Asn-Lys-Trp-Asp-Asn-Gly-Gln-Trp-Ser-Asn-Gly-Thr-Gln-Ala-Asn-Ser
His-Ala-Glu-Gly-Thr-Phe-Thr-Ser-Asp-Val-Ser-Ser-Tyr-Leu-Glu-Gly-Gln-Ala-Ala-Lys(γ -Glupalmitoyl)-Glu-Phe-Ile-Ala-Trp-Leu-Val-Arg-Gly-Arg-Gly
pGlu-His-Trp-Ser-Tyr-d-Leu-Leu-Arg-Pro-NHEt
His-Ser-Gln-Gly-Thr-Phe-Thr-Ser-Asp-Tyr-Ser-Lys-Tyr-Leu-Asp-Ser-Arg-Arg-Ala-Gln-Asp-PheVal-Gln-Trp-Leu-Met-Asn-Thr
Abu-Sar-Leu-Val-Leu-Ala-dAla-Leu-Leu-Val-Bmt
Cys-hArg-Gly-Asp-Trp-Pro-Cys
Cys-Cys-Glu-Tyr-Cys-Cys-Asn-Pro-Ala-Cys-Thr-Gly-Cys-Tyr
Leuprorelin
Glucagon
Cyclosporin A
Eptifibatide
Linaclotide
2
MW
(Da)
Number of
amino acids
pI
(predicted)
GRAVY
number
1512
1497
1788
1902
1717
1713
713
1142
1441
1829
2115
2387
3751
12
11
13
14
14
13
6
9
12
15
18
21
32
6.74
6.95
8.50
9.70
4.37
4.37
6.74
6.74
6.74
6.74
6.74
6.74
4.96
−0.93
−1.24
−1.53
−0.86
−0.96
−0.90
−0.83
−1.48
−1.73
−1.73
−1.69
−1.57
−0.36
1209
3483
9
29
8.75
6.75
−0.52
−0.99
1203
832
1527
11
7
14
NA
3.80
4.00
NA
−0.20
0.32
G.L. Losacco, J.O. DaSilva, J. Liu et al.
Journal of Chromatography A 1642 (2021) 462048
2.2. Chromatographic and MS instrumentations and conditions
return to 35% B in 0.1 min and finally hold at 35% B for 1.9 min.
The PDA scans from 190 to 400 nm and the chromatogram is extracted at 210 nm. The MS scans the mass range of 100 to 1200
with a sampling frequency of 2 Hz, cone voltages of 10 and 50 V
in ESI (+) and a cone voltage of 10 V in ESI (-). Preparative SFC
purification was performed on a Waters Torus 2-PIC 30.0 mm x
250 mm, 5 μm column with a mobile phase of 35% MeOH/H2 O
95/5 v/v + 8 mM MSA / CO2 . The flow rate was 140 mL.min−1 ,
mobile phase and column oven temperature at 35 °C, back pressure regulator set to 103 bar (1500 psi), UV detection at 210 nm.
The sample was prepared at 20 mg/mL in methanol with a load of
1 mL.
SFC analysis of the cyclic peptide was carried out on a Waters
Torus 2-PIC 4.6 mm I.D. x 250 mm 5 μm column at a flow rate of
2 mL.min−1 with the backpressure regulator (BPR) set at 100 bar;
The SFC eluent solvent was 40% MeOH/H2 O 95/5 v/v + 8 mM MSA
/ CO2 . The PDA scans from 190 to 400 nm and the chromatogram
was extracted at 210 nm.
All information regarding the chromatographic and MS instruments conditions, as well as on the software employed for data
treatment can be found in the supplementary material.
At University of Geneva, for UHPSFC analyses, five different
columns have been initially employed, namely Torus 2-PIC, Torus
DEA, Torus DIOL, BEH silica (Waters, Milford, MA, USA), all packed
with 1.7 μm fully porous silica particles, and Nucleoshell HILIC
(Macherey-Nagel, Düren, Germany), packed with 2.7 μm superficially porous silica particles. All columns possess the same geometry of 100 × 3.0 mm I.D. A generic gradient was developed for
the analysis of synthetic peptides, from 10 to 100% organic modifier in the mobile phase over 7 min, followed by an isocratic hold
at 100% of co-solvent for 1 min, then a return to initial conditions
in 0.1 min, and a final isocratic step with 10% of organic modifier
for 2.9 min, giving a total run time of 11 min (section 3.1.). Organic modifier employed at this stage was a mixture of MeOH/H2 O
95:5 v/v containing either 13 mM (0.1%) TFA, 15 mM (0.1%) MSA or
52 mM (0.2%) NH4 OH. Flow-rate was fixed at 0.7 mL.min−1 . Following this preliminary step, an optimized method for the analysis of synthetic peptides was developed and used in the second
part of the study (section 3.2), based on the Torus 2-PIC stationary
phase with mixture of MeOH/H2 O 95:5 v/v + 8 mM MSA as the
co-solvent. The optimized method follows a different gradient profile, starting from 30 to 80% organic modifier over 5 min, then an
isocratic step at 80% of co-solvent for 0.5 min, followed by a return to initial conditions in 0.1 min and a second isocratic step of
1.9 min for a total analysis time of 7.5 min. Flow-rate was fixed, in
this case at 0.9 mL.min−1 . For the commercially available peptides
(i.e. liraglutide, leuprorelin, glucagon, linaclotide and eptifibatide),
a modified version of the optimized gradient was employed: start
at 35% co-solvent, reaching 90% in 5 min, then an isocratic step at
90% of co-solvent for 0.5 min, followed by a return to initial conditions in 0.1 min and a second isocratic step under these conditions
of 1.9 min for a total analysis time of 7.5 min. For cyclosporin A,
a third gradient was chosen, starting from 2 to 40% over 5 min,
with an isocratic step at 40% of co-solvent for 0.5 min, then return to initial conditions in 0.1 min and a second isocratic step for
1.9 min, giving a total run time of 7.5 min.
Under UHPLC conditions, a 50 × 2.1 mm I.D. BEH C18 stationary phase packed with 1.7 μm fully porous particles (Waters) was
used. Mobile phase A was H2 O + 13 mM TFA, while mobile phase
B was ACN + 13 mM TFA. An optimized gradient was employed
for all synthetic and therapeutic peptides (with the only exception
of cyclosporin A), consisting in a 5 min gradient from 5 to 65%B,
a hold up for two minutes at 65% B, then a return to initial conditions in 0.1 min and an isocratic hold for 1.9 min at 5% for a
total run time of 9 min. For cyclosporin A the gradient time and
total run time were the same, however the highest percentage of
B reached during the gradient was 95%. In all these conditions, the
flow-rate was fixed at 0.4 mL.min−1 .
The column screening consisted of eight different stationary
phases, namely Chiralpak IC and Chiralcel OZ (both of geometry of 100 × 4.6 mm I.D. – 3.0 μm fully porous particles); Chiralcel OJ, Chiralpak IG and DCpak P4VP (all with geometry of
150 × 4.6 mm I.D. – fully porous particle sizes of 3.0 μm for Chiralcel OJ and of 5.0 μm Chiralpak IG and DCpak P4VP) from Chiral Technologies (West Chester, PA, USA); CELERIS 4EP from Regis
Technologies (Morton Grove, IL, USA) and Torus DEA and Torus 2PIC from Waters Corp. (Milford, MA, USA), all with the geometry
of 250 × 4.6 mm I.D. and packed with 5.0 μm fully porous particles. SFC screenings were carried out on the diverse set of columns
described in the above section by gradient elution at a flow rate of
2 mL.min−1 with the backpressure regulator (BPR) set at 103 bar
(1500 psi). The SFC eluents consisted of CO2 and organic modifier,
which consisted of MeOH/H2 O 95/5 v/v + 8 mM MSA. The mobile
phases were programmed as follows: 35% B at 0 min, linear gradient from 35% to 90% B in 5 min, a hold at 90% B for 0.5 min, then
3. Results and discussion
3.1. Development of the UHPSFC chromatographic method
3.1.1. Impact of the additive nature on the stationary phase
performance
To ensure the elution of peptides using a CO2 -based mobile
phase, various parameters have to be considered. Firstly, the addition of water in the co-solvent seems necessary to ensure acceptable peak shapes as well as elution within reasonable time
[25,32–34]. Secondly, additives are needed to further reduce the
tailing factor and peak widths [23,24,35]. To choose the most appropriate stationary phase, a screening of the several chemistries
available was often needed. Overall, analytical conditions for peptide analysis under SFC can be summarized as follows: a mixture
of methanol and water as the organic co-solvent, in combination
with an additive (in most cases TFA). However, the application of
such conditions is mostly limited to the analysis of peptides with
relatively short amino acidic sequences (often 10–12 or less) [22–
24,32]. Therefore, the goal of the present study was to find conditions suitable for a wider range of peptides, through the screening of different stationary phase chemistries, in combination with
the use of acidic and basic additives. Such a screening strategy
was firstly applied to a series of synthetic peptides described in
Table 1 (peptides 1 N, 2 N, 1B, 2B, 1A and 2A). These peptides all
possess a sequence of a length between 11 – 14 amino acids and
with a molecular weight ranging from 1500 to 1900 Da. Furthermore, these different peptides possess either an acidic (pI < 7),
neutral (pI ≈ 7), or basic nature (pI > 7) and they all possess an
important polar character (GRAVY number between −1 and −2).
Indeed, compounds with these properties have always been challenging to analyze under UHPSFC conditions, as they are strongly
retained on the (polar) stationary phase, and poorly soluble in mobile phases with a predominant presence of supercritical CO2 . Each
stationary phase (i.e. Torus 2-PIC, Torus DEA, Nucleoshell HILIC,
Torus DIOL, BEH silica) was tested with the same organic modifier composition (MeOH/H2 O 95:5) in which either 13 mM (0.1%)
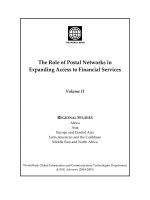
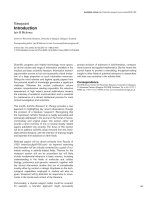
of TFA or 52 mM (0.2%) of NH4 OH was added. In Fig. 1a, a table summarizing the data is presented. Stationary phases with a
“basic” nature (having one or more positively charged functional
groups) are those providing the best results, yielding complete elution of all synthetic peptides with good peak shape, as illustrated
in Fig. 1b for peptides 1B and 2A on the Torus 2-PIC. Between the
Torus 2-PIC and Torus DEA, no major differences were observed,
3
G.L. Losacco, J.O. DaSilva, J. Liu et al.
Journal of Chromatography A 1642 (2021) 462048
Fig. 1. a) A classification of the combination between the nature of the additive and the properties of the stationary phase chemistries evaluated in this study, on the quality
of the chromatographic separation and elution for a series of synthetic peptides. b) Chromatograms, for peptides 1B and 2A, obtained on a “neutral”, “zwitterionic” and
“basic” stationary phase using the best combination between stationary phase and nature of the additive in the mobile phase.
but the Torus 2-PIC gave a slightly faster elution. As expected,
these columns gave good results only when an acidic additive was
used. The addition of 52 mM NH4 OH in the mobile phase provided a severe loss of performance on the two “basic” stationary
phases (i.e. Torus 2-PIC and Torus DEA) (Fig. S1). The combination
of a bare silica (BEH silica) stationary phase with acidic additive
such as TFA, or even basic additives (52 mM NH4 OH) provided
inferior performance to those witnessed on the Torus 2-PIC/DEA
columns (Fig. 1a-b). With acidic peptides (peptide 2A), the BEH silica gave comparable peak shapes to that observed on the Torus 2PIC (Fig. 1b), but did not for peptides with higher isoelectric points
(peptide 1B – Fig. 1b). Finally, the two remaining columns employed in this study, namely the Torus DIOL (neutral) and Nucleoshell HILIC (zwitterionic), were those offering the worst performance overall. More specifically, the use of a zwitterionic stationary phase performed rather poorly with 13 mM TFA, while the addition 52 mM NH4 OH ensured the proper elution of peptides, but
with extremely poor peak shapes as shown for peptides 1B and 2A
(Fig. 1b). In conclusion, the combination of a column having basic properties (Torus 2-PIC) with an acidic additive (13 mM TFA)
provided the best performance for all peptides and was kept for
further evaluation.
source. Moreover, its use does not always guarantee, in the case
of UHPSFC, good chromatographic performance with peptides. The
use of alternative additives that would either improve the MS compatibility or the chromatographic performance without sacrificing
even further the MS sensibility is desirable. In this context, a recent article on the use of UHPSFC for the analysis of amino acids
describes the use of a different additive, namely methanesulfonic
acid (MSA), in substitution to TFA [28]. The use of MSA is not new
in UHPSFC [36], and in this paper [28] the authors have highlighted
a major improvement of the chromatographic performance in UHPSFC for the analysis of underivatized amino acids, in comparison
with TFA. Moreover, authors have shown a compatibility of MSAbased mobile phases with MS detection. Therefore, it was decided
to evaluate MSA instead of TFA for analyzing the same set of synthetic peptides previously used (i.e. 1N, 2N, 1B, 2B, 1A and 2A) on
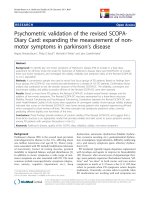
the Torus 2-PIC column. In Fig. 2, a comparison of 13 mM TFA vs.
15 mM MSA for peptides with acidic, neutral and basic pI is shown.
It is immediately visible how 15 mM MSA largely improves the
quality of the separation under UHPSFC conditions, improving both
peak widths and peak shapes. Moreover, a higher number of impurities, which were not detected with 13 mM TFA, are now visible
with 15 mM MSA. In order to make the mobile phase even more
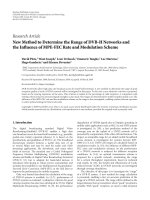
MS friendly, lower percentages of MSA (8 mM and 4 mM) have
been assessed on the same set of peptides (Fig. 3). The reduced
percentage of MSA did not negatively impact the performance of
the chromatographic method overall, and 8 mM MSA gave similar
results to those observed with 15 mM of MSA. A further reduction
to 4 mM MSA was still sufficient to ensure the proper elution of
the peptides, but peaks widths were slightly larger, and selectivity
3.1.2. Evaluation of MSA as a replacement of TFA
The use of TFA is quite widespread in the literature for peptide
analysis, regardless of the considered chromatographic technique
(UHPLC or UHPSFC). This additive, however, presents issues when
coupling the chromatographic method to a MS detector, mostly
due to its tendency to cause ion suppression in the ionization
4
G.L. Losacco, J.O. DaSilva, J. Liu et al.
Journal of Chromatography A 1642 (2021) 462048
Fig. 2. Chromatograms, relative to peptides 1N, 1B and 2A, obtained on the Torus 2-PIC column with 13 mM TFA (left) or 15 mM MSA (right) as additives in the organic
co-solvent.
Fig. 3. A comparison of chromatograms obtained by using different percentages of MSA (4 mM – 8 mM – 15 mM) in the organic co-solvent on a series of three peptides
(1N – 1B – 2A) on the Torus 2-PIC stationary phase.
was reduced compared to 15 mM and 8 mM MSA. Consequently,
it was decided that 8 mM MSA was the best compromise for the
UHPSFC method.
The chemical properties of this additive could explain the better chromatographic performance obtained for peptide analysis in
comparison to TFA. Indeed, MSA is a strong organic acid with a
very low pKa value (pKa ≈ −1.9), in comparison with TFA (pKa
≈ 0.5). This important difference in the acidity scale might generate, some potential changes in the apparent mobile phase pH
(pHapp ). Due to the peculiar nature of the mobile phase generally employed in UHPSFC, consisting in a mixture of supercritical
CO2 with a polar organic modifier (generally methanol), a straightforward discussion of the mobile phase pH is almost impossible.
However, in a recent article [37], the prediction of the pHapp in
UHPSFC mobile phases was made thanks to the use of colorimetric
pH indicators. In this work, the authors discovered that UHPSFC
mobile phases possessed an average pH of 4–5, reaching lower
values with the employment of acidic additives, such as TFA. Using the same strategy, an evaluation of the mobile phase acidity,
with 8 mM MSA and 7 mM TFA, was carried out (Fig. 4), using 50% of supercritical CO2 and 50% of co-solvent as the mobile phase. A reference solution without any additive in the co-
5
G.L. Losacco, J.O. DaSilva, J. Liu et al.
Journal of Chromatography A 1642 (2021) 462048
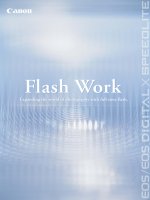
Fig. 4. UV spectra recorded for metanil yellow (left) and methyl orange (right) using 50/50 CO2 :B as the mobile phase, with B being: MeOH:H2 O 95/5 v/v (black trait),
MeOH:H2 O 95/5 v/v + 8 mM MSA (red trait) and MeOH:H2 O 95/5 v/v + 7 mM TFA (green trait). (For interpretation of the references to colour in this figure legend, the
reader is referred to the web version of this article.)
solvent was also considered. The UV spectra recorded for two pH
indicators, namely methyl orange (pKa ≈ 3.6) and metanil yellow
(pKa ≈ 0.9) indicated that both additives were differently affected
by the mobile phase acidity. This difference was already visible
when methyl orange was used. Indeed, while no difference was
observed, in the UV spectra, between the co-solvent without additive and with 7 mM TFA, a shift of the maximum absorbance
towards higher wavelength was observed with 8 mM MSA (Fig. 4).
This indicates a possible change in the protonation site present in
the structure of the pH indicator. Surprisingly, a slight variation of
the UV spectra was also observed for metanil yellow, a molecule
with a much lower pKa value (Fig. 4). It becomes therefore clear
that MSA can generate a more acidic environment than TFA. The
mobile phase pHapp seems to have a key role when considering the
performance of UHPSFC for peptide analysis. The acidic conditions
generated by 8 mM MSA can be sufficient to protonate all tested
peptides, as their free carboxyl group at one end of the peptide
chain (a weak acid) should be present in its protonated (neutral)
form, while the free primary amine at the N-terminus should be
increasingly present in its protonated form. The use of a “basic”
column would also translate into a protonated stationary phase,
under such pH conditions. Protonated molecules, such as the investigated peptides, would therefore experience an electrostatic repulsion with the stationary phase possessing the same net charge,
which seems to drastically improve peak shape and peak width
(Fig. 2).
An interesting phenomenon was highlighted in Fig. 3: peptides
showed a faster elution at lower MSA concentration. This phenomenon did not seem to affect either peak shape or peak width,
but solely the retention. This trend is not similar with TFA (Fig.
S2). In this case, the reduction of TFA concentration from 13 mM
to 7 mM generated an increase in retention. This behavior is due
to the ion pairing behavior of TFA. With MSA, however, the situation needs to be further clarified. As above-mentioned, MSA is a
strong acid, which generates an acidic environment able to protonate all peptides and the basic groups at the surface of the stationary phase employed in UHPSFC. The increase of MSA concentration would translate in a further increase of the mobile phase
acidity, but it also means that a higher number of methanesulfonate anions (H3 C-SO3 − ) should be present, allowing ion-pairing
behavior of the MSA anion with the positively charged compounds.
The positive charge present on the peptide is, therefore, better
shielded, thus reducing the electrostatic repulsion with the positively charged stationary phase, explaining the higher retention. To
confirm this hypothesis, a test with 4 amino acids, two of them
having a basic functional group (lysine and arginine) and two with
acidic functional groups in their structure (glutamic and aspartic
acid), was performed on the Torus 2-PIC using 8 mM and 15 mM
of MSA and also using TFA. While peptides containing lysine and
arginine have experienced a noteworthy reduction of their retention time with lower MSA concentration, the two acidic amino
acids showed no significant retention time variation when switching from 15 mM MSA to 8 mM of MSA (Table S1). Higher percentages of TFA, on the other hand, always producing decreasing retention (Table S1).
3.2. Comparison of UHPSFC-UV vs. UHPLC-UV for peptides analysis
3.2.1. Influence of peptide isoelectric point on selectivity
Following the first part of the study, an investigation of how
UHPSFC might provide practical advantages over UHPLC (under
RPLC conditions) for the analysis of peptides was performed. For
this purpose, the six previously described synthetic peptides (i.e.
1N, 2N, 1B, 2B, 1A and 2A) possessing either acidic, neutral or basic
isoelectric points were evaluated under UHPSFC and UHPLC conditions. Fig. 5 shows the corresponding chromatograms obtained
with the two chromatographic techniques. Some trends become
immediately visible. Firstly, the elution order is not the same: in
6
G.L. Losacco, J.O. DaSilva, J. Liu et al.
Journal of Chromatography A 1642 (2021) 462048
Fig. 5. Chromatograms obtained under UHPSFC-UV (left) and in UHPLC-UV (right) for the set of 6 synthetic peptides with increasing isoelectric point values (from bottom
to the top: peptide 1A, 2A, 1N, 2N, 1B, 2B).
UHPLC acidic peptides show divergent retention, as seen with peptide 1A and 2A, being respectively the first and last eluted peptides among those tested. Neutral peptides, in UHPLC, are followed
by basic peptides, but the separation can become hard to achieve
(peptides 2N and 1B). While in UHPLC it was not always possible
to obtain separate elution windows between peptides according to
their pI value, as seen in the case of peptides 1A and 2A, with
UHPSFC this was obtained (Fig. 5). Indeed, in UHPSFC peptides retention appears grouped according to pI: acidic, neutral and basic
peptides possess their own elution windows, allowing a clear separation between these three groups for this example. The elution
order is also different to the UHPLC one: neutral peptides are the
least retained ones by the stationary phase, then the basic ones
are eluted before those with an acidic pI. In reversed-phase UHPLC conditions, peptides are generally retained as hydrophobicity
becomes higher, especially when TFA is employed in the mobile
phase. In UHPSFC, the acidic environment protonates basic peptides to a higher degree compared to acidic peptides, but the presence of a positively charged stationary phase causes a stronger
electrostatic repulsion phenomenon (as described in the previous
section) with the basic peptides, thus reducing their retention. To
clarify, however, why neutral peptides (1N and 2N) were even less
retained under UHPSFC conditions compared to acidic and, more
importantly, basic peptides, the influence of the chain length needs
to be considered. A more detailed elucidation is given in the next
section (3.2.2).
In summary, while the retention generally appears to follow
the increase of pI in UHPLC, the retention behavior is different in UHPSFC. In the present example, the separation between
peptides having different pI in UHPLC was challenging in some
cases, as shown with peptides 2N and 1B On the other hand,
UHPSFC was able to provide a satisfactory resolution (Fig. 5).
While these results were all confirmed with the peptides at
disposal, additional work needs to be performed with different
samples.
3.2.2. Influence of peptide chain length on selectivity
Next to the impact of isoelectric point on retention and selectivity under UHPSFC and UHPLC, we also investigated the length
of their amino acidic sequence. For this purpose, a new series
of six synthetic peptides was employed (Table 1): peptide 6mer,
9mer, 12mer, 15mer, 18mer and 21mer. These peptides all share
the same isoelectric point, to rule out the influence of this parameter. These peptides were then injected under the same optimized UHPSFC and UHPLC conditions used in section 3.2.1. Under
UHPLC conditions, the elution of peptides with an amino acidic
chain length comprised between 9 and 21 amino acids does not
follow any order, as shown in Fig. 6. In addition, the selectivity between these different peptides was quite limited under these conditions and most of the peaks eluted within a narrow retention
time window. In UHPSFC, the separation is much better, and peptides retention increases linearly with the sequence length (Fig. 6),
without sacrificing the chromatographic resolution. The explanation of this retention behavior is quite obvious. Together with the
increase in peptide length, there is also an increase in the number of polar groups on the molecule (amide bonding in particular), thus generating a higher retention on the polar stationary
phase. Moreover, the electrostatic repulsion phenomenon would
become less important as the positive charge on the peptide could
be more delocalized when the peptide surface increases. In UHPLC, on the other hand, the apolar C18 stationary phase was not
able to discriminate between shorter and longer peptides, even
when using TFA as an ion pairing agent. This suggests that the
lipophilicity of the peptides does not increase significantly with
the increase of the length of their amino acidic chain for the
samples taken into consideration, thus reducing chromatographic
selectivity.
In section 3.2.1, it was highlighted that neutral peptides presented lower retention under UHPSFC conditions compared to basic ones. According to the electrostatic repulsion hypothesis, the
opposite elution order would have been expected as basic peptides
7
G.L. Losacco, J.O. DaSilva, J. Liu et al.
Journal of Chromatography A 1642 (2021) 462048
should have a higher positive charge density compared to neutral
peptides. However, an important parameter was left out from the
discussion: peptides 1 N and 2 N have an amino acid chain length
with 3 amino acids less compared to peptides 1B and 2B As it was
just described, shorter peptides are less retained under UHPSFC
conditions. This phenomenon could, therefore, influences the unexpected elution order previously observed between neutral and basic peptides, in combination with the different pI values possessed
by these samples.
analyzing samples with a wide range of polarities on a single stationary and mobile phase.
A closer look to specific samples is shown in Figs. 7–8. In Fig. 7,
a comparison between UHPLC and UHPSFC for control and stressed
samples of leuprorelin is given (sequence of 9 amino acids). Both
techniques provided a comparable chromatographic profile for the
control sample, as well as the one stressed under acidic conditions,
with impurity 1 ([M + H]+ = m/z 1101 under UHPLC-MS conditions, [M + 2H]2+ = m/z 551 for UHPSFC-MS) always eluting prior
to the main peak. The situation slightly varies with the basic conditions (Fig. 7). In this case, UHPSFC offered a better selectivity between impurities 2 ([M + H]+ = m/z 777), 1 ([M + H]+ = m/z
1101 under UHPLC-MS conditions, [M + 2H]2+ = m/z 551 for
UHPSFC-MS) and 3 ([M + H]+ = m/z 1194 under UHPLC-MS conditions, [M + 2H]2+ = m/z 598 for UHPSFC-MS. Interestingly, in
UHPSFC conditions, the elution order of impurities 1, 2 and 3 as
well as leuprorelin was proportional to the molecular weights of
the impurities. However, the chromatographic profile obtained after an oxidative stress was better resolved with the UHPLC method
(Fig. 7), where a larger number of impurities was observed. The
two new impurities 4 ([M + H]+ = m/z 1228 for UHPLC-MS,
[M + 2H]2+ = m/z 615 for UHPSFC-MS) and 5 ([M + H]+ = m/z
1245 for UHPLC-MS, [M + 2H]2+ = m/z 622 for UHPSFC-MS) were
eluted in opposite order by both methods.
Similar results were found with a second linear peptide,
glucagon (Fig. 8). This 29 amino acid peptide possesses one of
the longest amino acidic sequence among all samples tested in
this work, as well as a relatively low GRAVY number, indicating
a high polarity. Nonetheless, this peptide was eluted under UHPSFC conditions with a satisfactory peak shape using high amount
of co-solvent (around 85% MeOH). Again, control as well as acidic
stressed samples gave comparable profiles with both chromatographic techniques (Fig. 8). Impurities obtained after the addition
of 0.1 M NaOH and hydrogen peroxide followed the same trends
3.3. Application to the analysis of commercially available peptides
3.3.1. Analysis of linear and cyclic peptides
Various commercial therapeutic peptides (both linear and cyclic
ones) were analyzed using the developed UHPSFC and the reference UHPLC methods. Furthermore, a MS detector was hyphenated
to evaluate its performance with the developed UHPSFC method in
comparison with the UHPLC one. Three linear (i.e. liraglutide, leuprorelin and glucagon) and cyclic (i.e. linaclotide, eptifibatide and
cyclosporin A) therapeutic peptides have been employed in this
part (Table 1). In addition, three different stressing procedures (i.e.
acidic, basic or oxidative) were performed. Four samples for each
peptide (control sample + 3 stressed sample) were, therefore evaluated in UHPSFC and UHPLC conditions. Chromatograms of control and stressed samples for each peptide with the two chromatographic techniques are shown in Fig. S3 for UHPSFC and Fig. S4 for
UHPLC. All linear and cyclic peptides were eluted under UHPSFC
conditions, while under UHPLC conditions, cyclosporine A could
not be eluted under the generic conditions, even after a modification of the gradient profile to reach up to 95% ACN in the mobile phase. This result is not surprising, since cyclosporin A is a
highly lipophilic cyclic peptide. In UHPSFC, a lower percentage of
co-solvent in the gradient allowed the successful analysis of this
particular sample. This result confirms the flexibility of UHPSFC at
Fig. 6. Chromatograms obtained under UHPSFC-UV (left) and in UHPLC-UV (right), for the set of 6 synthetic peptides with increasing amino acidic chain length (from bottom
to the top: peptide 6mer, 9mer, 12mer, 15mer, 18mer, 21mer).
8
G.L. Losacco, J.O. DaSilva, J. Liu et al.
Journal of Chromatography A 1642 (2021) 462048
Fig. 7. Chromatograms obtained for leuprorelin and leuprorelin + impurities after exposure to different stress conditions in UHPSFC-UV-MS and UHPLC-UV-MS.
Fig. 8. Chromatograms obtained for glucagon and glucagon + impurities after exposure to different stress conditions in UHPSFC-UV-MS and UHPLC-UV-MS.
9
G.L. Losacco, J.O. DaSilva, J. Liu et al.
Journal of Chromatography A 1642 (2021) 462048
Fig. 9. Table representing the ratio between signal intensities (in blue) and signal-to-noise values (in yellow) obtained in UHPSFC-MS over UHPLC-MS conditions for five
commercial peptides. (For interpretation of the references to colour in this figure legend, the reader is referred to the web version of this article.)
as those previously reported for leuprorelin. Under basic conditions, glucagon impurity 1 ([M + 3H]3+ = m/z 1319 for UHPLC-MS,
[M + 4H]4+ = m/z 990 for UHPSFC-MS) and 2 ([M + 3H]3+ = m/z
1272 for UHPLC-MS, [M + 4H]4+ = m/z 954 for UHPSFC-MS) eluted
according to the length of their chain under UHPSFC-MS. The
same behavior was also observed for impurities 3 ([M + 3H]3+ [M + 4H]4+ of m/z 1179 and 885) and 4 ([M + 3H]3+ - [M + 4H]4+
of m/z 1168 and 881).
In Fig. S5 of the supplementary material, an example of a cyclic
peptide composed of 7 amino acids, eptifibatide, is given. This
peptide takes its characteristic cyclic structure after the formation of an intramolecular disulfide bridge between the two cysteine residues present in its chain. Once again, similar results have
been observed when this compound was evaluated under UHPLCMS and UHPSFC-MS conditions as to those previously discussed
for linear peptides. While for the control sample, as well as under acidic stress procedure, no major differences were observed,
while a larger number of impurities were observed after the exposure to 0.1 M NaOH. Impurities 1, 2 and 3 were better resolved
from the main peak in UHPSFC conditions, and a higher number of
impurities was visible compared to RP-UHPLC conditions. On the
other hand, similarly to leuprorelin and glucagon, impurities produced after an oxidative stress were better resolved under UHPLC
conditions.
Overall, this part demonstrated that UHPSFC was able, in almost
all examples, to generate comparable performance to UHPLC, and
gave complementary information (different elution behavior and
selectivity).
it is present at very low concentration in the UHPSFC method. Indeed, its average concentration in the gradient is equal to 4–5 mM
(corresponding to 4 – 5 mM in the mobile phase), which is much
lower than what is commonly employed in UHPLC (13 mM TFA).
Consequently, as shown in Fig. 9, UHPSFC provided comparable
signal intensities, as well as signal-to-noise values, to UHPLC. For
the remaining two peptides, either the ratio is close to one (in the
case of liraglutide) or simply UHPSFC did not provide the same MS
sensitivity as UHPLC does (in the example of eptifibatide). Interestingly, the ionic species generated by the two chromatographic
techniques were not always similar (Fig. 9). This was also observed
in the previous section, as all impurities detected under UHPSFC
has a lower m/z ratio than in UHPLC. Indeed, it appeared that UHPSFC was able to better protonate peptides, especially those with
a relatively long chain (liraglutide and glucagon) compared to UHPLC, indicating a higher charge state of the ions. This phenomenon
was already observed by Wang and Olesik [38], describing how the
employment of mobile phases containing liquified CO2 provided
increased charged states and narrower charge state distributions.
The authors claimed that the addition of liquified CO2 mainly improved the desolvation process in the ESI ionization chamber.
3.3.3. Transferability of the UHPSFC method for peptides to
preparative scale
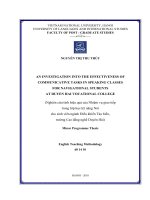
We next focused our efforts on a semipreparative purification of
a cyclic peptide API. This mixture was subjected to automated SFC
column screening [36] on eight different stationary phase columns
with gradient elution using MSA-rich modifiers (Fig. 10a). Several
columns were found to effectively separate the two components
in this reaction showing excellent peak shape and acceptable resolution (2-PIC, DEA and 4-EP). A straightforward optimization to
isocratic elution: 35% MeOH/H2 O 95:5 v/v + 8 mM MSA/ 65% CO2
on a Waters Torus 2-PIC (30.0 mm x 250 mm, 5 μm) column
at a flow rate of 140 mL/min enabled baseline resolution at the
semipreparative scale. This procedure facilitated a rapid delivery
of 84 mg of peptide (purity > 98%, yield > 95%) by five x 1 mL
stacked injections of 20 mg/mL peptide mixture (purity ≈ 69%)
in less than 15 min total runtime (Fig. 10b). This serves to illustrate the power of modern SFC technologies and the practical use
3.3.2. Evaluation of MS sensitivity between UHPSFC vs. UHPLC
The use of MSA in the UHPSFC chromatographic method and
its compatibility with MS detector was investigated. MSA is, indeed, a highly viscous organic acid with a relatively high boiling
point (close to 170 °C, indicating potential issues in its application in chromatographic methods combined to mass spectrometers). Therefore, a systematic study was carried out, focusing on
the ratio of the signal intensities, as well as of signal-to-noise values, obtained in UHPSFC and UHPLC for the commercial peptides
previously employed (Fig. 9). Although MSA is not highly volatile,
10
G.L. Losacco, J.O. DaSilva, J. Liu et al.
Journal of Chromatography A 1642 (2021) 462048
Fig. 10. a) Automated column screening of cyclic peptide using the mobile phase conditions in the Experimental section. b) Semipreparative purification of the cyclic peptide
on the 2-PIC column using the conditions listed in the Experimental section (top), the analysis of the sample before purification (middle) and after purification (bottom).
of MSA-rich modifiers in pharmaceutical setting at both analytical
and preparative scale.
of six commercially available peptides, of which three possessing
a linear structure and three with a cyclic one, were employed. Different stressing procedures were employed on each peptide, exposing them to either acidic, basic or oxidative stress. Results showed
that UHPSFC gave comparable, if not sometimes even better, performance to those observed with UHPLC. Regarding the MS sensitivities achieved in UHPSFC, it was seen that they were comparable to those observed under UHPLC conditions. Finally, the transferability of the developed analytical method to a semi-preparative
level was considered, and the semi-preparative SFC method shows
excellent performance in terms of yield and purity for a Merck
cyclic peptide.
All these results demonstrated that UHPSFC is a viable alternative for the analysis of highly polar compounds with high molecular weight such as peptides, utilizing a gradient reaching high percentages of co-solvent. Furthermore, UHPSFC has shown once more
its orthogonality against UHPLC, fueling even more its utility in analytical laboratories.
4. Conclusions
In this work, the possibilities offered by UHPSFC coupled to UV
and MS detectors, was evaluated for a series of synthetic and commercially available peptides. A systematic comparison with UHPLC was performed to draw the advantages and limitations of UHPSFC for this kind of analytes. At first, the choice of the stationary
phase, as well as an optimization of the mobile phase conditions
were achieved for UHPSFC. The combination between a positively
charged stationary phase with the addition of an acidic additive
in the mobile phase was found to be the one offering the best performance for peptide analysis. Later, the evaluation of a novel additive, methanesulfonic acid (MSA), was carried out and results were
compared to the more commonly used trifluoroacetic acid (TFA).
MSA demonstrated to provide significantly better chromatographic
performance against TFA, at a lower concentration in the mobile
phase (8 mM vs 15 mM).
In the second part of this study, the selectivity achieved in UHPSFC was discussed, with a systematic comparison with UHPLC
conditions. UHPSFC provided a different separation of peptides according to their isoelectric points vs. UHPLC. Furthermore, UHPSFC
allowed a very good discrimination between peptides with different amino acidic sequence lengths, while no such relationship was
demonstrated with UHPLC.
In the third part of this work, some applications of UHPSFC in
peptide analysis were evaluated and systematically compared to
UHPLC, both hyphenated to a MS detector. To this purpose, a set
Declaration of Competing Interest
The authors declare that they have no known competing financial interests or personal relationships that could have appeared to
influence the work reported in this paper.
CRediT authorship contribution statement
Gioacchino Luca Losacco: Writing - original draft, Methodology, Investigation. Jimmy Oliviera DaSilva: Investigation, Writing
- review & editing. Jinchu Liu: Investigation, Writing - review &
11
G.L. Losacco, J.O. DaSilva, J. Liu et al.
Journal of Chromatography A 1642 (2021) 462048
editing. Erik L. Regalado: Supervision, Writing - review & editing, Resources. Jean-Luc Veuthey: Supervision, Writing - review &
editing. Davy Guillarme: Supervision, Writing - review & editing,
Project administration.
[20] G.L. Losacco, J.-.L. Veuthey, D. Guillarme, Supercritical fluid chromatography
– Mass spectrometry: recent evolution and current trends, TrAC Trends Anal.
Chem. 118 (2019) 731–738, doi:10.1016/j.trac.2019.07.005.
[21] E. Lesellier, C. West, The many faces of packed column supercritical fluid chromatography – A critical review, Ed. Choice IX 1382 (2015) 2–46, doi:10.1016/j.
chroma.2014.12.083.
[22] M.A. Patel, F. Riley, J. Wang, M. Lovdahl, L.T. Taylor, Packed column supercritical fluid chromatography of isomeric polypeptide pairs, J. Chromatogr. A. 1218
(2011) 2593–2597, doi:10.1016/j.chroma.2011.03.005.
[23] M. Ventura, Advantageous use of SFC for separation of crude therapeutic
peptides and peptide libraries, J. Pharm. Biomed. Anal. 185 (2020) 113227,
doi:10.1016/j.jpba.2020.113227.
[24] K. Govender, T. Naicker, S. Baijnath, H.G. Kruger, T. Govender, The development of a sub/supercritical fluid chromatography based purification method
for peptides, J. Pharm. Biomed. Anal. 190 (2020) 113539, doi:10.1016/j.jpba.
2020.113539.
[25] J. Liu, A.A. Makarov, R. Bennett, I.A. Haidar Ahmad, J. DaSilva, M. Reibarkh,
I. Mangion, B.F. Mann, E.L. Regalado, Chaotropic Effects in Sub/Supercritical
Fluid Chromatography via Ammonium Hydroxide in Water-Rich Modifiers: enabling Separation of Peptides and Highly Polar Pharmaceuticals at the Preparative Scale, Anal. Chem. 91 (2019) 13907–13915, doi:10.1021/acs.analchem.
9b03408.
[26] G.L. Losacco, O. Ismail, J. Pezzatti, V. González-Ruiz, J. Boccard, S. Rudaz, J..L. Veuthey, D. Guillarme, Applicability of Supercritical fluid chromatography–
Mass spectrometry to metabolomics. II–Assessment of a comprehensive library
of metabolites and evaluation of biological matrices, J. Chromatogr. A. (2020)
461021, doi:10.1016/j.chroma.2020.461021.
[27] K. Taguchi, E. Fukusaki, T. Bamba, Simultaneous analysis for water- and fatsoluble vitamins by a novel single chromatography technique unifying supercritical fluid chromatography and liquid chromatography, J. Chromatogr. A.
1362 (2014) 270–277, doi:10.1016/j.chroma.2014.08.003.
[28] A. Raimbault, A. Noireau, C. West, Analysis of free amino acids with unified
chromatography-mass spectrometry—Application to food supplements, J. Chromatogr. A. 1616 (2020) 460772, doi:10.1016/j.chroma.2019.460772.
[29] V. Desfontaine, G.L. Losacco, Y. Gagnebin, J. Pezzatti, W.P. Farrell, V. GonzálezRuiz, S. Rudaz, J.-.L. Veuthey, D. Guillarme, Applicability of supercritical fluid
chromatography – mass spectrometry to metabolomics. I – Optimization
of separation conditions for the simultaneous analysis of hydrophilic and
lipophilic substances, J. Chromatogr. A. 1562 (2018) 96–107, doi:10.1016/j.
chroma.2018.05.055.
[30] E. Gasteiger, A. Gattiker, C. Hoogland, I. Ivanyi, R.D. Appel, A. Bairoch, ExPASy:
the proteomics server for in-depth protein knowledge and analysis, Nucleic
Acids Res 31 (2003) 3784–3788, doi:10.1093/nar/gkg563.
[31] E. Gasteiger, C. Hoogland, A. Gattiker, S. Duvaud, M.R. Wilkins, R.D. Appel,
A. Bairoch, Protein Identification and Analysis Tools on the ExPASy Server, in:
J.M. Walker (Ed.), Proteomics Protoc. Handb., Humana Press, Totowa, NJ, 2005,
pp. 571–607, doi:10.1385/1- 59259- 890- 0:571.
[32] M.A. Patel, F. Riley, M. Ashraf-Khorassani, L.T. Taylor, Supercritical fluid chromatographic resolution of water soluble isomeric carboxyl/amine terminated
peptides facilitated via mobile phase water and ion pair formation, J. Chromatogr. A. 1233 (2012) 85–90, doi:10.1016/j.chroma.2012.02.024.
[33] K. Govender, T. Naicker, S. Baijnath, A.A. Chuturgoon, N.S. Abdul, T. Docrat,
H.G. Kruger, T. Govender, Sub/supercritical fluid chromatography employing
water-rich modifier enables the purification of biosynthesized human insulin,
J. Chromatogr. B. 1155 (2020) 122126, doi:10.1016/j.jchromb.2020.122126.
[34] L.T. Taylor, Packed column supercritical fluid chromatography of hydrophilic
analytes via water-rich modifiers, J. Chromatogr. A. 1250 (2012) 196–204,
doi:10.1016/j.chroma.2012.02.037.
[35] N.M. Schiavone, R. Bennett, M.B. Hicks, G.F. Pirrone, E.L. Regalado, I. Mangion,
A.A. Makarov, Evaluation of global conformational changes in peptides and
proteins following purification by supercritical fluid chromatography, J. Chromatogr. B. 1110–1111 (2019) 94–100, doi:10.1016/j.jchromb.2019.02.012.
[36] J.A. Blackwell, R.W. Stringham, Effect of Mobile Phase Components on the Separation of Polypeptides Using Carbon Dioxide-Based
Mobile Phases, J. High Resolut. Chromatogr. 22 (1999) 74–78
10.1002/(SICI)1521-4168(19990201)22:2<74::AID-JHRC74>3.0.CO;2-9.
[37] C. West, J. Melin, H. Ansouri, M.Mengue Metogo, Unravelling the effects of
mobile phase additives in supercritical fluid chromatography. Part I: polarity and acidity of the mobile phase, J. Chromatogr. A. 1492 (2017) 136–143,
doi:10.1016/j.chroma.2017.02.066.
[38] Y. Wang, S.V. Olesik, Enhanced-Fluidity Liquid Chromatography–Mass Spectrometry for Intact Protein Separation and Characterization, Anal. Chem. 91
(2019) 935–942, doi:10.1021/acs.analchem.8b03970.
References
[1] J.L. Lau, M.K. Dunn, Therapeutic peptides: historical perspectives, current development trends, and future directions, Pept. Ther. 26 (2018) 2700–2707,
doi:10.1016/j.bmc.2017.06.052.
[2] W. Chu, R. Prodromou, K.N. Day, J.D. Schneible, K.B. Bacon, J.D. Bowen,
R.E. Kilgore, C.M. Catella, B.D. Moore, M.D. Mabe, K. Kalashoo, Y. Xu, Y. Xiao,
S. Menegatti, Peptides and pseudopeptide ligands: a powerful toolbox for the
affinity purification of current and next-generation biotherapeutics, J. Chromatogr. A. (2020) 461632, doi:10.1016/j.chroma.2020.461632.
[3] F.G. Banting, C.H. Best, J.B. Collip, W.R. Campbell, A.A. Fletcher, Pancreatic Extracts in the Treatment of Diabetes Mellitus, Can. Med. Assoc. J. 12 (1922)
141–146.
[4] P.F.A. HOEFER, G.H. GLASER, Effects of pituitary adrenocorticotropic hormone
(ACTH) therapy; electroencephalographic and neuropsychiatric changes in fifteen patients, J. Am. Med. Assoc. 143 (1950) 620–624, doi:10.1001/jama.1950.
02910420 0 080 03.
[5] S.W.J. Lamberts, L.J. Hofland, ANNIVERSARY REVIEW: octreotide, 40 years later,
Eur. J. Endocrinol. 181 (2019) R173–R183, doi:10.1530/EJE- 19- 0074.
[6] G.L. Plosker, R.N. Brogden, Leuprorelin. A review of its pharmacology and therapeutic use in prostatic cancer, endometriosis and other
sex hormone-related disorders, Drugs 48 (1994) 930–967, doi:10.2165/
0 0 0 03495-199448060-0 0 0 08.
[7] A.L. Smart, S. Gaisford, A.W. Basit, Oral peptide and protein delivery: intestinal
obstacles and commercial prospects, Expert Opin. Drug Deliv. 11 (2014) 1323–
1335, doi:10.1517/17425247.2014.917077.
[8] A. Jain, A. Jain, A. Gulbake, S. Shilpi, P. Hurkat, S.K. Jain, Peptide and protein
delivery using new drug delivery systems, Crit. Rev. Ther. Drug Carrier Syst. 30
(2013) 293–329, doi:10.1615/critrevtherdrugcarriersyst.2013006955.
[9] J.-.F. Yao, H. Yang, Y.-.Z. Zhao, M. Xue, Metabolism of Peptide Drugs and Strategies to Improve their Metabolic Stability, Curr. Drug Metab. 19 (2018) 892–901,
doi:10.2174/1389200219666180628171531.
[10] K. Kuczera, Molecular modeling of peptides, Methods Mol. Biol. Clifton NJ.
1268 (2015) 15–41, doi:10.1007/978- 1- 4939- 2285- 7_2.
[11] M. Erak, K. Bellmann-Sickert, S. Els-Heindl, A.G. Beck-Sickinger, Peptide chemistry toolbox - Transforming natural peptides into peptide therapeutics, Bioorg.
Med. Chem. 26 (2018) 2759–2765, doi:10.1016/j.bmc.2018.01.012.
[12] Y. Yang, Specific enrichment of a targeted nitrotyrosine-containing peptide
from complex matrices and relative quantification for liquid chromatography–
mass spectrometry analysis, J. Chromatogr. A. 1485 (2017) 90–100, doi:10.1016/
j.chroma.2017.01.036.
[13] A.K. Florentinus, P. Bowden, G. Sardana, E.P. Diamandis, J.G. Marshall, Identification and quantification of peptides and proteins secreted from prostate epithelial cells by unbiased liquid chromatography tandem mass spectrometry
using goodness of fit and analysis of variance, J. Proteomics. 75 (2012) 1303–
1317, doi:10.1016/j.jprot.2011.11.002.
[14] M.C. García, The effect of the mobile phase additives on sensitivity in the
analysis of peptides and proteins by high-performance liquid chromatography–
electrospray mass spectrometry, Improv. Sensit. Liq. Chromatogr.-MASS Spectrom. 825 (2005) 111–123, doi:10.1016/j.jchromb.2005.03.041.
[15] C.T. Mant, L.H. Kondejewski, P.J. Cachia, O.D. Monera, R.S. Hodges, [19]Analysis
of synthetic peptides by high-performance liquid chromatography, in: Methods Enzymol., Academic Press, 1997, pp. 426–469, doi:10.1016/S0076-6879(97)
89058-1.
[16] R. Karongo, T. Ikegami, D.R. Stoll, M. Lämmerhofer, A selective comprehensive reversed-phase×reversed-phase 2D-liquid chromatography approach with
multiple complementary detectors as advanced generic method for the quality
control of synthetic and therapeutic peptides, J. Chromatogr. A. 1627 (2020)
461430, doi:10.1016/j.chroma.2020.461430.
[17] C. Zhang, R. Zhang, Q. Li, Y. Huang, L. Zhao, Z. Su, F. Gong, Z. Lv, H. Song, W. Li,
Q. Yuan, G. Ma, Rapid octreotide separation from synthetic peptide crude mixtures by chromatography on poly(styrene–co-divinylbenzene)-based reversed
phases, Sep. Purif. Technol. 154 (2015) 351–358, doi:10.1016/j.seppur.2015.09.
050.
[18] A. Van Eeckhaut, D. Mangelings, Toward greener analytical techniques for the
absolute quantification of peptides in pharmaceutical and biological samples,
Rev. 2015 113 (2015) 181–188, doi:10.1016/j.jpba.2015.03.023.
[19] V. Desfontaine, D. Guillarme, E. Francotte, L. Nováková, Supercritical fluid chromatography in pharmaceutical analysis, Rev. 2015 113 (2015) 56–71, doi:10.
1016/j.jpba.2015.03.007.
12