Chromatographic analysis of oxidized cello-oligomers generated by lytic polysaccharide monooxygenases using dual electrolytic eluent generation
Bạn đang xem bản rút gọn của tài liệu. Xem và tải ngay bản đầy đủ của tài liệu tại đây (2.96 MB, 11 trang )
Journal of Chromatography A 1662 (2022) 462691
Contents lists available at ScienceDirect
Journal of Chromatography A
journal homepage: www.elsevier.com/locate/chroma
Chromatographic analysis of oxidized cello-oligomers generated by
lytic polysaccharide monooxygenases using dual electrolytic eluent
generation
Heidi Østby, John-Kristian Jameson, Thales Costa, Vincent G.H. Eijsink, Magnus Ø. Arntzen∗
˚s N-1432, Norway
Norwegian University of Life Sciences (NMBU), Faculty of Chemistry, Biotechnology, and Food Science, P.O. Box 5003, A
a r t i c l e
i n f o
Article history:
Received 29 September 2021
Revised 14 November 2021
Accepted 16 November 2021
Available online 19 November 2021
Keywords:
Dual EGC
LPMO
Lytic polysaccharide monooxygenase
Ion chromatography
HPAEC
a b s t r a c t
Research on oligosaccharides, including the complicated product mixtures generated by lytic polysaccharide monooxygenases (LPMOs), is growing at a rapid pace. LPMOs are gaining major interest, and the ability to efficiently and accurately separate and quantify their native and oxidized products chromatographically is essential in furthering our understanding of these oxidative enzymes. Here we present a novel set
of methods based on dual electrolytic eluent generation, where the conventional sodium acetate/sodium
hydroxide (NaOAc/NaOH) eluents in high-performance anion-exchange chromatography (HPAEC) are replaced by electrolytically-generated potassium methane sulfonate/potassium hydroxide (KMSA/KOH). The
new methods separate all compounds of interest within 24–45 min and with high sensitivity; limits of
detection and quantification were in the range of 0.0 0 01–0.0 032 mM and 0.0 0 02–0.0 096 mM, respectively. In addition, an average of 3.5 times improvement in analytical CV was obtained. This chromatographic platform overcomes drawbacks associated with manual preparation of eluents and offers simplified operation and rapid method optimization, with increased precision for less abundant LPMO-derived
products.
© 2021 The Authors. Published by Elsevier B.V.
This is an open access article under the CC BY license ( />
1. Introduction
As the most abundant organic polymer on Earth, cellulose constitutes a highly interesting and desirable potential feedstock for
the production of renewable, sustainable fuels and chemicals. Cellulolytic enzymes that catalyze the hydrolysis of this polysaccharide have thus been an important research target for several
decades. Reese et al. postulated as early as in 1950 that cellulose
degradation encompasses the action of two main enzyme types –
one “decrystallizing” enzyme that converts native, crystalline cellulose to more accessible shorter chains, and another that hydrolyzes the shorter cellulose chains to oligo- and monosaccharides [1]. Cellulose breakdown was long believed to be performed
solely through the action of hydrolytic enzymes, until a breakthrough discovery in 2010, which showed oxidative cleavage of
polysaccharides by a new class of enzymes, namely lytic polysaccharide monooxygenases (LPMOs) [2–10]. LPMOs are critical cellulolytic enzymes because they create chain breaks in highly crystalline areas of the cellulose polymer, and therefore enable access
∗
Corresponding author.
E-mail address: (M.Ø. Arntzen).
for canonical cellulases to further degrade the substrate. Indeed,
cellulolytic LPMOs have become essential in commercial cellulase
cocktails, utilized in modern biorefinery operations to produce sustainable, value-added products from second-generation lignocellulosic feedstocks [11,12].
These copper-dependent LPMOs are unique in that they use an
oxidative mechanism to cleave glycosidic bonds. Cleavage of cellulose generates a product with an oxidized carbon at the C1 or the
C4 position, or, for some LPMOs, a mixture of these products. The
C1-oxidized product is a lactone, which is spontaneously hydrated
to an aldonic acid. Oxidation at the C4 position generates a ketoaldose which is in equilibrium with its geminal diol form. The hydrated forms of these oxidized sugars, i.e., the aldonic acid or the
gemdiol form, are most prevalent in aqueous solutions at physiologically relevant pH [13]. LPMOs acting alone on cellulose will
modify the insoluble substrate to contain C1- and/or C4-oxidized
sites and will release soluble oxidized cello-oligomers in the range
of approximately DP2 – DP10 (DP; degree of polymerization). If the
LPMO is part of a cellulolytic enzyme cocktail containing cellulases
and a β -glucosidase, soluble oxidized products will be degraded
and appear as gluconic acid (for C1 oxidation) or the gemdiol of 4keto-cellobiose (for C4 oxidation) [14,15]. Proper identification and
quantification of LPMO products is of high importance, since this
/>0021-9673/© 2021 The Authors. Published by Elsevier B.V. This is an open access article under the CC BY license ( />
H. Østby, J.-K. Jameson, T. Costa et al.
Journal of Chromatography A 1662 (2022) 462691
will help understand how these powerful oxidative enzymes work,
allow monitoring of LPMO action during cellulose bioprocessing,
and enable better harnessing of the power of these remarkable enzymes.
LPMO products pose major challenges regarding separation and
quantification via chromatography or mass spectrometry due to
their minor structural differences as compared to native oligosaccharides [13,16]. Hydrophilic interaction liquid chromatography
(HILIC) and porous graphitized carbon liquid chromatography
(PGC-LC) are often used for the separation and identification of
oligosaccharide species. HILIC, with its polar stationary phase coupled with a non-polar eluent, enables retention of hydrophilic
components [17], and has been used to separate carbohydrates
since 1975 [18]. HILIC has previously been used to efficiently separate both neutral and C1-oxidized oligosaccharides [19], but baseline separation of C4-oxidized products has proven challenging
with this method [16]. Additionally, high ionic strength of the
eluent has been required to yield satisfactory separation of C1oxidized oligosaccharides, limiting the use of this method with
MS detection [16]. PGC columns allow retention of oligosaccharides
due to polar interactions between the sugar and the PGC column
material [20], and separation is based on size, type of linkage, and
3D-structure [19]. PGC-LC has previously been used to achieve efficient separation of C1- and C4-oxidized species in LPMO product mixtures but causes near co-elution of C4-oxidized and native
oligosaccharides. MS-based detection is therefore crucial in product
identification, which is possible, as PGC-LC is fully compatible with
online MS detection [16,19,21]. The limitation is that medium- to
long-chain oligosaccharides tend to show very strong retention to
PGC columns; in fact, oligosaccharides with a DP above five are
rarely eluted [19].
Although both HILIC and PGC-LC give acceptable separation of
oligosaccharides, when it comes to analyzing the complex product
mixtures generated by LPMOs, neither method can compete with
the sensitivity and separation achieved with high performance
anion-exchange chromatography with pulsed amperometric detection (HPAEC-PAD) [19]. In HPAEC, sugar hydroxyl groups are deprotonated by applying an eluent with a high pH, causing the sugars to behave as weak anions and bind to a polymer-based anionexchange resin [22]. Then, by applying a gradient of increasing salt
concentration, the weakly acidic sugar species will be displaced
from the column according to the number of charged groups they
carry, which corresponds to the chain length of the oligosaccharides. In conventional HPAEC-analysis of oligosaccharides, the eluent is typically a solution of sodium hydroxide (0.1 M NaOH) and
the salt is sodium acetate (1 M NaOAc). The NaOAc salt used during the gradient elution acts as a competing ion with the sugars, binding strongly to the column ion-exchange sites, thus displacing the oligosaccharides as the salt concentration increases, resulting in staggered elution [22]. The PAD detection is based on
the electrocatalytic oxidation of sugars at high pH catalyzed by
a gold working electrode [22]. HPAEC-PAD is generally considered
the most advantageous method for the separation of neutral and
charged oligosaccharides in terms of both resolution and sensitivity. HPAEC-PAD analysis of LPMO products comes with the disadvantage of not being compatible with MS, due to the fact that elution of charged groups (i.e., the aldonic acids) requires gradients
with high salt concentrations [19]. Still, HPAEC-PAD is an excellent method for LPMO research because the method can separate
native, C1-, C4-, and C1/C4-oxidized cello-oligomers, despite the
minor structural differences between these compounds [16,19]. At
high pH, C1-oxidized products are inherently stable aldonic acids.
These are relatively simple to analyze using HPAEC-PAD, and can
be separated from native products using short run times [19]. C4oxidized products, however, are unstable at high pH, and will undergo partial on-column decomposition [16]. These decomposition
processes generate products that can be used as a proxy for quantifying C4 oxidation [15,16] as well as native products that have
lost the (C4-oxidized) sugar at the non-reducing end [13,16].
One major issue associated with HPAEC separation of oligosaccharides is the penetration of CO2 into the eluents, which eventually leads to accumulation of carbonate on the column. Here the
carbonate ions will occupy the anion-exchange sites of the column,
causing reduced retention of the analytes [22]. To minimize this effect, eluents are degassed and protected from exposure to air using
a continuous flow of N2 gas. Since this procedure requires meticulous care on the user side, it is prone to error, resulting in unstable
retention times. The recently developed technology for electrolytic
eluent generation [23] circumvents this issue by only requiring
deionized water to be used in the system. By passing the deionized
water through eluent generator cartridges (EGCs) and multiple degassers, eluents with the correct hydroxide and salt concentrations
are produced on-demand without significant user input, and with
no risk of CO2 -contamination.
Recently, a viable platform for oligosaccharide separation using
electrolytically generated eluents has been established based on
the use of potassium methanesulfonate and potassium hydroxide
(KMSA/KOH) [23]. The electrolytic eluent generation occurs in two
different EGCs connected in series, one containing concentrated
potassium methanesulfonate (KMSA) and one containing concentrated potassium hydroxide (KOH). Dual electrolytic eluent generation technology has already been shown to offer equal performance in oligosaccharide separation as compared to traditional
NaOAc/NaOH-based HPAEC-PAD, and entails cleaner, less laborious,
and less error-prone eluent generation [23]. To assess the suitability of this new technology for analyzing oxidized oligosaccharides
and to generate new methods for LPMO research, we have assessed
and further developed the EGC technology for use in HPAEC analysis of the products of LPMO reactions. We demonstrate that dual
electrolytic eluent generation is highly suitable for the separation
and quantification of oxidized oligosaccharides and present a set of
methods for their improved analysis.
2. Materials and methods
2.1. Chromatography
Method development was carried out using an ion chromatography system, ICS-60 0 0 system from Dionex (Thermo Scientific) set
up with PAD with a disposable gold electrode utilizing the Dionex
Gold-Carbo-Quad waveform (detection potential +0.1 V maintained
for 400 ms, followed by 10 ms at -2.0 V, a rapid increase to
+0.6 V, and 60 ms at -0.1 V [24]). For oligosaccharide analysis, we
used a 1 × 250 mm Dionex CarboPac PA-200 analytical column
(Thermo Scientific) connected to a 1 × 50 mm guard column of
the same type. The operational flow was 63 μL/min and the sample loop had a volume of 4 μL. For monosaccharide analysis, we
used a 2 × 150 mm Dionex CarboPac PA-210-Fast-4 μm column
(Thermo Scientific) connected to a 2 × 30 mm guard column of
the same type. In this case, the operational flow was 200 μL/min
and the sample loop volume was 0.4 μL. The columns were kept at
30 °C. Eluents were generated electrolytically using only distilled
H2 O (type I, 18.2 M •cm) and eluent generator cartridges within
the instrument (KMSA/KOH for oligosaccharides and KOH only for
monosaccharides). The gradients used are described in the Results
section and shown in detail in Table 1. For all gradients developed
to separate oligosaccharides, a set concentration of 100 mM KOH
was used. The concentration of KMSA was varied according to the
individual gradient.
For comparative purposes, selected oligosaccharide samples
were also analyzed on a Dionex ICS-50 0 0 system (Thermo Scientific), set up with PAD detection and a 3 × 250 mm PA-200 col2
H. Østby, J.-K. Jameson, T. Costa et al.
Journal of Chromatography A 1662 (2022) 462691
Table 1
Gradients for the three main chromatographic methods for analysis of LPMO products. This table shows three optimized methods for separating native, C1-, and C4-oxidized
cello-oligosaccharides using dual EGC with KMSA/KOH and an ICS-60 0 0 HPAEC system. The concentration of KOH was kept constant at 100 mM for all time points in all
methods.
Native
Native and C1-oxidized
Native, C1-, and C4-oxidized
Time [min]
KMSA [mM]
Dionex Curve
Time [min]
KMSA [mM]
Dionex Curve
Time [min]
KMSA [mM]
Dionex Curve
0
6
10
15
15.1
24
0
30
100
100
0
0
5
5
7
5
5
5
0
14
17
17.1
26
1
100
100
1
1
5
8
5
5
5
0
8.5
17
27
27.1
36
36.1
45
0
15
27
100
100
100
0
0
5
3
5
7
5
5
5
5
umn Dionex CarboPac PA-200 analytical column (Thermo Scientific) connected to a 3 × 50 mm guard column of the same type,
and using previously optimized protocols for NaOH/NaOAc-based
elutions [13]. Fresh eluents (A: 0.1 M NaOH; B: 1 M NaOAc, 0.1 M
NaOH) were prepared as previously described [13]. The operational
flow was 500 μL/min and the sample loop volume was 5 μL. The
optimized and routine gradient used for this setup was as follows:
0–3 min, from 100% A to 94.5 % A, 5.5 % B, linear; 3–9 min, from
94.5 % A, 5.5 % B to 85 % A, 15 % B. linear; 9–20 min, from 85 % A,
15 % B to 100 % B, Dionex curve 4; 20–26 min, 100% A.
Chromeleon version 7.2.9 was used for instrument control and
analysis for both the ICS-50 0 0 and the ICS-60 0 0. Peaks were integrated using a valley-to-valley baseline and standard curves were
created for each component over 3–6 concentration levels, with
replicates. The standard curve was obtained by calculating a polynomial regression line (order 2) through all points, including the
origin. Limits of detection (LOD) and quantification (LOQ) were
calculated based on the Calibration Approach [25]. The lower 2-3
concentrations and the origin were used for linear regression and
the LOD was defined as 3.3 × SEy / slope, and the LOQ as 10 ×
SEy / slope, where SEy is the standard error of the y-intercept.
For the comparison of the performance of the ICS-60 0 0 and ICS50 0 0 when analyzing C1-oxidized oligosaccharides, we measured
12 consecutive pseudo-blanks (water spiked with a known, minimal amount of standard; 0.0 0 05 g/L) and the LOD was defined
as 3.9 × STD / slope of a 3-point standard curve for each compound, and the LOQ as 3.3 × LOD [25]. This latter procedure provided more data points compared to the Calibration Approach and
allowed for a more accurate comparison of both precision (CV; coefficient of variation) and detection limits of the two systems.
All samples were analyzed as consecutive runs, often within the
same day and in total within three months of instrument usage;
hence, only minimal day-to-day variation or user-to-user variation
is visible within our data. It is anticipated that higher variation
may occur during routine analysis, particularly for systems using
manually prepared eluents.
swollen cellulose (PASC, 0.2% w/v; prepared from Avicel according
to [28]), LPMO (1 μM), and 1 mM ascorbic acid or gallic acid in
Tris-HCl buffer (50 mM, pH 7.5). ScLPMO10C and NcLPMO9C were
used to generate C1- and C4-oxidized products, respectively. All reactions were performed in 2 mL Eppendorf tubes with a total reaction volume of 200 μL. The reactions were incubated in an Eppendorf Thermomixer (Eppendorf, Hamburg, Germany) for 20 h at
45 °C with shaking at 10 0 0 rpm and were stopped by filtration using a 96-well filter plate (0.45 μm; Merck Millipore, Billerica, MA).
Control experiments without reductant were performed in parallel.
Products from reactions with ScLPMO10C or NcLPMO9C with
PASC and ascorbic acid were combined in order to obtain samples containing a mixture of C1- and C4-oxidized LPMO products.
In addition, products generated in reactions with ScLPMO10C, PASC
and gallic acid were treated with either TfCel6A (final concentration 1 μM; produced in-house [29,30]) or with a β -glucosidase
(final concentration 0.225 mg/mL; kindly provided by Novozymes,
Bagsværd, Denmark) for 20 h at 37 °C, in order to convert longer
C1-oxidized cello-oligosaccharides to a mixture of native products,
cellobionic acid and cellotrionic acid, or to a mixture of glucose
and gluconic acid, respectively.
2.3. Native, C1-, C4-, and C6-oxidized cello-oligosaccharide standards
Native cello-oligosaccharides were purchased from Megazyme
and combined in order to produce standards containing cellooligosaccharides ranging in degree of polymerization from 2–6. To
produce C1-oxidized standards, native cello-oligosaccharides were
mixed to final concentrations of 0.5 mM and treated with MtCDH
(produced in-house, as described previously [31]) to a final concentration of 2 μM in sodium acetate buffer (50 mM, pH 5.0). The
reaction was incubated in an Eppendorf Thermomixer (Eppendorf,
Hamburg, Germany) at 40 °C for 20 h.
To produce C4-oxidized standards, cellopentaose (0.25% w/v
Megazyme) was treated with NcLPMO9C (final concentration 2 μM;
[15,26]) and ascorbic acid (final concentration 2 mM) in Tris buffer
(10 mM, pH 8.0). The reaction was incubated in an Eppendorf Thermomixer (Eppendorf, Hamburg, Germany) for 24 h at 33 °C with
shaking at 800 rpm. Reactions were stopped by boiling for 15 min
at 100 °C in a heating block.
Gluconic acid and glucuronic acid standards were purchased
from Megazyme.
2.2. LPMOs and reactions
Both LPMOs utilized in this study (ScLPMO10C and NcLPMO9C)
were produced in-house as previously described [5,26] and coppersaturated [27]. Copper-saturation was performed by incubating purified LPMOs with a 3-fold molar excess of Cu(II)SO4 at room temperature for 30 min. The copper-saturated LPMO was subsequently
applied to a PD Midi-Trap G-25 column (GE Healthcare) to remove
excess free copper from the LPMO preparation. Protein concentrations were determined spectrophotometrically using A280 and theoretical extinction coefficients.
LPMO-catalyzed reactions were performed to generate real
product mixtures for use in method development on the ICS-60 0 0
system. Reactions were performed by incubating phosphoric acid-
3. Results and discussion
This study was focused on analyzing the products of LPMO reactions using a recently developed, improved ICS equipped with
two EGCs (hereafter referred to as ICS-60 0 0). Samples resulting
from LPMO reactions typically contain a mixture of native oligosaccharides, C1-oxidized oligosaccharides and C4-oxidized oligosac3
H. Østby, J.-K. Jameson, T. Costa et al.
Journal of Chromatography A 1662 (2022) 462691
charides, depending on the type of LPMO, the presence or absence
of other enzymes, and the substrate.
For assessing the capabilities of the novel ICS, we compared an
ICS-60 0 0 equipped with a 1 × 250 mm PA-200 column (63 μL/min
flow rate) for dual EGC gradients (KMSA/KOH) with an ICS-50 0 0
equipped with a 3 × 250 mm PA-200 column (500 μL/min flow
rate) for conventional gradients (NaOAc/NaOH). Taking into account the difference in column diameter between the two systems, the chosen flow rates should provide comparable chromatographic conditions, leaving the salt, KMSA vs. NaOAc, as the only
major variable parameter. The elution strength of the MSA ion is
believed to be about 1.8 times stronger than that of the acetate
ion [23], and the concentration range allowed by the ICS-60 0 0 instrument is 200 mM for KSMA and KOH together (so, if 100 mM
KOH is needed for adequate pH and peak shape, only 0–100 mM
KMSA is possible). Limitations in the maximum amount of salt
could lead to somewhat increased retention times for compounds
binding strongly to the column material.
All methods were optimized towards finding the optimal tradeoff between speed, separation power, and reproducibility. We
tested both stable KOH concentrations and linear or stepwise
changes in KOH-concentration during the gradient. For all oligosaccharides analyzed in this study, a constant KOH-concentration of
100 mM provided the best results. Furthermore, we tested both
linear, concave, and convex KMSA gradients, as well as combinations of these, and we monitored the pH-signal of the PAD detector
to determine the optimal post-run equilibration time.
9 min re-conditioning of the column at 1 mM KMSA. i.e., the
starting conditions (see Table 1 for details). This 26 min method
yielded baseline separation of C1-oxidized species in the DP2–
6 range (Glc1-5 Glc1A), while separation of native oligomers was
similar to what was achieved with the method described above
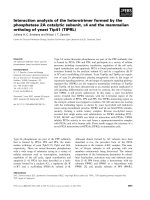
(Fig. 2). All components showed a linear response over the concentration range of 0–0.01 mM, with LOQs down to the range of
0.001–0.01 mM (using the Calibration Approach; LOQs down to
the range of 0.0 0 013–0.0 0 056 mM were observed using pseudoblanks; see Methods section and below). Saturation effects became
visible at higher concentrations, only for the longer DPs (Fig. 2C);
these effects are not prominent, and adequate quantification up to
0.02 mM is possible when using a polynomial calibration curve.
Importantly, with this method there was no co-elution of longer
native products with shorter C1-oxidized cello-oligosaccharides,
thus enabling efficient separation and identification of all components that may emerge upon treating cellulose with a C1-oxidizing
LPMO. Furthermore, Fig. 2 shows a high level of reproducibility between runs and the absence of shifts in elution times.
Surprisingly, when using this highly sensitive ICS-60 0 0 system,
we observed splitting of the peaks for the C1-oxidized products
at the highest applied concentration (0.02 mM). Such splitting has
not been reported before, and we currently do not have an explanation for why this occurs. During protocol optimization, minimization of peak splitting was introduced as an additional parameter, but it was not possible to abolish this phenomenon completely
without losing too much resolution. For compound quantification,
both peaks were jointly integrated.
3.1. Separation of native cello-oligosaccharides
3.3. Separation of mixtures of native, C1- and C4-oxidized
cello-oligosaccharides
LPMOs may generate native cello-oligosaccharides when cleaving near polymer chain ends, whereas such native oligomers are
the natural products of hydrolytic enzymes, such as cellulases, that
are frequently used in combination with LPMOs. When analyzing
a standard mixture of cello-oligosaccharides (Glc1-6 ), we achieved
the best results using a steep linear gradient from 0 to 30 mM
KMSA over the course of 6 min, followed by a concave gradient
(Dionex curve 7) to 100 mM KMSA over the course of 4 min, followed by 5 min at 100 mM KMSA and a 9 min re-equilibration
step at 0 mM KMSA (Table 1). This method yielded baseline separation of Glc1-6 within 15 min, with a total time per run of
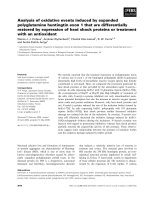
24 min (Fig. 1A). Due to the small column diameter and comparably large loop size (4 μL), we obtained high sensitivity of detection, down to 0.0 0 05 g/L for all components. For the peak with
the lowest intensity (Glc6 ; Fig. 1A, inset), the signal-to-noise ratio was as high as 162, which suggests that even lower concentrations could be reliably detected. All components showed a linear
response over the concentration range of 0–0.025 g/L, while saturation effects became visible at higher concentrations (Fig. 1B).
LODs and LOQs ranged between 0.0 0 01–0.0 0 02 g/L and 0.0 0 03–
0.0 0 06 g/L, respectively (Table 2). Of note, Fig. 1 shows a high level
of reproducibility between runs and the absence of shifts in elution
times.
C4-oxidized LPMO products undergo on-column modification
[16], and the resulting derivative products, which have been successfully used to quantify C4-oxidation [15], have higher retention
times than native and most C1-oxidized products. Thus, elution of
these derivative products, hereafter referred to as “C4-oxidized”
products, requires a higher concentration of KMSA. Some LPMO
reactions may contain both C1- and C4-oxidized products, which
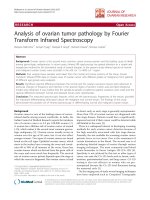
means that longer gradients are required to achieve good separation of all components. With this in mind, we developed a 45 min
method capable of adequate separation of native, C1-, and C4oxidized cello-oligosaccharides that avoids co-elution of products
of interest while yielding baseline separation of Glc2-6 , Glc1-5 Glc1A,
and the dimer and trimeric C4-oxidized product (Fig. 3). Of note,
Fig. 3A shows that the response factor for the C4-oxidized products
is much lower than for the other products. The low signals for C4oxidized products create issues, since these signals almost “drown”
in the signals for C1-oxidized products which, as shown in Fig. 3A,
have much higher response factors. The low response factors for
the C4-oxidized products may relate to the fact that the detected
compounds are the result of on-column modification processes induced by high pH [16]. The optimized gradient starts with a convex increase in KMSA concentration for 8.5 min, from 0 to 15 mM,
using Dionex curve 3. Thereafter, the concentration of KMSA is increased linearly to 27 mM over the course of 8.5 min. Finally, the
concentration of KMSA is increased to 100 mM in 10 min using
the concave Dionex curve 7. The gradient is completed with two
9 min steps, the first at 100 mM KMSA to wash the column, and
the second at 0 mM KMSA to re-condition the column (Table 1).
The C4-oxidized dimer showed a linear response over the concentration range of 0–0.08 mM, with LOQ down to 0.0035 mM, while
the trimer was linear between 0–0.005 mM with some mild saturation effects for higher concentrations. The LOQ for the trimer
was 0.0 0 02 mM (using the Calibration Approach; LOQs down to
0.00239 mM (dimer) and 0.00013 mM (trimer) were observed us-
3.2. Separation of C1-oxidized cello-oligosaccharides
When analyzing the products of a strictly C1-oxidizing LPMO,
a typical sample contains a mixture of C1-oxidized cellooligosaccharides as well as small amounts of native oligomers.
Native cello-oligosaccharides have less retention to the PA-200
column than C1-oxidized cello-oligosaccharides, and the oxidized
dimer (GlcGlc1A) typically elutes with approximately the same retention time as native Glc5 [19]. For C1-oxidized compounds, we
achieved the best results using a concave gradient (Dionex gradient 8) from 1 to 100 mM KMSA over the course of 14 min,
followed by a 3 min washing step at 100 mM KMSA and a
4
H. Østby, J.-K. Jameson, T. Costa et al.
Journal of Chromatography A 1662 (2022) 462691
Fig. 1. Separation of native cello-oligosaccharides. Panel (A) shows the gradient (red) used to achieve adequate separation of native cello-oligosaccharides, as well as HPAEC
chromatograms of a standard mixture of native cello-oligosaccharides (DP1-6; black labels). The chromatograms show duplicate runs for three different concentrations of
standards, overlaid with a small y-offset. The concentration of the standard is shown in red on the left side of the chromatogram. The inset shows a zoom of DP6 at
0.0 0 05 g/L. Panel (B) shows the corresponding standard curves generated via integration of the peaks from the chromatograms in Panel (A); LOD and LOQ values calculated
for each compound as indicated in red. (For interpretation of the references to color in this figure legend, the reader is referred to the web version of this article.)
ing pseudo-blanks; see Methods and below). Furthermore, Fig. 3B
shows a high level of reproducibility between runs and the absence
of shifts in elution times.
Using this method, we then analyzed a mixture of products
generated by a strict C1-oxidizing LPMO (ScLPMO10C) and a strict
C4-oxidizing LPMO (NcLPMO9C) acting on PASC with ascorbic acid
as reductant. Fig. 3B shows that, even for this highly complex mixture of oligomers, all components could be separated and potentially quantified. It is worth noting that HPAEC analysis of product mixtures generated by some LPMOs classified as mixed C1-C4
oxidizing, such as the well-known TaLPMO9A, shows peaks for C4oxidized products that are higher than peaks for C1-oxidized products [32]. Considering the huge difference in response factors, it
would seem that enzymes yielding such a product pattern are almost exclusively C4-oxidizing.
3.4. A comparison of dual EGC (KMSA/KOH) and conventional
(NaOAc/NaOH) eluents
An ICS equipped with a PA-200 column and a PAD is an excellent choice of method for analyzing LPMO products ([16,19]; this
study). With the recent development of 1 mm PA-200 columns
(and even 0.4 mm, not used here) and dual EGC, a lower flow
can be used for analyte separation. This typically yields a better signal-to-noise (S/N) ratio and increased sensitivity, particularly when maintaining a relatively large sample loop of 4 μL.
Here, we compared our optimized protocol for the ICS-60 0 0, using the 1 mm column and dual EGC (KMSA/KOH), with our routine ICS-50 0 0 protocol with conventional (NaOAc/NaOH) eluents,
using 12 repeated injections of C1-oxidized standards of DP2-6. Of
note, one major difference between the systems concerns time use:
5
H. Østby, J.-K. Jameson, T. Costa et al.
Journal of Chromatography A 1662 (2022) 462691
Fig. 2. Separation of native and C1-oxidized oligosaccharides. Panel (A) shows the gradient (red) used to achieve adequate separation of native and C1-oxidized cellooligosaccharides. Immediately below the gradient, the panel shows chromatograms for a mixture of native cello-oligosaccharide standards (top; DP1-5; 0.005 g/L; black
labels) and a mixture of C1-oxidized cello-oligosaccharide standards of chain length (bottom; DP2-6; 0.01 mM; green labels). Panel (B) shows triplicate runs, using the
gradient shown in panel A, of three different concentrations of the C1-oxidized cello-oligosaccharide standards (DP2-6), overlaid with a small y-offset. The concentrations
of the analytes are shown in red on the left side of the chromatograms. Individual oxidized species are labeled in green in the topmost chromatogram. The peaks marked
with a blue star are a mix of native oligosaccharides (see also panel A), and a -30 Da series attributed to the conversion of a hexose to a pentose, which is an artefact that
commonly emerges during or after the reaction with CDH. Panel (C) shows standard curves generated via integration of the peaks from the chromatograms in Panel (B). The
panel shows the standard curve for each oxidized species. LOD and LOQ values calculated for each standard curve are indicated in red. (For interpretation of the references
to color in this figure legend, the reader is referred to the web version of this article.)
6
H. Østby, J.-K. Jameson, T. Costa et al.
Journal of Chromatography A 1662 (2022) 462691
Table 2
Determined limits of detection (LOD) and quantification (LOQ). LOD and LOQ were determined either via calibration curves
using linear regression, or by multiple injections of pseudo-blank samples; see the Materials and Methods section for details.
From std. curve
Pseudo-blank injections
ICS-60 0 0
ICS-60 0 0
LOD
LOQ
0.0002
0.0001
0.0002
0.0002
0.0001
0.0001
0.0005
0.0004
0.0006
0.0005
0.0004
0.0003
ICS-50 0 0
LOD
LOQ
LOD
LOQ
0.00009
0.00004
0.00017
0.00005
0.00004
0.00030
0.00013
0.00056
0.00017
0.00014
0.00036
0.00026
0.00019
0.00022
0.00030
0.00117
0.00084
0.00064
0.00073
0.00100
0.00072
0.00004
0.00239
0.00013
0.00291
0.00139
0.00962
0.00457
Native method (g/L)
Glc1
Glc2
Glc3
Glc4
Glc5
Glc6
Native and C1-oxidized method (mM)
GlcGlc1A
Glc2 Glc1A
Glc3 Glc1A
Glc4 Glc1A
Glc5 Glc1A
0.0003
0.0019
0.0024
0.0030
0.0032
0.0011
0.0056
0.0072
0.0090
0.0096
Native, C1- and C4-oxidized method (mM)
Glc4GemGlc
Glc4GemGlc2
0.0011
0.0001
0.0035
0.0002
d-gluconic acid method (g/L)
d-gluconic acid
0.0041
0.0125
the dual EGC is always-on, reducing the time needed for preparing eluents and columns from approximately two hours for the
ICS-50 0 0 to approximately ten minutes for the ICS-60 0 0. On the
other hand, the maximum KMSA concentration applied to the system is 100 mM, which will, despite the higher elution strength
of KMSA, lead to longer gradual gradients with KMSA compared
to NaOAc to achieve adequate separation of both native and C1oxidized oligosaccharides without peak overlaps. With NaOAc (ICS50 0 0), we achieved good separation within 13 min using a flow of
500 μL/min (Fig. 4B), while 20 min were needed when using KMSA
(ICS-60 0 0) and a flow of 63 μL/min (Fig. 4A). The low flow rate of
the ICS-60 0 0 produces a very stable detector baseline, while more
fluctuations are observed with the ICS-50 0 0 (Fig. 4C). This leads to
a considerable difference in signal-to-noise ratio between the systems (Fig. 4D), which affects the accuracy of quantification in the
low concentration region and renders the ICS-60 0 0 more sensitive
and reproducible. Technically, the reason behind the stable baseline
is several technical design improvements of dual EGC systems. I)
the concentration is directly generated without the need of a mixing chamber, II) the tubing volume between the pump and detector
is much larger relative to the flow rate (the flow passes through
two EGC modules and more tubing) causing a dampening-effect
on the baseline, and III) the low flow causes less frequent pump
pulses compared to a high flow. All these factors contribute to the
stable baseline. Additionally, we can observe an increase in signal
response on the ICS-60 0 0 compared to ICS-50 0 0 (Fig. 4A and 4B;
almost 2 × response on ICS-60 0 0). This is likely due to the relatively large sample loop size on the ICS-60 0 0 (4 μL injected on
a 1 mm column) compared to the ICS-50 0 0 (5 μL injected on a
3 mm column), and the effect of the PAD flow cell: (I) a smaller
gasket (1 mm on ICS-60 0 0 and 2 mm on ICS-50 0 0), and (II) lower
flow, both leading to a higher chance of molecules reaching the
electrode surface. Combining the stable baseline with the increase
in signal response ultimately leads to markedly higher signal-tonoise ratios obtained with the ICS-60 0 0 as seen in Fig. 4D.
In this experiment, LODs and LOQs were determined by measuring 12 consecutive pseudo-blanks (water spiked with a known,
minimal amount of compound) with quantification using a 3point standard curve (see Methods section). Using 0.0 0 05 g/L C1-
oxidized oligosaccharides (approx. 0.0 014–0.0 0 05 mM for DP2-6,
respectively), we obtained LODs of 0.0 0 0 04–0.0 0 017 mM for the
ICS-60 0 0 and 0.0 0 019–0.0 0 036 mM for the ICS-50 0 0. The LOQs
were 0.0 0 013–0.0 0 056 mM and 0.0 0 073–0.0 0117 mM for the ICS60 0 0 and the ICS-50 0 0, respectively (Fig. 4E). Of note, experiments
with the ICS-60 0 0 showed a markedly lower analytical CV than
experiments with the ICS-50 0 0, especially for very low concentrations (Fig. 4E), enabling accurate and reproducible quantification
of low-abundant compounds. All 12 replicates showed good reproducibility (relative standard deviation; RSD <0.14%) of retention
times for both systems. It is expected that day-to-day variations
involving different preparations of manual eluents might affect retention time stability compared to a system with electrolytically
generated eluents; however, we have not performed any longitudinal analyses to verify this.
For comparison, we also analyzed 12 reinjections of C4-oxidized
oligosaccharides on both systems (data not shown) in order to calculate LOD and LOQ for these compounds with the pseudo-blank
approach. This analysis (Table 2) corroborated the results obtained
with C1-oxidized oligomers, showing higher sensitivity and more
reproducible quantification of low-abundant compounds for the
ICS-60 0 0 system. The analytical CVs for the C4-oxidized dimer and
trimer were 6.1% and 3.1%, respectively, compared to 19.8% and
25.6% for the ICS-50 0 0. Table 2 summarizes the LOD and LOQ values determined in this study, using the calibration approach or the
pseudo-blank approach.
3.5. Detection of the C1-oxidized monosaccharide, D-gluconic acid
d-Gluconic acid is the C1-oxidized monosaccharide that can
emerge when a C1-oxidized cello-oligosaccharide, the product of a C1-oxidizing LPMO, is degraded further, e.g., by β glucosidases. These latter enzymes act from the non-reducing end
and have been shown to be able to convert C1-oxidized cellooligosaccharides to a mixture of glucose and gluconic acid [14]. Under standard conditions for analyzing oligosaccharides, d-gluconic
acid will have poor retention and elute too early, namely in the
injection peak, along with other monosaccharides in the reaction mixture (Fig. 5A). To create a method for specific detection
7
H. Østby, J.-K. Jameson, T. Costa et al.
Journal of Chromatography A 1662 (2022) 462691
Fig. 3. Separation of native, C1-oxidized and C4-oxidized oligosaccharides. Panel A shows the 45 min gradient (in red) that achieved the best separation of native,
C1-oxidized, and C4-oxidized cello-oligosaccharides. The chromatograms show standard samples containing the C4-oxidized dimer and trimer (top; blue labels; 0.08 mM
Glc4GemGlc, 0.009 mM Glc4GemGlc2 ), native oligomers (middle; black labels; 0.01 mM), and C1-oxidized oligomers (bottom; green labels; 0.01 mM). The inserts show standard curves over three levels and calculated LOD and LOQ values for C4-oxidized oligosaccharides. The sample containing C4-oxidized products was generated by incubating
Glc5 with NcLPMO9C, which leads to formation of Glc4GemGlc and Glc3 , and minor amounts of Glc4GemGlc2 and Glc2 . The amount of Glc4GemGlc was determined by quantification of Glc3 and the amount of Glc4GemGlc2 was determined by quantification of Glc2 . Panel B shows the chromatograms of three replicates of a mixture of products
from two LPMO reactions, one C1-oxidizing (ScLPMO10C) and one C4-oxidizing (NcLPMO9C), with PASC and ascorbic acid. Note that NcLPMO9C acts on soluble substrates,
which explains why longer C4-oxidized oligomers or native oligomers derived from on-column modification of such oligomers are not observed. (For interpretation of the
references to color in this figure legend, the reader is referred to the web version of this article.)
of d-gluconic acid, we used an ICS-60 0 0 setup consisting of a
150 × 2 mm PA-210-Fast-4 μm column connected to a 30 × 2 mm
guard column of the same material, operated at 200 μL/min. The
column was subjected to isocratic elution with 70 mM KOH for
16 min, followed by a 5 min washing step at 100 mM KOH,
and a 9 min re-conditioning at 70 mM KOH. In this setup, we
used a 0.4 μL sample loop instead of the 4 μL sample loop used
for oligosaccharides, which reduces sensitivity but eliminates the
need for (error-prone) dilution of samples with high concentrations. With this setup, we observed a linear response for concentrations between 0.01–0.05 g/L for gluconic acid (Fig. 5C), with LOD
of 0.004 g/L and LOQ of 0.013 g/L. While minor saturation effects
were visible between 0.05–0.1 g/L, quantification up to 0.1 g/L is
still possible using a polynomial calibration curve.
Occasionally, C6 oxidation, leading to the formation of glucuronic acid, has been observed in LPMO reactions [33]. We there-
fore also assessed separation of glucuronic acid and gluconic acid.
We found that for such product mixtures, a 16 min linear gradient
of 50–80 mM KOH can be applied, followed by a 5 min washing
step at 100 mM KOH, and a 9 min re-conditioning step at 50 mM
KOH (Fig. 5B, inset). The only other monomeric product potentially
present in an LPMO reaction would be glucose (depending on the
substrate used), which elutes at 2.8 min with this method, and
does not interfere with the separation of the sugar acids.
Current analysis of the action of C1-active LPMOs (number of
cuts) is based on quantification of the C1-oxidized cello-di- and
trisaccharides that emerge upon treating the mixture of soluble oxidized cello-oligosaccharides with a cellulase [34] (Fig. 5A). While
this procedure has shown reproducible results, analysis of the C1oxidized dimer and trimer may still be challenging in complex
sample mixtures due to co-eluting products, for example various
hemicellulose fragments. Alternatively, one could degrade the C1-
8
H. Østby, J.-K. Jameson, T. Costa et al.
Journal of Chromatography A 1662 (2022) 462691
Fig. 4. Comparison of chromatographic performance of the ICS-50 0 0 and ICS-60 0 0 methods. C1-oxidized standards (0.0 0 05 g/L) were analyzed 12 times on an ICS-60 0 0
(A; red) and on an ICS-50 0 0 (B; blue) using optimized methods for both systems. (C) The signal response of the detector measured within the first minute of the gradient,
i.e., prior to the injection peak. (D) Signal-to-noise ratio (S/N) for Glc1-5 Glc1A where detector noise is calculated from the curves in C. S/N = 2 × peak height / noise. (E)
Quantified amounts of the 12 reinjections for all components on both systems and calculated values for CV, LOD and LOQ (in g/L); for details, see methods. The black line at
0.0 0 05 g/L denotes the theoretical concentration. (For interpretation of the references to color in this figure legend, the reader is referred to the web version of this article.)
9
H. Østby, J.-K. Jameson, T. Costa et al.
Journal of Chromatography A 1662 (2022) 462691
Fig. 5. Detection of d-gluconic acid. Panel (A) shows three samples (1–3) analyzed using the gradient shown in Fig. 2A. 1: Products of a reaction of ScLPMO10C with PASC
and gallic acid as reductant. 2: Sample 1 treated with TfCel6A. 3: Sample 1 treated with β -glucosidase. Control reactions containing only β -glucosidase and buffer (not
shown) indicated that small residual peaks in the 18–22 min. region of the chromatogram for sample 3 are compounds in the β -glucosidase preparation, and not residual
oxidized products. Panel (B), chromatogram 1, shows sample 3 from panel (A) analyzed with an isocratic gradient at 70 mM KOH. Chromatogram 2 is a 0.025 g/L d-gluconic
acid standard. The inset shows an alternative gradient (red) developed to achieve separation of C1- and C6-oxidized glucose, d-gluconic (Glc1A, green label) and glucuronic
acid (GlcUA, black label), respectively; the sample contained 0.05 g/L of each compound. Panel (C) shows the d-gluconic acid standard in triplicates at four concentration
levels and the obtained standard curve (inset). LOD and LOQ values calculated for the standard curve are indicated in red. (For interpretation of the references to color in
this figure legend, the reader is referred to the web version of this article.)
oxidized oligomers with β -glucosidase, converting the oligomers
to glucose and d-gluconic acid (Fig. 5A; [14]), and then quantify
the latter using the PA-210 column set-up, as shown in Fig. 5B.
This method simplifies the analysis of products generated by C1oxidizing LPMOs, as only one product (d-gluconic acid) is measured instead of di- and trisaccharides. Furthermore, since the
product is a monosaccharide, it can be analyzed with a different
HPAEC setup (and column) and will not co-elute with other products potentially present in the LPMO reaction.
rides, such as, for example, xylan-, xyloglucan-, and glucomannanderived products. While no such compounds have been analyzed
as part of this study, we anticipate that the methods described in
this paper can provide a basis for further development of specialized gradients designed to separate other LPMO-generated oxidized
products, as has been done for older ICS systems [35]. Regardless,
it is clear that the new ICS-60 0 0 system with its low-diameter
columns and low flow offers unprecedented separation and sensitivity, combined with easy eluent preparation, gradient optimization, and minimal system drift.
4. Concluding remarks
Declaration of Competing Interest
Enzymatic assays used for characterizing LPMOs and related enzymes lead to complex product mixtures containing native, C1, and C4-oxidized oligosaccharides (as well as possibly also C6oxidized compounds). Depending on the reaction setup, product
mixtures may also contain monosaccharides, e.g., glucose and Dgluconic acid. The ability to efficiently and accurately separate and
quantify these compounds chromatographically is essential in furthering our understanding of these enzymes. Herein, we have presented new methods for HPAEC, based on dual electrolytic eluent
generation where NaOAc/NaOH is replaced by KMSA/KOH. These
new methods and the automatic generation of eluents overcome
drawbacks associated with manually prepared eluents, primarily
time and potential day-to-day variations, and offer simplified operation, increased precision, and higher sensitivity.
As our knowledge of LPMOs expands, so does our understanding of the range of substrates LPMOs can act upon. Novel substrate
specificities of LPMOs are continuously being discovered [35–40].
There is thus a need for optimized chromatographic methods able
to separate, and help identify, alternative oxidized oligosaccha-
The authors declare that they have no known competing financial interests or personal relationships that could have appeared to
influence the work reported in this paper.
CRediT authorship contribution statement
Heidi Østby: Methodology, Validation, Formal analysis, Investigation, Writing – original draft, Visualization. John-Kristian
Jameson: Methodology, Investigation, Writing – review & editing.
Thales Costa: Resources, Writing – review & editing. Vincent G.H.
Eijsink: Methodology, Writing – review & editing, Supervision, Funding acquisition. Magnus Ø. Arntzen: Conceptualization,
Methodology, Writing – review & editing, Visualization, Supervision, Funding acquisition.
Acknowledgments
The authors would like to thank Bo Emilsson at Nerliens
Meszansky, Norway, for valuable help during the initial setup and
10
H. Østby, J.-K. Jameson, T. Costa et al.
Journal of Chromatography A 1662 (2022) 462691
planning of these methods. This research was supported by the Research Council of Norway through grants 257622 & 268002 and by
the Novo Nordisk Foundation through grant NNF20OC0061313. Infrastructure was supported in part by NorBioLab grants 226247 and
270038 from the Research Council of Norway.
[22] T.R. Cataldi, C. Campa, G.E. De Benedetto, Carbohydrate analysis by highperformance anion-exchange chromatography with pulsed amperometric detection: the potential is still growing, Fresenius J. Anal. Chem. 368 (8) (20 0 0)
739–758, doi:10.10 07/s0 02160 0 0 0588.
[23] Y. Chen, V. Barreto, A. Woodruff, Z. Lu, Y. Liu, C. Pohl, Dual electrolytic eluent generation for oligosaccharides analysis using high-performance anionexchange chromatography, Anal. Chem. 90 (18) (2018) 10910–10916, doi:10.
1021/acs.analchem.8b02436.
[24] R.D. Rocklin, A.P. Clarke, M. Weitzhandler, Improved long-term reproducibility for pulsed amperometric detection of carbohydrates via a new quadruplepotential waveform, Anal. Chem. 70 (8) (1998) 1496–1501, doi:10.1021/
ac970906w.
[25] T. Wenzl, J. Haedrich, A. Schaechtele, P. Robouch, J. Stroka, Guidance document
for the estimation of LOD and LOQ for measurements in the field of contaminants in feed and food, Joint research centre (European Commission), Joint
Research Centre Technical Reports (2016), doi:10.2787/8931.
[26] T. Isaksen, B. Westereng, F.L. Aachmann, J.W. Agger, D. Kracher, R. Kittl,
R. Ludwig, D. Haltrich, V.G. Eijsink, S.J. Horn, A C4-oxidizing lytic polysaccharide monooxygenase cleaving both cellulose and cello-oligosaccharides, J. Biol.
Chem. 289 (5) (2014) 2632–2642, doi:10.1074/jbc.M113.530196.
[27] J.S. Loose, Z. Forsberg, M.W. Fraaije, V.G. Eijsink, G. Vaaje-Kolstad, A rapid
quantitative activity assay shows that the vibrio cholerae colonization factor
GbpA is an active lytic polysaccharide monooxygenase, FEBS Lett. 588 (18)
(2014) 3435–3440, doi:10.1016/j.febslet.2014.07.036.
[28] T.M. Wood, Preparation of crystalline, amorphous, and dyed cellulase
substrates, Methods Enzymol. (1988) 19–25 Academic Press, doi:10.1016/
0076- 6879(88)60103- 0.
[29] R.E. Calza, D.C. Irwin, D.B. Wilson, Purification and characterization of two
.beta.-1,4-endoglucanases from thermomonospora fusca, Biochemistry 24 (26)
(1985) 7797–7804, doi:10.1021/bi00347a044.
[30] M. Spezio, D.B. Wilson, P.A. Karplus, Crystal structure of the catalytic domain of
a thermophilic endocellulase, Biochemistry 32 (38) (1993) 9906–9916, doi:10.
1021/bi0 0 089a0 06.
[31] M. Zamocky, C. Schumann, C. Sygmund, J. O’Callaghan, A.D. Dobson, R. Ludwig,
D. Haltrich, C.K. Peterbauer, Cloning, sequence analysis and heterologous expression in pichia pastoris of a gene encoding a thermostable cellobiose dehydrogenase from myriococcum thermophilum, Protein Expr. Purif. 59 (2) (2008)
258–265, doi:10.1016/j.pep.20 08.02.0 07.
´ B. Bissaro, P. Chylenski, M. Skaugen, M. Sørlie, M.S. Jensen,
[32] D.M. Petrovic,
F.L. Aachmann, G. Courtade, A. Várnai, V.G.H. Eijsink, Methylation of the Nterminal histidine protects a lytic polysaccharide monooxygenase from autooxidative inactivation, Protein Sci. 27 (9) (2018) 1636–1650, doi:10.1002/pro.
3451.
[33] C. Chen, J. Chen, Z. Geng, M. Wang, N. Liu, D. Li, Regioselectivity of oxidation by
a polysaccharide monooxygenase from chaetomium thermophilum, Biotechnol.
Biofuels 11 (1) (2018) 155, doi:10.1186/s13068-018-1156-2.
[34] G. Courtade, Z. Forsberg, E.B. Heggset, V.G.H. Eijsink, F.L. Aachmann, The
carbohydrate-binding module and linker of a modular lytic polysaccharide
monooxygenase promote localized cellulose oxidation, J. Biol. Chem. 293 (34)
(2018) 13006–13015, doi:10.1074/jbc.RA118.004269.
[35] J.W. Agger, T. Isaksen, A. Várnai, S. Vidal-Melgosa, W.G.T. Willats, R. Ludwig,
S.J. Horn, V.G.H. Eijsink, B. Westereng, Discovery of LPMO activity on hemicelluloses shows the importance of oxidative processes in plant cell wall degradation, Proc. Natl. Acad. Sci. U. S. A. 111 (17) (2014) 6287–6292, doi:10.1073/
pnas.1323629111.
[36] V.V. Vu, W.T. Beeson, E.A. Span, E.R. Farquhar, M.A. Marletta, A family of starchactive polysaccharide monooxygenases, Proc. Natl. Acad. Sci. U. S. A. 111 (38)
(2014) 13822–13827, doi:10.1073/pnas.1408090111.
[37] M. Frommhagen, S. Sforza, A.H. Westphal, J. Visser, S.W. Hinz, M.J. Koetsier, W.J. van Berkel, H. Gruppen, M.A. Kabel, Discovery of the combined oxidative cleavage of plant xylan and cellulose by a new fungal
polysaccharide monooxygenase, Biotechnol. Biofuels 8 (2015) 101, doi:10.1186/
s13068- 015- 0284- 1.
[38] M. Couturier, S. Ladeveze, G. Sulzenbacher, L. Ciano, M. Fanuel, C. Moreau,
A. Villares, B. Cathala, F. Chaspoul, K.E. Frandsen, A. Labourel, I. HerpoelGimbert, S. Grisel, M. Haon, N. Lenfant, H. Rogniaux, D. Ropartz, G.J. Davies,
M.N. Rosso, P.H. Walton, B. Henrissat, J.G. Berrin, Lytic xylan oxidases from
wood-decay fungi unlock biomass degradation, Nat. Chem. Biol. 14 (3) (2018)
306–310, doi:10.1038/nchembio.2558.
´ C.X. Bach, D.T. Kim Anh, V.N. Thanh,
[39] S. Hüttner, A. Várnai, D.M. Petrovic,
V.G.H. Eijsink, J. Larsbrink, L. Olsson, Specific xylan activity revealed for AA9
lytic polysaccharide monooxygenases of the thermophilic fungus malbranchea
cinnamomea by functional characterization, Appl. Environ. Microbiol. 85 (23)
(2019) e01408–e01419, doi:10.1128/AEM.01408-19.
[40] F. Sabbadin, S. Urresti, B. Henrissat, O. Avrova Anna, R.J. Welsh Lydia, J. Lindley Peter, M. Csukai, N. Squires Julie, H. Walton Paul, J. Davies Gideon, C. Bruce
Neil, C. Whisson Stephen, J. McQueen-Mason Simon, Secreted pectin monooxygenases drive plant infection by pathogenic oomycetes, Science 373 (6556)
(2021) 774–779, doi:10.1126/science.abj1342.
References
[1] E.T. Reese, R.G. Siu, H.S. Levinson, The biological degradation of soluble cellulose derivatives and its relationship to the mechanism of cellulose hydrolysis,
J. Bacteriol. 59 (4) (1950) 485–497, doi:10.1128/JB.59.4.485-497.1950.
[2] G. Vaaje-Kolstad, B. Westereng, S.J. Horn, Z. Liu, H. Zhai, M. Sørlie, V.G. Eijsink, An oxidative enzyme boosting the enzymatic conversion of recalcitrant polysaccharides, Science 330 (6001) (2010) 219–222, doi:10.1126/science.
1192231.
[3] S.J. Horn, G. Vaaje-Kolstad, B. Westereng, V. Eijsink, Novel enzymes for the
degradation of cellulose, Biotechnol. Biofuels 5 (1) (2012) 45, doi:10.1186/
1754- 6834- 5- 45.
˚
[4] P. Chylenski, B. Bissaro, M. Sørlie, A.K.
Røhr, A. Várnai, S.J. Horn, V.G.H. Eijsink,
Lytic polysaccharide monooxygenases in enzymatic processing of lignocellulosic biomass, ACS Catal. 9 (6) (2019) 4970–4991, doi:10.1021/acscatal.9b00246.
[5] Z. Forsberg, G. Vaaje-Kolstad, B. Westereng, A.C. Bunæs, Y. Stenstrøm,
A. MacKenzie, M. Sørlie, S.J. Horn, V.G. Eijsink, Cleavage of cellulose by a
CBM33 protein, Protein Sci. 20 (9) (2011) 1479–1483, doi:10.1002/pro.689.
[6] C.M. Phillips, W.T. Beeson, J.H. Cate, M.A. Marletta, Cellobiose dehydrogenase
and a copper-dependent polysaccharide monooxygenase potentiate cellulose
degradation by neurospora crassa, ACS Chem. Biol. 6 (12) (2011) 1399–1406,
doi:10.1021/cb200351y.
[7] R.J. Quinlan, M.D. Sweeney, L. Lo Leggio, H. Otten, J.C.N. Poulsen, K.S. Johansen,
K.B.R.M. Krogh, C.I. Jørgensen, M. Tovborg, A. Anthonsen, T. Tryfona, C.P. Walter, P. Dupree, F. Xu, G.J. Davies, P.H. Walton, Insights into the oxidative degradation of cellulose by a copper metalloenzyme that exploits biomass components, Proc. Natl. Acad. Sci. U. S. A. 108 (37) (2011) 15079–15084, doi:10.1073/
pnas.1105776108.
[8] M. Dimarogona, E. Topakas, P. Christakopoulos, Recalcitrant polysaccharide
degradation by novel oxidative biocatalysts, Appl. Microbiol. Biotechnol. 97
(19) (2013) 8455–8465, doi:10.10 07/s0 0253- 013- 5197- y.
[9] K.S. Johansen, Lytic polysaccharide monooxygenases: the microbial power tool
for lignocellulose degradation, Trends Plant Sci. 21 (11) (2016) 926–936, doi:10.
1016/j.tplants.2016.07.012.
[10] M. Frommhagen, A.H. Westphal, W.J.H. van Berkel, M.A. Kabel, Distinct substrate specificities and electron-donating systems of fungal lytic polysaccharide monooxygenases, Front. Microbiol. 9 (2018) 1080, doi:10.3389/fmicb.2018.
01080.
[11] H. Østby, L.D. Hansen, S.J. Horn, V.G.H. Eijsink, A. Várnai, Enzymatic processing of lignocellulosic biomass: principles, recent advances and perspectives, J. Ind. Microbiol. Biotechnol. 47 (9) (2020) 623–657, doi:10.1007/
s10295- 020- 02301- 8.
[12] Katja S. Johansen, Discovery and industrial applications of lytic polysaccharide
mono-oxygenases, Biochem. Soc. Trans. 44 (1) (2016) 143–149, doi:10.1042/
BST20150204.
[13] B. Westereng, M.O. Arntzen, J.W. Agger, G. Vaaje-Kolstad, V.G.H. Eijsink, Analyzing activities of lytic polysaccharide monooxygenases by liquid chromatography and mass spectrometry, Methods Mol. Biol. 1588 (2017) 71–92, doi:10.
1007/978- 1- 4939- 6899- 2_7.
[14] D. Cannella, C.W. Hsieh, C. Felby, H. Jorgensen, Production and effect of aldonic
acids during enzymatic hydrolysis of lignocellulose at high dry matter content,
Biotechnol. Biofuels 5 (1) (2012) 26, doi:10.1186/1754- 6834- 5- 26.
[15] G. Müller, A. Várnai, K.S. Johansen, V.G. Eijsink, S.J. Horn, Harnessing the potential of LPMO-containing cellulase cocktails poses new demands on processing
conditions, Biotechnol. Biofuels 8 (2015) 187, doi:10.1186/s13068- 015- 0376- y.
[16] B. Westereng, M.O. Arntzen, F.L. Aachmann, A. Varnai, V.G. Eijsink, J.W. Agger,
Simultaneous analysis of C1 and C4 oxidized oligosaccharides, the products
of lytic polysaccharide monooxygenases acting on cellulose, J. Chromatogr. A
1445 (2016) 46–54, doi:10.1016/j.chroma.2016.03.064.
[17] M. Lammerhofer, HILIC and mixed-mode chromatography: the rising stars
in separation science, J. Sep. Sci. 33 (6-7) (2010) 679–680, doi:10.1002/jssc.
201090015.
[18] J.C. Linden, C.L. Lawhead, Liquid chromatography of saccharides, J. Chromatogr.
A 105 (1) (1975) 125–133, doi:10.1016/S0021-9673(01)81096-7.
[19] B. Westereng, J.W. Agger, S.J. Horn, G. Vaaje-Kolstad, F.L. Aachmann, Y.H. Stenstrøm, V.G. Eijsink, Efficient separation of oxidized cello-oligosaccharides generated by cellulose degrading lytic polysaccharide monooxygenases, J. Chromatogr. A 1271 (1) (2013) 144–152, doi:10.1016/j.chroma.2012.11.048.
[20] C. West, C. Elfakir, M. Lafosse, Porous graphitic carbon: a versatile stationary
phase for liquid chromatography, J. Chromatogr. A 1217 (19) (2010) 3201–3216,
doi:10.1016/j.chroma.2009.09.052.
[21] Y. Westphal, H.A. Schols, A.G. Voragen, H. Gruppen, Introducing porous graphitized carbon liquid chromatography with evaporative light scattering and mass
spectrometry detection into cell wall oligosaccharide analysis, J. Chromatogr. A
1217 (5) (2010) 689–695, doi:10.1016/j.chroma.20 09.12.0 05.
11