Influence of the geometry of extra column volumes on band broadening in a chromatographic system. Predictions by computational fluid dynamics
Bạn đang xem bản rút gọn của tài liệu. Xem và tải ngay bản đầy đủ của tài liệu tại đây (3.1 MB, 10 trang )
Journal of Chromatography A 1653 (2021) 462410
Contents lists available at ScienceDirect
Journal of Chromatography A
journal homepage: www.elsevier.com/locate/chroma
Influence of the geometry of extra column volumes on band
broadening in a chromatographic system. Predictions by
computational fluid dynamics
Bartłomiej Filip a, Roman Bochenek b, Krystian Baran b, Dominik Strzałka c, Dorota Antos b,∗
a
b
c
Doctoral School of Engineering and Technical Sciences, Rzeszów University of Technology, Rzeszow, Poland
Department of Chemical and Process Engineering, Rzeszów University of Technology, Rzeszów, Poland
Department of Complex Systems, Rzeszów University of Technology, Rzeszów, Poland
a r t i c l e
i n f o
Article history:
Received 29 April 2021
Revised 8 July 2021
Accepted 9 July 2021
Available online 14 July 2021
Keywords:
Computational fluid dynamics
Extra-column volume effect
Protein chromatography
a b s t r a c t
A computational fluid dynamics method was used for prediction of flow behavior and band profiles of
small- and macro-molecule compounds eluting in extra-column volumes (ECV) of an Äkta chromatographic system. The model compounds were: acetone, bovine serum albumin and an antibody. The
construction of ECV was approximated by different types of geometries, starting from the simplest
two-dimensional (2D) arrangement consisting of a straight capillary tube, and ending with a threedimensional system (3D), which accounted for the flow path curvature of individual elements of ECV,
including: injection loop capillary, multi-way valve, connecting capillary and detector cell. The accuracy
of the model predictions depended on the flow path length and the eluent flowrate. 2D-geometry models reproduced pretty well the shapes of band profiles recorded at the lowest eluent flowrate used, but
they failed for increased flowrates. The 3D-geometry model was found to be sufficiently accurate for all
conditions investigated. It was exploited to analyze band broadening in the individual ECV elements. The
simulation results revealed that the flow behavior in the injection loop capillaries strongly influenced the
shape of band profiles, particularly at higher eluent velocities. This was attributed to the formation of
Dean vertices triggered by centrifugal forces in curved parts of the eluent flow path.
© 2021 The Authors. Published by Elsevier B.V.
This is an open access article under the CC BY license ( />
1. Introduction
Chromatographic columns of very small volumes are often used
in the development stage of protein chromatography. They are frequently implemented in high throughput robotic stations, where
pipetting robots are used for loading extremely small samples of
proteins, which are bound and then eluted under different conditions [1–3]. Such a technique allows acquiring a high number of
elution data that can be used to determine the process operating
window and optimize operating variables for large scale chromatographic purifications [4–7].
However, reduction in the column size results in enhancement
of the so called extra-column volume (ECV) effect that is induced
by dispersion in different parts of chromatographic system outside
the column. The ECV effect influences the shape of peaks eluted
from the column and their retention, therefore it can be a cause
of misinterpretation of adsorption data and failure in scaling up
∗
Corresponding author.
E-mail address: (D. Antos).
the separation process. The ECV effect has been thoroughly analyzed for small-molecule compounds eluted from HPLC or UHPLC
systems [8–13]. It was found that for highly efficient columns, dispersion in ECV can be a dominating factor contributing to band
broadening, and thus determining the separation efficiency.
The performance of chromatographic columns destined for bulk
protein purification is significantly lower compared to HPLC systems for separation of small-molecule compounds. This stems from
low diffusivity of macromolecules and slow rates of mass transport accompanying adsorption. On the other hand, diffusivity limitations induce distortion of concentration profile, since the elution period in ECV is too short for macromolecules to ensure attainment of uniformity of radial velocity distribution in connecting capillaries. This causes that the ECV effect is much more pronounced for proteins than for small molecules, thus it can significantly contribute to band broadening or even overwhelm all oncolumn mass transfer effects [14–16].
Various approaches have been used for quantifying the ECV effect based on: (a) theoretical analysis, in which additive contributions of individual parts of the ECV system to band broaden-
/>0021-9673/© 2021 The Authors. Published by Elsevier B.V. This is an open access article under the CC BY license ( />
B. Filip, R. Bochenek, K. Baran et al.
Journal of Chromatography A 1653 (2021) 462410
ing were assessed, or (b) on experimental elution profiles using:
zero dead volume connectors or zero-length columns, extrapolation from columns of different lengths or different retention times
of solutes [17–20]. The band broadening is typically quantified in
the form of peak variances in individual parts of the system, which
are assumed to contribute additively to the total-system peak variance [17–23]. In another approach, a dynamic model is used to
calculate band profiles along with the velocity distribution in laminar flow in ECV capillaries [24–30]. Such an approach was also
used in a previous study, where the geometry of the ECV system
was simplified to a straight tube with laminar velocity distribution
[15]. The band shape predicted by the dynamic model reproduced
the eluting peaks of macromolecules for low flowrates corresponding to low linear velocities in connecting capillaries. However, for
higher flowrates, the model overpredicted the band deformation
and the experimental band profiles were more symmetrical compared with the model predictions. This is against to the trend anticipated for laminar flow regimes, as increase in flowrate causes
the residence time of eluting species to reduce, which in turn enhances the ECV effect due to diffusivity limitations.
Therefore, in this study we employed computational fluid dynamics (CFD) method to account for the influence of ECV geometry on flow behavior and peak shape and to elucidate that unusual
retention pattern.
So far, some attempts have been made to utilize CFD to predict dispersion in chromatographic systems, however they were focused on description of flow behavior inside the column, i.e., in
packed beds [20,31–36] or in column flow distributors of different
structures [37–41]. The flow behavior in the injection system HPLC
was studied by Deridder et al., who simulated velocity distribution
in flow-through needle and fixed loop sample injectors [40]. In the
latter case, the geometry of injection system was simplified to a
straight tube in a two-dimensional (2D) coordinate system.
In this study, CFD was utilized to simulate 2D and 3D flow patterns in ECV of an Äkta chromatographic system, including the injection system, connecting capillaries and detector cell. The simulations were performed for small- and macro-molecules injected
through different injection systems (loop capillaries, superloop)
and eluted at different velocities, and compared with the experimental data. Flow behavior of macromolecules (bovine serum albumin and an antibody) markedly departed from that observed
for a small-molecule compound (acetone), which was attributed to
the differences in molecular diffusivity of those species. The CFD
model in which 3D geometry was implemented, reproduced the
most correctly the band profiles under different injection conditions. The model predictions were used to identify the ECV elements that most influenced velocity distribution and shapes of
band profiles.
and with the species mass balance equation:
∂
(ρYi ) + ∇ · (ρ wYi ) = −∇ · Ji
∂t
where Yi is the mass fraction of ith component, J is the diffusion
flux:
Ji = −ρ Dim ∇ Yi
Dim η
9.2 10−8
=
T
M0.333
3. Materials and methods
3.1. Materials and process conditions
Three model compounds were used for the elution experiments,
i.e., two proteins: bovine serum albumin, BSA (MW = 66.5 kDa pu´
rity ≥ 96%) purchased from Sigma–Aldrich (Sigma–Aldrich, Poznan,
Poland), an antibody, mAb2 (MW = 148 kDa purity ≥ 96%) pro´
vided by Polpharma Biologics (Gdansk,
Poland), as representatives
of large macromolecules, and acetone (MW = 58.8 Da) as a representative of small-molecule compounds. All experiments were
performed at room temperature (av. 22 °C). As eluent phosphate
buffer was used with pH = 7, the eluent flowrate was changed
from 0.1 to 1.0 mL min−1 .
3.2. Chromatographic system
An Äkta purifier with a UV detector and a data station (GE
Healthcare Life Sciences, Uppsala, Sweden) was used for chromatographic experiments. The ECV system consisted of the injection
valve, equipped with loop capillaries with different dimensions or
a superloop. The injection system was connected with a UV detector cell by a capillary tubes with different lengths.
3.3. Geometry and meshing of the chromatographic system
The individual elements of the ECV system were approximated
using different types of geometries with different degree of complexity. As a consequence, four variants of the ECV geometry were
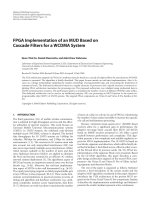
considered (Fig. 1, Table 1):
•
(1)
where w is the fluid velocity, ρ is the fluid desity, p is preassure,
g is acceleration of gravity, τ is the stress tensor given by the following equation:
2
3
•
(2)
where μ is the fluid viscosity, I is the unit tensor.
Eq. (1) is coupled with the mass continuity equation:
∂ρ
+ ∇ · (ρ w ) = 0
∂t
(6)
where Dim is in cm2 s−1 , viscosity η of the protein solution in Pa
s, temperature T in K, molecular weight M in Da.
The CFD model consisted of momentum balance equation:
τ = μ ∇v + ∇ vT − ∇ · vI
(5)
where Dim is the molecular diffusion coeffcient.
The set of Eqs. (1)–(5) was solved for binary incompressible system that consisted of the solvent (eluent) and the species to be
eluted. Since the species concentration was low, their diffusion coefficients as well as the eluent density and viscosity were set independent of the composition.
The diffusion coefficient of macromolecules was calculated according to the correlation suggested by Tyn and Gusek [42]:
2. Theory
∂
(ρ w ) + ∇ · (ρ ww ) = −∇ p + ∇ · (τ ) + ρ g
∂t
(4)
•
(3)
2
System 1: a straight tube positioned horizontally with the diameter averaged over the lengths of all capillaries that were
included in ECV, i.e., in the multi-way valve, injection loops
(loop capillaries or the superloop), connection capillaries and
the channel in the detector cell (2D geometry: cavg ).
System 2: straight tubes positioned horizontally, but with different diameters corresponding to the individual ECV elements,
including: capillaries in the injection system (s1 ) and in the
multi-way valve (v), and the connection capillary with different lengths (c1 or c2 ), but the flow behavior in the detector cell
was not directly accounted for (2D geometry: s1 vc1,2 s).
System 3: geometry as in the system 2, but the flow behavior
in the detector cell (positioned vertically to the flow direction
in the connection capillary) was accounted for (3D geometry:
s1 vc1,2 d).
B. Filip, R. Bochenek, K. Baran et al.
Journal of Chromatography A 1653 (2021) 462410
Table 1
Geometry and meshing of the ECV system (see Fig. 1).
Dimensions of individual elements
0.01 mL (ID 0.25 mm, length L = 203.7 mm)
1 mL (ID 0.75 mm, L = 2264 mm)
0.01 mL (ID 0.25 mm, a tube with 2 arcs (180°) and 3 straight distances,
total length as for s1 )
1 mL (ID 0.75 mm, 16 coils radius 22 mm, total length as for s1 )
0.007 mL (ID 0.8 mm, L 13.93 mm)
Shorter c1 : 0.0196 mL (ID 0.5 mm, L = 100 mm)
Longer c2 : 0.250 mL (ID 0.5 mm, L = 1273 mm)
0.013 mL (ID 1 mm, L = 16.55 mm)
2: s1 vc1,2 , 2D
3: s1 vc1,2 d, 3D
4: s2 vc1,2 d, 3D
Straight tube (s1, s3 )
Loop capillary (s2 )
Capillary in the multi-way valve (v)
Connection capillary (c)
Numerical systems and dimensions
detector cell (d)
1: cavg , 2D
Elements of the mesh
Meshing methods
hex and tetrahedral mesh
straight tube: MultiZone method, edge sizing, bias factor
loop capillary: Sweep and MultiZone
methods, edge sizing, bias factor
The ANSYS software was also used for drawing and mashing the
system geometry, which determined the spatial discretization. The
numerical error was controlled by proper choice of the number of
elements in the radial and axial directions, i.e., the mesh was chosen in such a way that the shape of the outlet concentration profiles was independent of its size and mass balance was conserved
with the error less than 1% in relation to the mass introduced into
the system. The resulting mesh size varied within the range 0.01–
0.1 mm in the axial direction and 0.05–0.005 mm in the radial direction, depending on the flow path curvature. The smallest radial
mesh was used at the vicinity of the capillary wall and connection
points of capillaries of different diameters. The time increment was
selected based on the value of the Courant number, which was
maintained at the level less than 1. Typical time increment was
about 0.001 s.
The calculations were performed for non-stationary laminar
flow in transport model, which accounts for multicomponent
systems (software options: transient, laminar, species). Standard
boundary conditions for the fluid phase (fluid) were assumed: inlet, outlet, and wall; at the inlet laminar flow velocity distribution
was assumed, at the outlet no backflow conditions and at the wall
no-slip conditions were used, the outlet gauge pressure was set 0.
The diffusion coefficient of acetone was taken from the GSC
chemical database; Dm = 1.1 × 10⁻⁹ m s−2 , the diffusion coefficients of the proteins were obtained from Eq. (6), as follows: for
BSA Dm = 6.7 × 10⁻¹¹ m s−2 and for mAb2 Dm = 5.1 × 10⁻¹¹ m
s−2 .
4. Results and discussion
4.1. Impact of the residence time and diffusivity on band shape
The band profiles of acetone, BSA and mAb2 eluting from ECV
were recorded for different eluent flowrates varied from 0.1 to
1 mL min−1 using the connecting capillaries of different lengths, L
(for c1 : L = 100 mm and for c2 : L = 1273 mm; Fig. 1, Table 1). This
corresponded to different residence times of the eluting species in
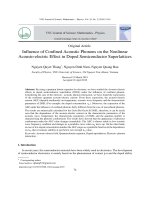
ECV. The experimental band profiles depicted in Fig. 2A and in
Fig. 2B illustrate typical trends in the retention behavior. As expected, increase in the eluent flowrate (reduction in the residence
time) caused the band profiles to deviate from the Gaussian shape
(Fig. 2A). As mentioned above, the band deformation is characteristic for laminar flow regimes, when the residence time is not sufficient for the eluting species to reach uniformity of radial velocity distribution. Radial velocity gradient causes the solute to move
faster in vicinity of the capillary center and slower at the column
wall [24–30]. The phenomenon enhances with increasing molecular weight of the solute, as its movement in the radial direction is
hindered by low diffusivity. This is illustrated in Fig. 2B, where the
band profiles recorded for acetone, BSA and mAb2 are superimposed. Though the retention behavior seemed to follow a pattern
Fig. 1. Illustration of the geometry systems 1, 2, 3, 4; s1 denotes the straight capillary tube for the sample injection (in the systems 1, 2, 3), s2 is the injection loop
capillary (in the system 4a-short loop capillary, 4b – large loop capillary), c1 , c2 are
the short and long connection capillary tubes, respectively, d is the detector cell.
•
System 4: geometry as in the system 3, but with accounting
for the curvatures of the loop capillaries in the injection system
(3D geometry: s2 vc1,2 d).
3.4. Numerical method
The velocity and concentration profiles were calculated using
a commercial fluid simulation software ANSYS Fluent v. 2019 R3.
3
B. Filip, R. Bochenek, K. Baran et al.
Journal of Chromatography A 1653 (2021) 462410
Fig. 2. Illustration of the influence of flowrate (A) and the molecular weight (B) on the band shape in ECV. Symbols - experimental data, lines - the model simulation
performed for the system 4 (s2 vc1,2 d), short flow path (c1 with L = 100 mm), long flow path (c2 with L = 1273 mm).
specific for laminar flow, a departure of band profiles from the expected shapes was detected. This issue could not elucidated in the
previous study, where a simple 2D-geometry model was used [15].
Therefore, in this study CFD was employed, which provided a better understanding of the observed trends.
accuracy of the predictions was achieved for the system 3 (s1 vc1 d)
that included the flow behavior in the detector cell. The predictions for the system 4 (s2 vc1 d) that accounted for the 3D geometry
of the injection loop capillary provided the best accuracy. However,
the difference between the band shapes predicted for the systems
3 and 4 was minor, which indicated that in that case the changes
in the diameters of ECV elements contributed most to band broadening, whereas the influence of the flow behavior in the injection
loop capillary was of minor importance.
As discussed above, increase in the eluent flowrate impaired
peak symmetry and caused band deformation, though the effect
was much weaker than expected for the regime of laminar flow
in straight capillaries, which was indicated by the courses of the
simulations performed for the system 1 (Fig. 3B).
In case of the long flow path (Fig. 3C and D), the discrepancies
between the model predictions obtained for different geometries
were much more distinct compared with those shown for the short
flow path. It is particularly visible for the high flowrate (Fig. 3D),
for which the accuracy of the predictions was acceptable only for
the system 4. This means that in that case, the flow behavior in the
injection loop capillary most significantly affected the band shapes.
The observed changes in band shapes reflected the values of
peak variances, which is illustrated in Fig. 4A and 4B. The errors
in the predictions of peak variances is the largest for the system
1 and the smallest for the system 4, which is particularly evident
for the long flow path. This reveals that changes in the residence
time due to increase in the flow velocity or in the length of the
flow path do not have the same impact on the shape of band profiles, and the contribution of flow behavior in different ECV elements to band broadening depends on the arrangement of the ECV
system.
Similar effects were observed for BSA, whose band profiles were
deformed also for the low flowrate (Fig. 5). It stems from low diffusivity of the protein, as discussed above. The discrepancy between
the shapes of the experimental profiles of BSA and the model predictions performed for different geometries are distinct for the
higher flowrate (Fig. 5B and D). In this case, increase in flowrate
did not deteriorate the symmetry of the BSA peak, but even improved it to some extent. The errors of the model predictions for
the systems 1, 2 and 3 were again particularly significant for the
long flow path (Fig. 5D). In that case, an acceptable accuracy was
achieved only for the system 4. The values of peak variances calculated for the experimental and predicted profiles, which are presented in Fig. 6A and B, confirm the observed differences in band
shapes. The shapes of band profiles recorded for mAb2 followed
the same trend with a slight enhancement of the phenomena reported for BSA (data not shown).
4.2. CFD calculations
4.2.1. System geometries
The band profiles were simulated using the ANSYS Fluent software according to the procedure described in Section 3.4. As mentioned above, the construction of the ECV system was approximated by four different types of geometries (Fig. 1): the simplest
system 1 (cavg ), in which ECV was represented by a straight horizontal capillary with the diameter averaged over all ECV tubes, system 2 (s1 vc1,2 d), where difference in the diameters was accounted
for, system 3 (s1 vc1,2 d) in which the flow behavior in the detector
cell was additionally accounted for, and the most complex system
4, in which the curvature of the injection loop capillaries was included (s2 vc1,2 d). That approach allowed identification of ECV elements making a major contribution to band broadening and selection of geometry which provided the most correct reproduction
of band profiles in ECV. The simulations were performed for all
model species eluted at different flowrates from the ECV system
equipped with different injection loops and connection capillaries
of different lengths (Table 1). This corresponded to different residence times of species in ECV and different injection volumes. The
latter was aimed at simulating different loading conditions. Three
types of the injection loops were considered in the experiments
and the model calculations: a 0.010 mL loop capillary that was
used to mimic small-volume injections, and a 1 mL loop capillary
or a superloop to mimic large-volume injections.
4.2.2. Accuracy of the model predictions for different ECV geometries
4.2.2.1. Small-volume injections. A comparison between the experimental data and the calculated band profiles for all types of ECV
geometry at minimum and maximum flowrates used, i.e., 0.1. and
1 mL min−1 , for the short and long connection capillaries (short
and long flow path) is presented in Fig. 3. It can be seen that for
the short flow path (Fig. 3A and B), the prediction obtained for the
system 1 with a straight capillary of constant diameter (cavg ) was
not accurate; it overestimated the peak symmetry. For the system
2 (s1 vc1 ), in which the difference in the diameters of the injection
loop capillary, the capillary in the injection multi-way valve and
the connection capillary was accounted for, the accuracy of the
predictions of band shape was improved, though the simulations
still overestimated the peak symmetry. Further improvement in the
4
B. Filip, R. Bochenek, K. Baran et al.
Journal of Chromatography A 1653 (2021) 462410
Fig. 3. Comparison of the band profiles of acetone recorded experimentally and simulated for different ECV geometries. Q is the eluent flow rate, cavg is the capillary with
the average diameter, c1 - short flow path, c2 - long flow path.
Fig. 4. Peak variances calculated for the experimental band profiles of acetone (Exp.) and predicted by the model for different ECV geometries for two flow rates 0.1 and 1.0
mL min−1 . (A) Short flow path (c1 ), (B) long flow paths (c2 ).
As reported above, the contribution of flow behavior in different ECV elements to band broadening can be different. This implies
that in the presence of chromatographic column, the band broadening in pre- and post-column ECV may be not the same. To illustrate that effect, the intermediate profiles of acetone and BSA were
simulated for the geometry system 4 at two localizations, which
were selected to mimic the presence of pre- and post-column volumes, i.e., in the midpoint of the short connection capillary and
at the end of the ECV system. The first part (“pre-column” volume) included the injection system and half the length of the short
connection capillary, the second one consisted of the remaining
half of the capillary and the detector cell (“post-column” volume).
The simulated bands along with the peak variances are shown in
Fig.7A–D. It can be observed that the ratio between the variances
of the pre- and post-column peaks depends on the solute molecular weight and the eluent flowrate. For both acetone and BSA, the
contribution of the pre-column volume (s2 vc1,(0.5) ) to the total peak
variance (s2 vc1 d) increased with increasing flowrate, however that
effect was much stronger for BSA. A detailed study on the combination of the effects of flow behavior in ECV and in a small column
is a subject of a forthcoming study.
4.2.2.2. Large injections. The CFD model was used to predict band
profiles for large-volume injections performed by use of the loop
capillary and the superloop. The results of the model simulations
along with the corresponding experimental band profiles are pre5
B. Filip, R. Bochenek, K. Baran et al.
Journal of Chromatography A 1653 (2021) 462410
Fig. 5. Comparison of the band profiles of BSA recorded experimentally and predicted for different ECV geometries at different flowrates Q and flow path lengths.
Fig. 6. Peak variances calculated for the experimental band profiles of BSA and predicted by the model for different ECV geometries at different flowrates Q and flow path
lengths.
sented in Figs. 8 and 9. The flow behavior in the loop capillary
exerted dominating influence on the shape of the band profiles
(Fig. 8). It can be attributed to a long distance that the sample
had to cover to elute from the long loop. Therefore, only the predictions for the 3D geometry (system 4) that accounted for flow
behavior in the capillary coils, reproduced well the shape of the
experimental band profiles. The simulations for the remaining geometries: systems 1, 2 and 3, overpredicted peak tailing. The contribution of flow behavior in the detector cell to the band broadening was negligible. This is illustrated by the results of simulations
for two arrangements in which the presence of the detector cell
was included or skipped: s2 vc1 and s2 vc1 d .
The band shapes of the species injected through the superloop
were much more symmetrical compared with those obtained for
the injection loop capillary (Fig. 9). In this case the geometry of
ECV was simple; the sample injection was simulated using proper
boundary condition at the inlet of the capillary in the injection
valve. The band shape was determined by the flow behavior in the
straight connection capillary tube; therefore, the model with the
system 1 provided sufficiently accurate predictions.
4.2.3. Concentration contours. To elucidate the influence of the system geometry on band profiles, the contours of the internal concentration profiles in two different elements of ECV were generated. Figs 10A and 10B show the time evolution of the BSA profiles
in the vicinity of connection points, in which capillaries of different
diameters were coupled (e.g., the injection loop capillary with the
multi-way capillary and the multi-way capillary with the connection capillary). The contour colours illustrate the protein concentrations in the mobile phase; from the red colour assigned to the
most concentrated solute, through yellow, light blue, to dark blue
corresponding to pure mobile phase. It can be observed that for
the low flow rate, the protein eventually reached the wall of the
larger diameter capillary at the end of the residence time, but only
in the vicinity of the inlet connection point, as the velocity profile was not uniformly distributed along the capillary. The amount
6
B. Filip, R. Bochenek, K. Baran et al.
Journal of Chromatography A 1653 (2021) 462410
Fig. 7. Comparison of band profiles simulated at the midpoint of the connection capillary (s2 vc1,(0.5) ) and at the end of ECV (s2 vc1 d).
Fig. 8. Comparison of band profiles of BSA in large-volume injections from the loop capillary recorded experimentally and simulated for different ECV geometries at different
flowrates Q for the short flow path.
Fig. 9. Comparison of band profiles of acetone and BSA in the superloop injections recorded experimentally and simulated for different ECV geometries (only systems 1 and
4) at different flow rates Q for the long flow path.
7
B. Filip, R. Bochenek, K. Baran et al.
Journal of Chromatography A 1653 (2021) 462410
Fig. 10. Time evolution of the concentration profiles of BSA; the influence of change in the capillary diameter. The contours of concentration profiles at: (A) the low, and (B)
high flowrates. Snapshots at different time intervals.
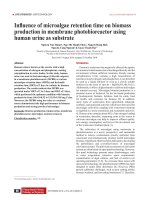
Fig. 11. Time evolution of the concentration profiles of BSA in an arc of the injection loop capillary. The contours of concentration profiles in a fragment of coil arc (left-hand
side) and in its cross-section (right-hand side) at: (A) low flowrate, (B) high flowrate. Snapshots at different time intervals.
Where ρ , η are the fluid density and viscosity, respectively, w is
the linear velocity, d is the diameter of the tube, Rc is the radius
of the coil.
It has been shown that the influence of the centrifugal forces
on the flow behavior in the coil is negligible when the product of
the Dean number squared and the Schmidt number is smaller than
100 [43,44]:
that reached the wall lagged behind the main stream, which was
the cause of enhanced tailing of BSA band profiles. For the high
flowrate, the most amount of the protein did not reach the wall
of the larger diameter capillary and travelled closer to its centre.
Therefore, the residua of the protein did not adhere to the capillary wall.
The most complex pattern of the concentration contours was
predicted for the elution through the injection loop capillary,
where the flow trajectory was most curved. At the low flowrate,
the protein was almost symmetrically distributed along the crosssection area of the loop (Fig. 11A), while at the high one the contour was strongly asymmetrical and split into two parts (Fig. 11B).
The residua of the protein adhered to the internal part of the loop
coil were eluted at the latest, at the end of the residence time. The
complexity of contour shapes aroused from both shear stress at
the capillary wall and flow turbulence in the coil, which occurred
due to centrifugal forces known as the Dean vortices. To quantify
that phenomena, the Dean number can be used, which is defined
as a product of the Reynolds number and the square root of the
curvature ratio:
Dn =
ρ wd
η
d
= Re
2R
d
2Rc
Dn2 Sc < 100 Sc =
η
ρ Dm
(8)
For the flowrate of 0.1 mL min−1 , the product Dn2 Sc was
the lowest for acetone: Dn2 Sc = 1300 for the small loop capillary (Dn = 1.8, Rc = 15 mm, d =0.25 mm), and Dn2 Sc = 295 for
the large loop capillary (Dn = 0.88 Rc = 22 mm, d = 0.75 mm).
For the flowrate of 1 mL min−1 the Dn numbers were 10 times
higher and the Dn2 Sc products 100 times higher, e.g., for acetone: Dn = 18, Dn2 Sc = 130 0 0 0 for the small loop capillary, and
Dn = 8.8, Dn2 Sc = 29500 for the large loop capillary.
This indicates that in all investigated cases the centrifugal
forces in the loop capillaries can be expected to contribute to the
flow behavior. However, the model simulations did not reveal significant deviation from the radial symmetry of the velocity profiles in the small loop capillary for Dn2 Sc less than about 20 0 0,
which corresponded to flowrates less than about 0.15 mL min−1 . A
(7)
8
B. Filip, R. Bochenek, K. Baran et al.
Journal of Chromatography A 1653 (2021) 462410
distinct presence of Dean vortices was observed for the flowrates
higher than 0.2 mL min−1 .
The flow turbulence in the loop capillaries, at the connection
points of capillaries and in the detector cell partly suppressed the
effect of low diffusivity of the protein and caused its band profiles to be more symmetrical than predicted for a straight capillary
tube in the laminar flow regime. This can explain the improvement in the peak asymmetry at the high flowrate demonstrated
in Section 4.2.2.1.
This also implies that higher flowrates are preferable for the
protein injections. However, increase in flowrate during the protein
elution along the column may impair the efficiency of the separation according to the course of the van Deemter curve. As a remedy, a stepwise change in the flowrate may be used, i.e., an increased flowrate for the injection period to suppress the diffusion
effects, and a reduced flowrate for the column elution to mitigate
the mass transfer effects in packed bed. However, that approach
is limited to relatively small injection volumes, for which the concentration front of the solute insignificantly penetrates the column
during the injection period.
Declaration of Competing Interest
The authors declare that they have no known competing financial interests or personal relationships that could have appeared to
influence the work reported in this paper.
CRediT authorship contribution statement
Bartłomiej Filip: Investigation, Methodology, Conceptualization,
Writing – review & editing. Roman Bochenek: Conceptualization, Methodology. Krystian Baran: Investigation, Methodology.
Dominik Strzałka: Methodology. Dorota Antos: Conceptualization,
Writing – review & editing.
Acknowledgment
We thank Maciej Ginalski from the SYMKOM company for assistance with developing our CFD procedure.
References
[1] T. Schroeder, Automated parallel chromatography in downstream process development, Bioprocess Int. 8 (2010) 92–93.
[2] A. Susanto, E. Knieps-Grünhagen, E. von Lieres, R. Bhambure, K. Kumar,
A.S. Rathore, High-throughput process development for biopharmaceutical
drug substances, Trends Biotechnol. 29 (2011) 127–135.
[3] S. Chhatre, N.J. Titchener-Hooker, Review: Microscale methods for high-throughput chromatography development in the pharmaceutical industry, J.
Chem. Technol. Biotechnol. 84 (2009) 927–940.
[4] A. Susanto, E. Knieps-Grünhagen, E. von Lieres, J. Hubbuch, High throughput
screening for the design and optimization of chromatographic processes: assessment of model parameter determination from high throughput compatible
data, Chem. Eng. Technol. 31 (2008) 1846–1855.
[5] W.R. Keller, S.T. Evans, G. Ferreira, D. Robbins, S.M. Cramer, Understanding operational system differences for transfer of miniaturized chromatography column data using simulations, J. Chromatogr. A 1515 (2017) 154–163.
[6] A. Osberghaus, S. Hepbildikler, S. Nath, M. Haindl, E. von Lieres, J. Hubbuch,
Optimizing a chromatographic three component separation: a comparison of
mechanistic and empiric modeling approaches, J. Chromatogr. A 1237 (2012)
86–95.
[7] R. Khalaf, J. Heymann, X. LeSaout, F. Monard, M. Costioli, M. Morbidelli, Model-based high-throughput design of ion exchange protein chromatography, J.
Chromatogr. A 1459 (2016) 67–77.
[8] K. Vanderlinden, K. Broeckhoven, Y. Vanderheyden, G. Desmet, Effect of
pre-and post-column band broadening on the performance of high-speed
chromatography columns under isocratic and gradient conditions, J. Chromatogr. A 1442 (2016) 73–82.
[9] D.V. McCalley, Instrumental considerations for the effective operation of short,
highly efficient fused-core columns. investigation of performance at high flow
rates and elevated temperatures, J. Chromatogr. A 1217 (2010) 4561–4567.
[10] K.J. Fountain, U.D. Neue, E.S. Grumbach, D.M. Diehl, Effects of extra column
band spreading, liquid chromatography system operating pressure, and column
temperature on the performance of sub-2-μm porous particles, J. Chromatogr.
A 1216 (2009) 5979–5988.
[11] F. Gritti, G. Guiochon, On the minimization of the band-broadening contributions of a modern, very high pressure liquid chromatograph, J. Chromatogr. A
1218 (2011) 4632–4648.
[12] S.Z. Fekete, J. Fekete, The impact of extra-column band broadening on the
chromatographic efficiency of 5 cm long narrow-bore very efficient columns, J.
Chromatogr. A 1218 (2011) 5286–5291.
[13] N. Wu, A.C. Bradley, Ch.J. Welch, L. Zhang, Effect of extra-column volume on
practical chromatographic parameters of sub-2-μm particle-packed columns in
ultra-high pressure liquid chromatography, J. Sep. Sci. 35 (2012) 2018–2202.
[14] W. Marek, D. Sauer, A. Dürauer, A. Jungbauer, W. Piatkowski
˛
, D. Antos, Prediction tool for loading, isocratic elution, gradient elution and scaling up of ion
exchange chromatography of proteins, J. Chromatogr. A 1566 (2018) 89–101.
[15] K. Baran, W.K. Marek, W. Piatkowski
˛
, D. Antos, Effect of flow behavior in extra-column volumes on the retention pattern of proteins in a small column, J.
Chromatogr. A 1598 (2019) 154–162.
[16] M. Kołodziej, D.G. Sauer, J. Beck, W.K. Marek, R. Hahn, A. Jungbauer,
A. Dürauer, W. Piatkowski
˛
, D. Antos, Scale up of a chromatographic capture
step for a clarified bacterial homogenate- influence of mass transport limitation and competitive adsorption of impurities, J. Chromatogr. A 1618 (2020)
460856.
[17] F. Gritti, G. Guiochon, Accurate measurements of peak variances: importance
of this accuracy in the determination of the true corrected plate heights of
chromatographic columns, J. Chromatogr. A 1218 (2011) 4446–4452.
[18] F. Gritti, A. Felinger, G. Guiochon, Influence of the errors made in the measurement of the extra-column volume on the accuracies of estimates of the
column efficiency and the mass transfer kinetics parameters, J. Chromatogr. A
1136 (2006) 57–72.
5. Conclusion
The CFD method was used to predict flow behavior and band
profiles of small and macro-molecule compounds (acetone, BSA, an
antibody) in ECV of an Äkta chromatographic system as well as to
elucidate the reason of band broadening in different elements of
the system. The ECV construction was approximated by different
geometries: a straight capillary tube with constant average diameter, a system of straight capillaries with different diameters corresponding to the individual ECV elements and, finally, the system
in which curvature of flow path was accounting for. As expected,
the contribution of flow behavior to band broadening depended
on the residence time of the eluting species, however changes in
the eluent flowrate affected band profiles differently than changes
in the flow path length. Moreover, the flowrate effect was found
to be much weaker than anticipated for laminar flow regime. This
was explained by contradictory impact of flow behavior in straight
and curved elements of the ECV system. Flow turbulence was induced in connection points of capillaries of different diameters, in
the detector cell, in the injection loop capillaries, where Dean vertices were formed. The effect depended on the diffusion rate attributed to molar weight of the eluting species. In case of smallmolecule acetone, reduction in the residence time made a major contribution to band broadening, thus increase in flowrate impaired the peak symmetry. For macromolecules, which are characterized by very low diffusivity, turbulences in flow path accelerated mass transport, which improved peak symmetry. This concerned both small and large injections. Therefore, increase in the
flowrate during the protein injection may be favorable for the system performance. This is not applicable for large injection volumes,
when the protein concentration front spreads over the column during the injection interval. Another factor, which can be exploited to
improve the symmetry of protein peaks eluting from ECV, is flow
path tortuosity. Increase in tortuosity induces flow turbulences due
to the formation of Dean vortices, which may mitigate effects arising from slow diffusion rate.
Funding
This work was partially supported by Polish Ministry of Science
and Higher Education under the program ’Regional Initiative of Excellence’ in 2019-2022. Project No. 027/RID/2018/19.
9
B. Filip, R. Bochenek, K. Baran et al.
Journal of Chromatography A 1653 (2021) 462410
[19] F. Gritti, G. Guiochon, On the minimization of the band-broadening contributions of a modern, very high pressure liquid chromatograph, J. Chromatogr. A
1218 (2011) 4632–4648.
[20] S. Schweiger, A. Jungbauer, Scalability of pre-packed preparative chromatography columns with different diameters and lengths taking into account extra
column effects, J. Chromatogr. A 1537 (2018) 66–74.
[21] E.V. Dose, G. Guiochon, Effects of extra column convolution on preparative
chromatographic peak shapes, Anal. Chem. 62 (1990) 1723–1730.
[22] O. Kaltenbrunner, A. Jungbauer, S. Yamamoto, Prediction of the preparative
chromatography performance with a very small column, J. Chromatogr. A 760
(1997) 41–53.
[23] K.M. Usher, C.R. Simmons, J.G. Dorsey, Modeling chromatographic dispersion: a comparison of popular equations, J. Chromatogr. A 120 0 (20 08) 122–
128.
[24] J.G. Atwood, M.J.E. Golay, Early phases of the low dispersion of a sample injected in poiseuille flow, J. Chromatogr. 186 (1979) 353–370.
[25] J.G. Atwood, M.J.E. Golay, Dispersion of peaks by short straight open tubes in
liquid chromatography systems, J. Chromatogr. 218 (1981) 97–122.
[26] J.S. Vrentas, C.M. Vrentas, Dispersion in laminar tube flow at low Peclet numbers or short times, AIChE J. 34 (1988) 1423–1430.
[27] A. Shankar, A.M. Lenhoff, Dispersion in round tubes and its implications for
extra column dispersion, J. Chromatogr. A 556 (1991) 235–248.
[28] A. Shankar, A.M. Lenhoff, Dispersion in laminar flow in short tubes, AIChE J.
35 (1989) 2048–2052.
[29] K. Broeckhoven, G. Desmet, Numerical and analytical solutions for the column
length-dependent band broadening originating from axisymmetrical trans-column velocity gradients, J. Chromatogr. A 1216 (2009) 1325–1337.
[30] U. Tallarek, E. Rapp, T. Scheenen, E. Bayer, H. Van As, Electroosmotic and pressure-driven flow in open and packed capillaries: velocity distributions and
fluid dispersion, Anal. Chem. 72 (20 0 0) 2292–2301.
[31] G. Rousseaux, M. Martin, A. De Wit, Viscous fingering in packed chromatographic columns: non-linear dynamics, J. Chromatogr. A 1218 (2011)
8353–8361.
[32] S. Gerontas, M.S. Shapiro, D.G. Bracewell, Chromatography modelling to describe protein adsorption at bead level, J. Chromatogr. A 1284 (2013) 44–
52.
[33] A. Püttmann, M. Nicolai, M. Behr, E. von Lieres, Stabilized space–time finite
elements for high-definition simulation of packed bed chromatography, Finite
Elem. Anal. Des. 86 (2014) 1–11.
[34] C. Jungreuthmayer, P. Steppert, G. Sekot, A. Zankel, H. Reingruber,
J. Zanghellini, A. Jungbauer, The 3D pore structure and fluid dynamics
simulation of macroporous monoliths: high permeability due to alternating
channel width, J. Chromatogr. A 1425 (2015) 141–149.
[35] D. Iurashev, S. Schweiger, A. Jungbauer, J. Zanghellini, Dissecting peak broadening in chromatography columns under non-binding conditions, J. Chromatogr.
A 1599 (2019) 55–65.
[36] U. Umatheva, G. Chen, R. Ghosh, Computational fluid dynamic (CFD) simulation of a cuboid packed-bed chromatography device, Chem. Eng. Res. Des. 152
(2019) 393–401.
[37] U. Umatheva, P. Madadkar, P.Ravi Selvaganapathy, R. Ghosh, Computational
fluid dynamic (CFD) simulation of laterally-fed membrane chromatography,
Chem. Eng. Res. Des. 137 (2018) 412–420.
[38] M. Harasek, G. Paul, C. Jordan, A. Friedl, CFD-simulation of preparative chromatographic columns: effect of the distributor and the column design on the
separation performance, Chem. Ingen. Tech. 73 (2001) 639.
[39] R. Ghosh, G. Chen, U. Umatheva, P. Gatt, A flow distribution and collection feature for ensuring scalable uniform flow in a chromatography device, J. Chromatogr. A. 1618 (2020) 460892.
[40] W. Smits, S. Deridder, G. Desmet, The impact of flow distribution on column
performance: a computational fluid dynamics study, J. Chromatogr. A 1369
(2014) 125–130.
[41] S. Deridder, G. Desmet, K. Broeckhoven, Numerical investigation of band
spreading generated by flow-through needle and fixed loop sample injectors,
J. Chromatogr. A 1369 (2014) 125–130.
[42] M.T Tyn, T.W. Gusek, Prediction of diffusion coefficients of proteins, Biotechnol.
Bioeng. 35 (1990) 327–338.
[43] A.M. Janssen, Axial dispersion in laminar flow through coiled tubes, Chem.
Eng. Sci. 31 (1976) 215–218.
[44] H. Song, Y. Vanderheyden, E. Adams, G. Desmet, D. Cabooter, Extensive
database of liquid phase diffusion coefficients of some frequently used test
molecules in reversed-phase liquid chromatography and hydrophilic interaction liquid chromatography, J. Chromatogr. A 1455 (2016) 102–112.
10