Multiplexed analysis of amino acids in mice brain microdialysis samples using isobaric labeling and liquid chromatography-high resolution tandem mass spectrometry
Bạn đang xem bản rút gọn của tài liệu. Xem và tải ngay bản đầy đủ của tài liệu tại đây (2.19 MB, 10 trang )
Journal of Chromatography A 1656 (2021) 462537
Contents lists available at ScienceDirect
Journal of Chromatography A
journal homepage: www.elsevier.com/locate/chroma
Multiplexed analysis of amino acids in mice brain microdialysis
samples using isobaric labeling and liquid chromatography-high
resolution tandem mass spectrometry
Juho Heininen a, Ulrika Julku b, Timo Myöhänen b, Tapio Kotiaho a,c, Risto Kostiainen a,∗
a
Drug Research Program and Division of Pharmaceutical Chemistry and Technology, Faculty of Pharmacy, University of Helsinki, P.O. Box 56, FI-00014,
Finland
Division of Pharmacology and Pharmacotherapy, Faculty of Pharmacy, University of Helsinki, P.O. Box 56, FI-00014, Finland
c
Department of Chemistry, Faculty of Science, University of Helsinki, P.O. Box. 55, FIN-00014, Finland
b
a r t i c l e
i n f o
Article history:
Received 27 May 2021
Revised 26 August 2021
Accepted 1 September 2021
Available online 7 September 2021
Keywords:
Multiplexing
Isobaric labeling
Isotope dilution
Metabolites
Amino acids
High resolution tandem mass spectrometry
a b s t r a c t
We developed a new multiplexed reversed phase liquid chromatography-high resolution tandem mass
spectrometric (LC-MS/MS) method. The method is based on isobaric labeling with a tandem mass tag
(TMT10-plex) and stable isotope-labeled internal standards, and was used to analyze amino acids in
mouse brain microdialysis samples. The TMT10-plex labeling of amino acids allowed analysis of ten samples in one LC-MS/MS run, significantly increasing the sample throughput. The method provides good
chromatographic performance (peak half-width between 0.04–0.12 min), allowing separation of all TMTlabeled amino acids with acceptable resolution and high sensitivity (limits of detection typically around
10 nM). The use of stable isotope-labeled internal standards, together with TMT10-plex labeling, ensured
good repeatability (relative standard deviation ≤ 12.1 %) and linearity (correlation coefficient > 0.994),
indicating good quantitative performance of the multiplexed method. The method was applied to study
the effect of d-amphetamine microdialysis perfusion on amino acid concentrations in the mouse brain.
All amino acids were reliably detected and quantified, indicating that the method is sensitive enough to
detect low concentrations of amino acids in brain microdialysis samples.
© 2021 The Author(s). Published by Elsevier B.V.
This is an open access article under the CC BY license ( />
1. Introduction
Mass spectrometry combined with chromatographic methods
has largely been applied to quantitative bioanalysis. Quantitative
methods can be based on the use of external or internal standards.
Internal standard method, which often uses stable isotope dilution methodology, provides high reliability for quantitative analysis [1]. This is because the method can compensate for the possible variabilities in sample preparation or suppression in ionization, especially when electrospray ionization is used in liquid
chromatography-mass spectrometry (LC-MS). This is important for
the quantitative analysis of complex biological samples.
Multiplexing permits the quantification of several samples simultaneously within one LC-MS run for relative or absolute quantification. Multiplexing can be achieved with MS resolvable mass
difference labeling or tandem mass spectrometry (MS/MS or MS2 )
∗
Corresponding author at: University of Helsinki, Department of Pharmacy, Division of Pharmceutical Chemistry, P.O. Box 56, FI-0 0 014 Helsinki, Finland.
E-mail address: risto.kostiainen@helsinki.fi (R. Kostiainen).
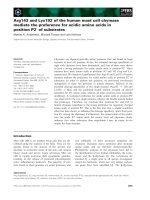
resolvable isobaric labeling. MS2 resolvable isobaric labeling is
based on a set of isotopomeric tags that all include the same number of stable isotopes but are located at different positions in the
individual tags (Fig. 1). All isotopomers of isobaric tags have the
same mass (i.e. are isobaric); the chemical structure is composed
of a reporter group, mass balancer group, and reactive group. The
reactive group permits selective reaction with the specific functional group of an analyte that is often a primary or secondary
amine, allowing fast and easy derivatization, for example with Nhydroxysuccinimide (NHS)-ester [2]. The number of stable isotopes
(e.g. 2 H, 13 C, 15 N, or 18 O) is the same in all isotopomers, but their
number in the reporter and balancer group varies between the
different isotopomers. Multiple samples are labeled with different
isotopomeric tags and the samples are pooled for coincident analysis. In LC-MS/MS analysis, labeled isobaric analytes are eluted at
the same retention time and passed through the first mass analyzer (MS). The labeled analytes produce multiple sample-specific
reporter ion isotopologues, which are separated with the second
mass analyzer and used for the quantification of an analyte in each
individual sample (Fig. 1). Multiplexing is limited to the number of
/>0021-9673/© 2021 The Author(s). Published by Elsevier B.V. This is an open access article under the CC BY license ( />
J. Heininen, U. Julku, T. Myöhänen et al.
Journal of Chromatography A 1656 (2021) 462537
Fig. 1. The derivatization reaction of amino acids with TMT, the analytical process of multiplexing with TMT10-plex, and multiplexed MS/MS analysis of phenylalanine as an
example. Different colors in mass spectra present ten different TMT isotopomers of the amino acid.
reporter ion isotopologues. Examples of isobaric labels are commercial tandem mass tag (TMT) [3], aminoxyTMT [4] and isobaric
tag for relative and absolute quantitation (iTRAQ) [5] and custom
synthesized reagents such as cleavable isobaric labeled affinity tag
(CILAT) [6], deuterium isobaric amine reactive tag (DiART) [7], and
dimethylated amino acids such as DiLeu, DiAla, and DiVal [8]. Isobaric labeling currently provides up to 18-plex with TMT reagents.
Multiplexing-based methods using isobaric labeling are unquestionably important, and have been widely used not only in quantitative proteomics [9], but also in metabolomics [10], glycomics
[11,12] and lipidomics [13]. Amino acids are an important class
of metabolites, as they are building blocks of proteins, and play a
central role in several processes such as energy metabolism, lipid
transport and neurotransmission. Dysregulation of amino acids
may result in several life-threatening diseases, and therefore quantitative analysis of amino acids in diagnostics is important [14–17].
LC-MS and gas chromatography-mass spectrometry (GC-MS)
have been widely used for the analysis of amino acids. However,
both methods are relatively slow and higher sample throughput
is needed, especially in clinical studies. Multiplexing with isobaric
2
J. Heininen, U. Julku, T. Myöhänen et al.
Journal of Chromatography A 1656 (2021) 462537
labeling provides a potential method to improve sample throughput. Thus far, multiplexing with isobaric labeling has rarely been
used to quantify amino acids. In 2009, Kaspar et al.[18] applied
isobaric labeling for the absolute quantification of amino acids in
urine using 2-plex iTRAQ chemistry; iTRAQ reagent 114 (producing reporter ion m/z 114) was used for the production of labeled
amino acid internal standards, and iTRAQ reagent 115 (producing
reporter ion m/z 115) for the labeling of amino acid analytes in
urine. A new generation 2-plex iTRAQ reagent called aTRAQ, which
had an 8 mass unit difference between reporter ions (m/z 113 and
m/z 121) was used for the absolute quantification of amino acids in
urine[19] and for relative quantification of amino acids and amines
in urine and plasma samples for discovering potential hepatotoxic
biomarkers [20]. These types of 2-plex quantification methods have
been shown to provide good quantitative performance, although
they do not improve sample throughput via multiplexing.
Yuan et al. improved sample throughput by first applying isobaric 4-plex DiART labeling for multiplexed relative quantitative
analysis [21], and later 6-plex DiART labeling for multiplexed absolute quantitative analysis [22] of metabolic amines and amino
acids in human aortic endothelial cells. The absolute quantitative
analysis method used three of the 6-plex DiART isotopomers to
produce labeled analyte standards, which were used to generate
a three-point calibration curve, and three isotopomers to label analytes in the cell samples. Hao et al. presented a relative quantitation method for amine metabolites including amino acids by using 4-plex DiLeu labeling [23]. TMT-based quantitation has also
been used to measure intracellular and culture medium amino
acid concentrations by both isobaric and mass difference labeling
methods with TMT0, TMT6-plex and TMT10-plex reagents [24]. Although these studies highlight the potential of multiplexing using isobaric labeling, there is no validated absolute quantification
method for amino acids that combines multiplexing and the use of
stable isotope-labeled amino acids as internal standards [25].
In this study, we take full advantage of multiplexing in order
to improve sample throughput. We developed an absolute quantitation method for free amino acids in mice brain microdialysis
samples using TMT10-plex labeling and isotopically-labeled amino
acids as internal standards. The developed quantitative method
was validated in terms of limit of quantitation, limit of detection,
linearity, repeatability, and specificity. The method was applied to
study the effect of d-amphetamine perfusion to the mouse brain
on absolute concentrations of 21 amino acids. The distribution of
amino acids and the effect of the central nervous system stimulants on extracellular amino acid profiles in the brain have been
studied earlier, but only with a limited number of amino acids
[26–30]. The method developed in this work was shown to provide
a highly sensitive and repeatable quantitative method for analyzing
amino acids in minute volumes of mouse brain microdialysis samples.
reagents, triethylammonium bicarbonate (TEAB) buffer and hydroxylamine solution were purchased from Thermo Fisher Scientific.
d-amphetamine sulphate (Tocris Bioscience) was dissolved in the
Ringer’s solution.
2.2. Samples
Brain microdialysis samples were collected from the
left striatum of 12-month-old mice (Male C57BL/6J-Tg(THSNCA∗ A30P∗ A53T)39Eric/J; The Jackson Laboratory, USA) as
described in detail in earlier works [31]. Briefly, a microdialysis
probe (1-mm cuprophan membrane, o.d. 0.2 mm, 6 kDa cut-off;
AT4.9.1.Cu, AgnTho’s) was inserted through a guide cannula 2 h
before the experiments. The probe was perfused with Ringer’s
solution at a flow rate of 2 μL min−1 . After the 2 hour stabilization period, the microdialysis probe was perfused with Ringer’s
solution for 60 min, followed by perfusion of d-amphetamine sulphate in Ringer’s solution (10 μM for 60–100 min, and 30 μM for
140–180 min), with perfusion of Ringer’s solution (recovery time)
(100–140 min) between the different d-amphetamine sulphate
concentrations. Finally, the microdialysis probe was perfused with
Ringer’s solution for 80 min (180–260 min). The microdialysis
samples were collected during the perfusion of pure Ringer’s
solution (for 60 min; baseline samples), and during the perfusion
of 10 μM (for 40 min) and 30 μM (for 40 min) d-amphetamine
sulphate. The samples were collected from three different mice,
then pooled and divided into three technical replicates in order to
evaluate the technical repeatability of the method with authentic
samples. All microdialysis experiments were done according to
European Communities Council Directive 86/609/EEC and were
approved by the Finnish National Animal Experiment Board
(ESAVI/441/04.10.07/2016).
Microdialysis and standard samples were spiked with 40 μL
of the stable isotope-labeled amino acids (10 μM) as internal
standards, and evaporated to dryness (40°C, SpeedVack). Standard
samples, including the 21 non-labeled amino acids, were prepared and diluted to appropriate concentrations from individual
amino acid stock solutions to the matrix-matched Ringer’s solution. The corresponding stable isotope-labeled amino acids were
used for each analyte, excluding asparagine, glutamine, gammaaminobutyric acid (GABA) and tryptophan that were not available. Stable isotope-labeled amino acids with similar ionization efficiencies, mass spectrometric and chromatographic behavior were
chosen as their surrogate internal standards as follows: aspartic
acid for asparagine, glycine for GABA, arginine for glutamine and
leucine for tryptophan.
Evaporated samples were reconstituted to 80 μL with 400 mM
TEAB buffer and labeled using 14 μL of 17.5 mM TMT10-plex
reagent in acetonitrile. TMT0 was used to optimize labeling conditions and to study chromatographic and mass spectrometric behavior of the TMT0-labeled amino acids as it has identical chemistry
as the isotopomers of TMT10-plex. Moreover, TMT0 is a lot cheaper
than TMT10-plex. TMT0 labeling of the amino acid standards was
done similarly as TMT10-plex labeling. The reaction was performed
at room temperature for 1 hour and quenched with 6 μL of 5 %
hydroxylamine. Different TMT10-plex isotopomers-labeled samples
were pooled and evaporated to dryness (40°C, SpeedVack). Dried
samples were reconstituted to 30 μL of 1 % methanol with 0.1 %
formic acid in water for LC-MS analysis.
2. Materials and methods
2.1. Standards and chemicals
21 non-labeled amino acid standards were purchased from
Sigma, and 17 isotope (15 N and 13 C) labeled amino acids (Cambridge Isotope Laboratories) were used as internal standards (Table S1). Deionized water used in all experiments was prepared
with a Milli-Q water purification system (Milli-Q® Integral 15 Water Purification System with Quantum TEX cartridge) on site. LCMS Chromasolv-grade acetonitrile and methanol were purchased
from Honeywell, and formic acid from Merck. Ringer’s solution
was prepared (147 mM NaCl (Merck), 1.2 mM CaCl2 (Merck), 2.7
mM KCl (Allied signal), 1.0 mM MgCl2 (Sigma), and 0.04 mM
ascorbic acid (Fluka biochemika)). TMT0 and TMT10-plex isobaric
2.3. LC-MS analysis
The LC-MS analyses were performed using an Orbitrap Fusion
mass spectrometer (Thermo Fisher Scientific) coupled with an UltiMate 30 0 0 liquid chromatography setup (Thermo Fisher Scientific).
The column was Acquity UPLC C-18 (HSS T3, 2.1 mm x 100 mm, 1.7
3
J. Heininen, U. Julku, T. Myöhänen et al.
Journal of Chromatography A 1656 (2021) 462537
Table 1
Validation of the multiplexed LC-MS/MS method for the analysis of amino acids in brain microdialysis samples. The calibration curve was determined by weighing 1/x and
n is the number of individual samples within calibration range.
Analyte
tR (min)
tR repeatabilityRSD (%)
Calibration range (μM)
n
R
LOD(μM)
LOD(ng-mL−1 )
LOQ(μM)
Method repeatabilityRSD (%)
Alanine
Arginine
Asparagine
Aspartic acid
Cystine
GABA
Glutamine
Glutamic acid
Glycine
Histidine
Isoleucine
Leucine
Lysine
Methionine
Phenylalanine
Proline
Serine
Threonine
Tryptophan
Tyrosine
Valine
3.50
2.28
2.34
3.10
4.81
3.76
2.86
3.42
2.62
2.19
6.72
6.89
4.27
5.45
7.30
4.53
2.49
3.39
7.63
5.49
5.43
0.15
1.61
0.17
0.33
0.20
0.27
0.24
0.18
0.43
0.80
0.07
0.30
0.31
0.14
0.05
0.28
0.19
0.21
0.06
0.18
0.31
0.03
0.1
0.03
0.03
0.03
0.05
0.3
0.1
0.05
0.1
0.03
0.03
0.03
0.03
0.03
0.01
0.1
0.03
0.01
0.03
0.1
8
6
7
8
7
7
8
6
7
6
8
8
8
8
8
9
6
8
7
8
6
0.9975
0.9995
0.9952
0.9980
0.9997
0.9981
0.9992
0.9959
0.9978
0.9987
0.9967
0.9972
0.9985
0.9984
0.9971
0.9965
0.9982
0.9971
0.9962
0.9970
0.9949
0.01
0.05
0.01
0.01
0.01
0.01
0.1
0.01
0.01
0.01
0.01
0.01
0.01
0.01
0.01
0.005
0.03
0.01
0.005
0.01
0.01
0.89
8.71
1.32
1.33
2.40
1.03
14.6
1.47
0.75
1.55
1.31
1.31
1.46
1.49
1.65
0.58
3.15
1.19
1.02
1.81
1.17
0.03
0.10
0.03
0.03
0.03
0.05
0.30
0.10
0.05
0.10
0.03
0.03
0.03
0.03
0.03
0.01
0.10
0.03
0.01
0.03
0.10
10.4
4.3
11.1
8.3
3.4
3.9
4.5
2.8
8.0
5.6
3.4
8.8
3.6
6.9
3.9
9.0
11.6
8.2
6.7
4.1
12.1
-
10
10
5
10
5
10
100
10
10
10
10
10
10
10
10
10
10
10
0.7
10
10
μm with inline filter). The column and autosampler temperatures
were 10°C and 30°C, respectively; injection volume was 2 μL, and
flow rate was 0.29 mL min−1 . The eluent A was 0.1 % formic acid in
methanol:water (3:97 %) and eluent B was 0.1 % formic acid in 100
% methanol. The gradient was from 0 % B to 50 % B in 8 min, from
50 % B to 95 % B in 10 min and 95 % B 3.5 min, and from 95 % B
to 0 % B in 10 min. In order to avoid any carry-over, a cleaning run
was performed after each run using the following gradient: from
0 % B to 95 % B in 15 min, from 95 % B to 0 % B in 16 min, and
20 min at 0 % B. Because the brain microdialysis samples include
high concentration of salts, they were diverted to waste by 1-min
column-switching to avoid contamination of the ion source.
MS spectra were measured using electrospray ionization in positive ion mode, wide quadrupole isolation, Orbitrap resolution of
120 0 0 0, and scan range m/z 110–10 0 0. Automated gain control
(AGC) was set to accumulate 2 × 10⁵ ions with a maximum injection time of 100 ms. The ion transfer tube temperature was
325°C. Internal mass calibration with Easy-IC (fluoranthene) was
used. MS/MS measurements were performed using parallel reaction monitoring (PRM) and timed precursor isolation based on the
analyte retention times. A quadrupole mass window of 1.1 Da was
used to isolate precursor ions, and the normalized collision energy
using higher-energy collisional dissociation (HCD) was optimized
to 30 %. Reporter product ions were detected with a mass resolution of 60 0 0 0 and scan range of m/z 90–160. AGC was set to
accumulate 3 × 10⁵ ions with a maximum injection time of 118
ms. In order to measure the MS/MS spectra of the isobaric labeled amino acids, whole product ion spectra were measured with
a mass range of m/z 70–500 and resolution of 50 0 0 0. Mass accuracy of <10 ppm for the reporter ions were used to identify the
isobaric-labeled amino acids.
Analysis (CoA). The method was partially validated according to
ICH guidelines (ICH Q2 (R1) Validation of analytical procedures: text
and methodology) in terms of specificity, linearity, limit of detection (LOD), limit of quantitation (LOQ), and method repeatability.
LOD was determined as the lowest measured concentration producing a signal to noise ratio (S/N) > 3. LOQ was determined from
the calibration curve as the lowest measured concentration with
<25 % relative deviation from the calibration line. The calibration
curve was determined by weighing 1/x and LOQ as the lowest concentration point. Method repeatability was determined using the
multiplexed replicates of 1 μM sample (n = 9). One sample of the
10 repeatability determination replicates, as well as one calibration standard and one microdialysis sample replicate of the baseline sample were excluded as outliers based on Grubb’s test [32].
Statistical tests were done using IBM statistics SPSS 24 for Levene’s
test for equal variance, one-way ANOVA and Tukey’s HSD.
3. Results and discussion
3.1. Labeling and mass spectra
The TMT labeling produced mainly singly labeled species with
most of the amino acids, excluding cystine and lysine, which include a primary amine group on their side chain and were doubly labeled. TMT and other NHS-ester-based reagents are relatively
prone to hydrolysis reactions that may result in decreased product yields. This can be minimized by using excess of TMT labeling
reagent. Amount of TMT was optimized using samples including 5
μM of each amino acid and 1.8, 14.1, 23.8, 47.6, 70.5 and 237.9 fold
excess of TMT0. The concentration of 5 μM was selected because
the concentrations of amino acids are typically much less than 5
μM in brain microdialysis samples. The optimization results (Figure S1) as well as the repeatability tests (Table 1) show that at
least 20-fold excess of TMT labeling reagent provides full and repeatable labeling. The use of higher concentrations of TMT result
in increased costs but also in increased concentrations of TMT byproducts, which may disturb the analysis of amino acids. 20-fold
excess of TMT labeling reagent has been found to be suitable also
in the earlier NHS-based labeling methods [33,34]. NHS chemistry
related o-acylations [35] of hydroxyl bearing side chains (i.e. serine,
threonine and tyrosine) were eliminated with hydroxylamine, and
no o-acylation of serine, threonine and tyrosine were produced.
2.4. Data interpretation and method validation
The raw data was imported to Skyline, along with the transition list of each analyte and internal standard with reporter ions.
The theoretical monoisotopic masses were calculated using Excel and ChemDraw Professional (PerkinElmer, vers 18.2.0.48). Each
analyte-specific reporter ion chromatogram was integrated, and results were exported to Excel. Channel crosstalk from isotope impurities were corrected by the inverse matrix method with impurity abundance on the provided isobaric reagent Certificate of
4
J. Heininen, U. Julku, T. Myöhänen et al.
Journal of Chromatography A 1656 (2021) 462537
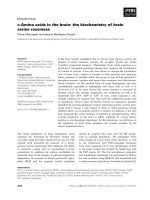
Fig. 2. MS/MS fragmentation sites of the TMT labeled amino acids and proposed structures of the fragments with accurate masses and mass errors shown as example of
TMT0 labeled alanine (R=methyl group). The MS/MS spectra are presented in more detail in Table S2.
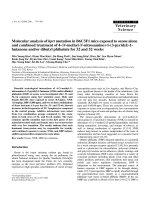
Fig. 3. Extracted ion chromatograms of equimolar concentrations of TMT0 labeled and non-labeled amino acids. Note that the y-axis scale for the labeled amino acids is ten
times wider than for the non-labeled amino acids.
The mass spectrometric and chromatographic behavior of TMTlabeled amino acids were studied using TMT0 labeling. All the
mass spectra of the TMT0-labeled amino acids and internal standards show abundant protonated molecules with minimal fragmentation, except the double labeled amino acids (cystine and lysine), which were detected as double protonated molecules (Table
S1). The mass accuracies of the protonated molecules were below
0.75 mmu, confirming the successful TMT labeling of the amino
acids (Table S1). Fig. 2 presents the MS/MS fragmentation scheme,
and Table S2 summarizes the high resolution MS/MS spectra of the
protonated molecules of the TMT0-labeled amino acids with accurate masses and mass errors. The most intensive product ions
are reporter ions that were used for the quantification, and the
TMT end ions formed by the dissociation of the amide bond bind-
ing TMT to the amino acid (ions C and D). The C ion is likely an
acylium ion ([RCO]+ ). The accurate masses (Table S2) show that the
D ion includes three oxygen and two nitrogen atoms. This suggests
that the D ion is formed by the dissociation of the amide bond, followed by the migration of the hydroxyl group from the amino acid
moiety to the D structure by a rearrangement reaction. The product ion spectra also show minor ions formed by the loss of H2 O
(ion A) and HCOOH (ion B) from the amino acid moiety. Similar
fragmentation was observed with the stable isotope-labeled TMT0
derivatives used as internal standards. The mass accuracies of the
TMT0 reporter ions were below 0.17 mmu (1.28 ppm) (Table S2),
allowing the use of a narrow mass window (<10 ppm) for identifying analytes and thus ensuring high specificity of the analysis.
5
J. Heininen, U. Julku, T. Myöhänen et al.
Journal of Chromatography A 1656 (2021) 462537
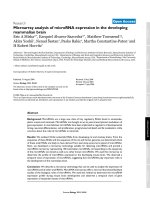
Fig. 4. LC-MS/MS extracted ion chromatograms of reporter ions of TMT10-plex labeled amino acids from 10 different samples with different concentrations used to prepare
calibration curves for quantification. Threonine is zoomed as an example.
3.2. LC-MS analysis
acids. The increased hydrophobicity of TMT-labeled amino acids
also significantly improved the retention with the C-18 phase and
thus separation efficiency compared to more polar non-labeled
amino acids, which showed low retention and poor separation efficiency for the most polar amino acids (Fig. 3).
All TMT-labeled amino acids and corresponding internal standards were separated from each other with retention times of 2
to 8 min, and with peak widths (FWHM) of 0.04–0.12 min (Table
S3), including TMT-labeled leucine and isoleucine, which were separated with peak resolution (Rs ) of 1.3. No significant change was
seen with retention times between TMT-labeled analytes or stable
isotope amino acids used as internal standards (Table S3). As all internal standards included at least three heavy isotopes, all internal
standards were fully separated by MS from the co-eluting analytes.
The results above indicate good chromatographic performance
of the developed LC method. The multiplexed LC-MS/MS analyses
of the amino acids were carried out by using TMT10-plex labeling
for 10 different samples including analytes and internal standards,
which were pooled to one sample after the TMT10-plex labeling.
The 10 sample-specific reporter ions within m/z 126–131 formed in
The analysis of the non-labeled and TMT0-labeled amino acids
by reversed-phase LC-MS were compared (Fig. 3). The results
show that the TMT labeling significantly improves sensitivity
and chromatographic separation, which corroborates previous analytical methods based on the isobaric labeling of amino acids
[21,24,36]. The ionization efficiency and chromatographic retention
on reversed-phases of non-labeled amino acids is poor due to their
polar character. The TMT-labeled amino acids are more hydrophobic and thus more surface active than non-labeled amino acids in
the solvents used in the LC-ESI/MS analysis. The increased surface activity of the TMT-labeled amino acids improves ion emission from the charged droplets formed in ESI, resulting in improved ionization efficiency and thus sensitivity. Moreover, the
TMT-labeled amino acids are eluted with higher organic solvent
content in reversed-phase LC than non-labeled amino acids, which
is also known to improve ionization efficiency in ESI. For most
of the TMT-labeled amino acids, the sensitivity was between one
and three orders of magnitude higher than for non-labeled amino
6
J. Heininen, U. Julku, T. Myöhänen et al.
Journal of Chromatography A 1656 (2021) 462537
= baseline samples (n=2),
= samples collected during the perfusion of 10 μM
Fig. 5. Amino acid concentrations (μM) in the microdialysis samples of mice brain.
= samples collected during the perfusion of 30 μM d-amphetamine (n=3). The error bars presents repeatability of the technical replicates (2
d-amphetamine (n=3) and
standard deviations). One way ANOVA and Tukey HSD, ∗ p<0.05, ∗ ∗ p<0.001. Further statistics in Tables S6-S8.
the high energy collisions were fully separated with mass resolution of 60 0 0 0. The use of timed precursor ion isolation according
to retention times (Table S4) in parallel reaction monitoring (PRM)
allowed enough data points for the reliable quantification of the
reporter ion peaks in the ion chromatograms. An example of the
extracted ion chromatograms of the reporter ions of TMT10-plex
labeled amino acid analytes used for determining the calibration
curve is presented in Fig. 4.
based on peak area ratios of the extracted reporter ion chromatograms of the TMT-labeled analytes and internal standards.
The LODs were determined as the lowest measured concentration producing signal to noise ratio (S/N) > 3. LODs were between
0.005–0.1 μM, indicating sufficient sensitivity for the analysis of
amino acids in mice brain microdialysis samples. LOQs were determined as the lowest measured concentration above the LOD with a
relative deviation of <25 % from the calibration curves. LOQs were
between 0.01–0.3 μM, which is below the concentration levels typically determined in mouse brain microdialysis samples [26,37–40].
LOQ was used as the lowest concentration point in determining
the calibration curve. Ten calibration samples, including analytes
and internal standards, were first prepared in Ringer’s solution,
then TMT10-plex labeled and pooled in order to prepare the calibration curve. The correlation coefficients (R) with 1/x weighing
were better than 0.994, indicating good linearity of the quantitative method. Calibrations curves of analytes are presented in Figure S2. The method repeatability was measured with 1 μM sam-
3.3. Method validation for mice brain microdialysis samples
The method was validated for specificity, limit of detection
(LOD), limit of quantification (LOQ), linearity, and repeatability
(Table 1) using TMT10-plex labeling of the amino acids and internal standards in Ringer’s solution. The reporter ion chromatograms
were integrated using Skyline-software. Isotope impurity related
channel-crosstalk was corrected by inverse matrix calculation before determining the validation parameters. Quantification was
7
J. Heininen, U. Julku, T. Myöhänen et al.
Journal of Chromatography A 1656 (2021) 462537
ples that were TMT10-plex labeled and pooled to one sample. The
relative standard deviation (RSD %) of the ratios of the peak areas
of the analytes and internal standards were ≤ 12.1 %, showing good
repeatability of the method. The RSD % of the retention times (tR )
(n=5) were typically below 0.8 %, showing good chromatographic
repeatability. The validation results show that the developed multiplexed method is feasible for quantitative analysis of amino acids
in brain microdialysis samples.
of amphetamine on the Krebs cycle, which produces precursors
for several amino acids [46]. Another main difference between
this and earlier studies is that we used alpha-synuclein transgenic
mice that have an impaired amphetamine response in the striatal dopamine release [31]. Amphetamine reverts the function of
dopamine transporter (DAT), leading to the release of dopamine
on extracellular space; amphetamine also reverts serotonin transporter (SERT), particularly with higher doses [47]. Alpha-synuclein
aggregation reduces both DAT and SERT functions [48,49], altering the amphetamine response and ultimately leading to reduced
dopamine, serotonin and other monoamines in extracellular space.
This may partially explain the reduced amino acid levels seen in
our analysis.
3.4. Microdialysis samples
The effect of adding d-amphetamine to amino acid concentrations in the mice brain was studied using the developed multiplexed LC-MS/MS method. The microdialysis samples were collected from the striatum of three different mice. Baseline samples,
as well as samples taken during the perfusion of 10 μM and 30 μM
d-amphetamine were collected. The samples from the three mice
were pooled and divided into three technical replicates (see experimental description for more detailed sample preparation). The
TMT10-plex reporter ion chromatograms of the microdialysis samples used for quantification are shown in Figure S3. The amino
acids from all samples were clearly detected, and no significant
background disturbances were detected in the ion chromatograms,
indicating good specificity of the method. The absolute quantitative results are presented in Fig. 5 and Table S5. The basal concentrations of amino acids in mice microdialysis samples were between 0.08 and 3.5 μM, with the exception of glutamine (concentration 75 μM). The basal concentration results are in accordance
with previous literature [26,37–40].
The Levene’s test indicated equal variances for most analyte
concentrations between basal, during 10 μM amphetamine perfusion and during 30 μM amphetamine perfusion groups (Table S6)
and a one-way ANOVA was performed to compare the effect of damphetamine perfusion on amino acid concentrations (Table S7).
Post hoc comparison using the Tukey’s HSD (Table S8) indicated
that the concentrations of most amino acids were significantly
(p<0.05, Table S8) lower in the samples collected during the perfusion of 10 μM and 30 μM d-amphetamine than in the basal samples. Only the glutamine concentration was significantly (p<0.05,
Table S8) increased. The amino acid concentrations in the 30 μM
d-amphetamine perfusion samples were at same level to those in
the 10 μM perfusion samples. However, the concentrations of the
most amino acids were slightly higher in the 30 μM perfusion samples than in the 10 μM samples, but still significantly lower than
in the basal samples.
The effect of amphetamine on amino acid levels in the striatum has been studied by microdialysis in several studies. However,
unlike in our study, amphetamine is usually administered systemically. In one of the first studies, Mora et al. showed that after 5 mg
kg−1 i.p. injection of amphetamine, the concentrations of aspartate,
glutamate and glutamine were significantly elevated in the striatum of rats [41]. Similar results have been reported with glutamic
acid, aspartic acid and alanine [42,43]. A respective increase in glutamic acid concentration was also presented by Xue et al. [44] in
the nucleus accumbens, although aspartic acid and serine levels remained unchanged. Our results are somewhat conflicting with earlier results[41–44], as we found decreased concentrations for most
of the amino acids in response to the perfusion of d-amphetamine.
There are two possible explanations for this finding. First, in
contrast to several other studies, our study perfused amphetamine
directly to the striatum via a microdialysis probe. This causes
a high local concentration of amphetamine that does not occur
in systematic administration. In a comparative study, Miele et al.
showed that the effects on glutamate were different when amphetamine was administered systematically or intrastriatally to rats
[45]. One mechanism behind this could be the inhibitory effect
4. Conclusions
The developed LC-MS/MS multiplexed method based on isobaric labeling and the use of stable isotope-labeled internal standards was shown to be feasible for the quantitative analysis of
amino acids in microdialysis samples of mice brain. Analyte labeling with TMT10-plex allowed analysis of ten samples in one LCMS/MS run, significantly increasing sample throughput – which is
especially important, for example, in clinical studies. The TMT labeling also improved the ionization efficiency (with ESI) and separation efficiency (with reversed-phase LC), resulting in improved
sensitivity and specificity of the analysis. Multiplexing also decreases variability between individual samples, hence improving
the reliability of the analysis. The validation results showed good
sensitivity (LODs typically 10 nM), repeatability (RSD % ≤ 12.1 %)
and linearity (R > 0.994), indicating good quantitative performance
of the method. The method was successfully applied to the absolute quantification of amino acids in mice brain microdialysis samples collected after the addition of d-amphetamine to the brain. All
amino acids were well-detected, indicating that the method is sensitive enough to detect low concentrations of amino acids in small
sample volumes such as brain microdialysis samples.
APPENDIX A. Supporting information
Additional information as noted in text. (PDF)
Declaration of Competing Interest
The authors declare that they have no known competing financial interests or personal relationships that could have appeared to
influence the work reported in this paper.
CRediT authorship contribution statement
Juho Heininen: Investigation, Formal analysis, Writing – original draft. Ulrika Julku: Resources, Investigation, Writing – review
& editing. Timo Myöhänen: Resources, Funding acquisition, Writing – review & editing. Tapio Kotiaho: Resources, Writing – review
& editing. Risto Kostiainen: Supervision, Writing – review & editing, Funding acquisition.
Acknowledgments
The authors thank Dr. Jaakko Teppo, Ms. Catharina Erbacher and
Dr. Anu Vaikkinen for their technical and theoretical assistance.
Funding
This work was supported by the Academy of Finland (projects
#321472 and #303833).
8
J. Heininen, U. Julku, T. Myöhänen et al.
Journal of Chromatography A 1656 (2021) 462537
Supplementary materials
[24]
Supplementary material associated with this article can be
found, in the online version, at doi:10.1016/j.chroma.2021.462537.
[25]
References
[26]
[1] E. Ciccimaro, I.A. Blair, Stable-isotope dilution LC–MS for quantitative
biomarker analysis, Bioanalysis 2 (2010) 311–341 doi:10.4155/
bio.09.185.
[2] T. Huang, M.R. Armbruster, J.B. Coulton, J.L. Edwards, Chemical tagging in
mass spectrometry for systems biology, Anal. Chem. 91 (2019) 109–125
doi:10.1021/acs.analchem.8b04951.
[3] A. Thompson, J. Schäfer, K. Kuhn, S. Kienle, J. Schwarz, G. Schmidt, T. Neumann,
C. Hamon, Tandem mass tags: a novel quantification strategy for comparative
analysis of complex protein mixtures by MS/MS, Anal. Chem. 75 (2003) 1895–
1904 doi:10.1021/ac0262560.
[4] S. Afiuni-Zadeh, J.C. Rogers, S.I. Snovida, R.D. Bomgarden, T.J. Griffin,
AminoxyTMT: a novel multi-functional reagent for characterization of protein
carbonylation, Biotechniques 60 (2016) 186–196 doi:10.2144/
0 0 0114402.
[5] S. Wiese, K.A. Reidegeld, H.E. Meyer, B. Warscheid, Protein labeling by iTRAQ: a
new tool for quantitative mass spectrometry in proteome research, Proteomics
7 (2007) 340–350 doi:10.1002/pmic.200600422.
[6] W. Yuan, J.L. Edwards, S. Li, Global profiling of carbonyl metabolites with
a photo-cleavable isobaric labeling affinity tag, Chem. Commun. 49 (2013)
11080–11082 doi:10.1039/c3cc45956j.
[7] D. Zeng, S. Li, Revival of deuterium-labeled reagents for protein quantitation,
Chem. Commun. (2009) 3369 doi:10.1039/b906335h.
[8] Q. Yu, X. Shi, T. Greer, C.B. Lietz, K.C. Kent, L. Li, Evaluation and application
of dimethylated amino acids as isobaric tags for quantitative proteomics of
the TGF-β /Smad3 signaling pathway, J. Proteome Res. 15 (2016) 3420–3431
doi:10.1021/acs.jproteome.6b00641.
[9] O. Chahrour, D. Cobice, J. Malone, Stable isotope labelling methods in mass
spectrometry-based quantitative proteomics, J. Pharm. Biomed. Anal. 113
(2015) 2–20 doi:10.1016/j.jpba.2015.04.013.
[10] L. Hao, Y. Zhu, P. Wei, J. Johnson, A. Buchberger, D. Frost, W.J. Kao, L. Li,
Metandem: an online software tool for mass spectrometry-based isobaric labeling metabolomics, Anal. Chim. Acta. 1088 (2019) 99–106 />doi:10.1016/j.aca.2019.08.046.
[11] J.A. Atwood, L. Cheng, G. Alvarez-Manilla, N.L. Warren, W.S. York, R. Orlando,
Quantitation by isobaric labeling: applications to glycomics, J. Proteome Res. 7
(2008) 367–374 doi:10.1021/pr070476i.
[12] S. Yang, M. Wang, L. Chen, B. Yin, G. Song, I.V. Turko, K.W. Phinney, M.J. Betenbaugh, H. Zhang, S. Li, QUANTITY: an isobaric tag for quantitative glycomics,
Sci. Rep. 5 (2015) 1–10 doi:10.1038/srep17585.
[13] F. Sun, A.A. Choi, R. Wu, Systematic analysis of fatty acids in human cells with
a multiplexed isobaric tag (TMT)-based method, J. Proteome Res. 17 (2018)
1606–1614 doi:10.1021/acs.jproteome.7b00896.
[14] B.K. Burton, Inborn errors of metabolism in infancy: a guide to diagnosis, Pediatrics 102 (1998) E69 doi:10.1542/peds.
102.6.e69.
[15] T.H. Zytkovicz, E.F. Fitzgerald, D. Marsden, C.A. Larson, V.E. Shih, D.M. Johnson,
A.W. Strauss, A.M. Comeau, R.B. Eaton, G.F. Grady, Tandem mass spectrometric
analysis for amino, organic, and fatty acid disorders in newborn dried blood
spots, Clin. Chem. 47 (2001) 1945–1955 doi:10.1093/clinchem/
47.11.1945.
[16] B. Wilcken, V. Wiley, J. Hammond, K. Carpenter, Screening newborns for inborn errors of metabolism by tandem mass spectrometry, N. Engl. J. Med. 348
(2003) 2304–2312 doi:10.1056/NEJMoa025225.
[17] J.W. Locasale, Serine, glycine and one-carbon units: cancer metabolism in
full circle, Nat. Rev. Cancer. 13 (2013) 572–583 doi:10.1038/
nrc3557.
[18] H. Kaspar, K. Dettmer, Q. Chan, S. Daniels, S. Nimkar, M.L. Daviglus, J. Stamler,
P. Elliott, P.J. Oefner, Urinary amino acid analysis: a comparison of iTRAQ®-LCMS/MS, GC-MS, and amino acid analyzer, J. Chromatogr. B. 877 (2009) 1838–
1846 doi:10.1016/j.jchromb.2009.05.019.
[19] P.K. Held, L. White, M. Pasquali, Quantitative urine amino acid analysis using liquid chromatography tandem mass spectrometry and aTRAQ® reagents,
J. Chromatogr. B. 879 (2011) 2695–2703 doi:10.1016/j.jchromb.
2011.07.030.
[20] Z. An, T. Hu, Y. Lv, P. Li, L. Liu, Targeted amino acid and related amines
analysis based on iTRAQ®-LC-MS/MS for discovering potential hepatotoxicity biomarkers, J. Pharm. Biomed. Anal. 178 (2020) 112812 />doi:10.1016/j.jpba.2019.112812.
[21] W. Yuan, J. Zhang, S. Li, J.L. Edwards, Amine metabolomics of hyperglycemic
endothelial cells using capillary LC-MS with isobaric tagging, J. Proteome Res.
10 (2011) 5242–5250 doi:10.1021/pr200815c.
[22] W. Yuan, K.W. Anderson, S. Li, J.L. Edwards, Subsecond absolute quantitation
of amine metabolites using isobaric tags for discovery of pathway activation
in mammalian cells, Anal. Chem. 84 (2012) 2892–2899 doi:10.
1021/ac203453t.
[23] L. Hao, X. Zhong, T. Greer, H. Ye, L. Li, Relative quantification of
amine-containing metabolites using isobaric N,N-dimethyl leucine (DiLeu)
[27]
[28]
[29]
[30]
[31]
[32]
[33]
[34]
[35]
[36]
[37]
[38]
[39]
[40]
[41]
[42]
[43]
[44]
[45]
9
reagents via LC-ESI-MS/MS and CE-ESI-MS/MS, Analyst 140 (2015) 467–475
doi:10.1039/C4AN01582G.
J.P. Murphy, R.A. Everley, J.L. Coloff, S.P. Gygi, Combining amine metabolomics
and quantitative proteomics of cancer cells using derivatization with isobaric
tags, Anal. Chem. 86 (2014) 3585–3593 doi:10.1021/ac500153a.
T. Higashi, S. Ogawa, Derivatization-based sample-multiplexing for enhancing throughput in liquid chromatography/tandem mass spectrometry quantification of metabolites: an overview, J. Chromatogr. A. 1634 (2020) 461679
doi:10.1016/j.chroma.2020.461679.
U. Tossman, G. Jonsson, U. Ungerstedt, Regional distribution and extracellular
levels of amino acids in rat central nervous system, Acta Physiol. Scand. 127
(1986) 533–545 doi:10.1111/j.1748-1716.1986.tb07938.x.
J.C.R. Fernando, G. Curzon, Effect of d-amphetamine on tryptophan and
other aromatic amino acids in brain, Eur. J. Pharmacol. 49 (1978) 339–349
doi:10.1016/0014- 2999(78)90307- 2.
A. Del Arco, R. Martínez, F. Mora, Amphetamine increases extracellular concentrations of glutamate in the prefrontal cortex of the awake rat: a microdialysis study, Neurochem. Res. 23 (1998) 1153–1158 doi:10.1023/A:
1020769816332.
A. Del Arco, T.R. Castañeda, F. Mora, Amphetamine releases GABA in striatum
of the freely moving rat: involvement of calcium and high affinity transporter
mechanisms, Neuropharmacology 37 (1998) 199–205 doi:10.
1016/S0 028-3908(98)0 0 013-6.
M.M. Widelitz, A.M. Gugger, L. Lakritz, Amino acid distribution in brain after
use of amphetamines and β -phenylethylamine, Biochem. Biophys. Res. Commun. 122 (1984) 142–150 doi:10.1016/0 0 06- 291X(84)90451- 0.
T. Kilpeläinen, U.H. Julku, R. Svarcbahs, T.T. Myöhänen, Behavioural and
dopaminergic changes in double mutated human A30P∗ A53T alpha-synuclein
transgenic mouse model of Parkinsons´ disease, Sci. Rep. 9 (2019) 1–13
doi:10.1038/s41598- 019- 54034- z.
F.E. Grubbs, Procedures for detecting outlying observations in samples, Technometrics 11 (1969) 1–21 doi:10.1080/00401706.1969.10490657.
J. Wang, L. Zhou, H. Lei, F. Hao, X. Liu, Y. Wang, H. Tang, Simultaneous quantification of amino metabolites in multiple metabolic pathways using ultra-high
performance liquid chromatography with tandem-mass spectrometry, Sci. Rep.
7 (2017) 1–16 doi:10.1038/s41598- 017- 01435- 7.
J. Zecha, S. Satpathy, T. Kanashova, S.C. Avanessian, M.H. Kane, K.R. Clauser,
P. Mertins, S.A. Carr, B. Kuster, TMT labeling for the masses: a robust and costefficient, in-solution labeling approach, Mol. Cell. Proteomics. 18 (2019) 1468–
1478 doi:10.1074/mcp.TIR119.001385.
J.E. Wiktorowicz, R.D. English, Z. Wu, A. Kurosky, Model studies on iTRAQ modification of peptides: sequence-dependent reaction specificity, J. Proteome Res.
11 (2012) 1512–1520 doi:10.1021/pr2003165.
A. Gornischeff, J. Liigand, R. Rebane, A systematic approach toward comparing electrospray ionization efficiencies of derivatized and non-derivatized
amino acids and biogenic amines, J. Mass Spectrom. 53 (2018) 997–1004
doi:10.1002/jms.4272.
P.J. Currie, N. Chang, S. Luo, G.H. Anderson, Microdialysis as a tool to measure dietary and regional effects on the complete profile of extracellular
amino acids in the hypothalamus of rats, Life Sci. 57 (1995) 1911–1923
doi:10.1016/0024- 3205(95)02178- L.
L. Hillered, A. Hallstrom, S. Segersvard, L. Persson, U. Ungerstedt, Dynamics of
extracellular metabolites in the striatum after middle cerebral artery occlusion
in the rat monitored by intracerebral microdialysis, J. Cereb. Blood Flow Metab.
9 (1989) 607–616 doi:10.1038/jcbfm.1989.87.
P.J. Hutchinson, M.T. O’Connell, P.G. Al-Rawi, C.R. Kett-White, A.K. Gupta,
L.B. Maskell, J.D. Pickard, P.J. Kirkpatrick, Increases in GABA concentrations during cerebral ischaemia: a microdialysis study of extracellular amino acids, J.
Neurol. Neurosurg. Psychiatry. 72 (2002) 99–105 doi:10.1136/
jnnp.72.1.99.
C. Defaix, A. Solgadi, T.H. Pham, A.M. Gardier, P. Chaminade, L. Tritschler, Rapid
analysis of glutamate, glutamine and GABA in mice frontal cortex microdialysis samples using HPLC coupled to electrospray tandem mass spectrometry,
J. Pharm. Biomed. Anal. 152 (2018) 31–38 doi:10.1016/j.jpba.
2018.01.039.
F. Mora, A. Porras, Effects of amphetamine on the release of excitatory amino
acid neurotransmitters in the basal ganglia of the conscious rat, Can. J. Physiol.
Pharmacol. 71 (1993) 348–351 doi:10.1139/y93-054.
S. Rahman, M.T. Bardo, Environmental enrichment increases amphetamineinduced glutamate neurotransmission in the nucleus accumbens: a neurochemical study, Brain Res. 1197 (2008) 40–46 doi:10.1016/j.
brainres.2007.12.052.
E. Anderzhanova, K.S. Rayevsky, P. Saransaari, E. Riitamaa, S.S. Oja, Effects of
sydnocarb and D-amphetamine on the extracellular levels of amino acids in
the rat caudate-putamen, Eur. J. Pharmacol. 428 (2001) 87–95 />doi:10.1016/S0014-2999(01)01285-7.
C.J. Xue, J.P. Ng, Y. Li, M.E. Wolf, Acute and repeated systemic amphetamine
administration: effects on extracellular glutamate, aspartate, and serine levels
in rat ventral tegmental area and nucleus accumbens, J. Neurochem. 67 (1996)
352–363 doi:10.1046/j.1471-4159.1996.67010352.x.
M. Miele, M.A. Mura, P. Enrico, G. Esposito, P.A. Serra, R. Migheli, D. Zangani, E. Miele, M.S. Desole, On the mechanism of d-amphetamine-induced
changes in glutamate, ascorbic acid and uric acid release in the striatum
of freely moving rats, Br. J. Pharmacol. 129 (20 0 0) 582–588 />doi:10.1038/sj.bjp.0703066.
J. Heininen, U. Julku, T. Myöhänen et al.
Journal of Chromatography A 1656 (2021) 462537
[46] S.S. Valvassori, K.V Calixto, J. Budni, W.R. Resende, R.B. Varela, K.V. de Freitas, C.L. Goncalves, E.L. Streck, J. Quevedo, Sodium butyrate reverses the
inhibition of Krebs cycle enzymes induced by amphetamine in the rat
brain, J. Neural Transm. 120 (2013) 1737–1742 doi:10.1007/
s00702- 013- 1056- 3.
[47] A.S. Kristensen, J. Andersen, T.N. Jorgensen, L. Sorensen, J. Eriksen, C.J. Loland,
K. Stromgaard, U. Gether, SLC6 neurotransmitter transporters: structure, function, and regulation, Pharmacol. Rev. 63 (2011) 585–640 />doi:10.1124/pr.108.0 0 0869.
[48] H. Wilson, G. Dervenoulas, G. Pagano, C. Koros, T. Yousaf, M. Picillo, S. Polychronis, A. Simitsi, B. Giordano, Z. Chappell, B. Corcoran, M. Stamelou,
R.N. Gunn, M.T. Pellecchia, E.A. Rabiner, P. Barone, L. Stefanis, M. Politis, Serotonergic pathology and disease burden in the premotor and motor phase of
A53T α -synuclein parkinsonism: a cross-sectional study, Lancet Neurol. 18
(2019) 748–759 doi:10.1016/S1474-4422(19)30140-1.
[49] J. Swant, J.S. Goodwin, A. North, A.A. Ali, J. Gamble-George, S. Chirwa,
H. Khoshbouei, A-Synuclein stimulates a dopamine transporter-dependent
chloride current and modulates the activity of the transporter, J. Biol. Chem.
286 (2011) 43933–43943 doi:10.1074/jbc.M111.241232.
10