A regressive approach to the design of continuous capture process with multi-column chromatography for monoclonal antibodies
Bạn đang xem bản rút gọn của tài liệu. Xem và tải ngay bản đầy đủ của tài liệu tại đây (2.5 MB, 11 trang )
Journal of Chromatography A 1658 (2021) 462604
Contents lists available at ScienceDirect
Journal of Chromatography A
journal homepage: www.elsevier.com/locate/chroma
A regressive approach to the design of continuous capture process
with multi-column chromatography for monoclonal antibodies
Chyi-Shin Chen a,b, Fuminori Konoike a,b, Noriko Yoshimoto a,b,c, Shuichi Yamamoto a,b,c,∗
a
Graduate School of Science and Technology for Innovation, Yamaguchi University, Ube,755-8611 Japan
Manufacturing Technology Association of Biologics, Shin-kawa, Chuo-ku, Tokyo, 104-0033, Japan
c
Biomedical Engineering Center (YUBEC), Yamaguchi University, Ube, 755-8611, Japan
b
a r t i c l e
i n f o
Article history:
Received 19 June 2021
Revised 20 September 2021
Accepted 2 October 2021
Available online 8 October 2021
Keywords:
Continuous chromatography
Monoclonal antibody
Periodic counter-current chromatography
Process development
Protein A
a b s t r a c t
Although empirical methods have been introduced in the process development of continuous chromatography, the common approach to optimize a multi-column continuous capture chromatography (periodic
counter-current chromatography, PCCC) process heavily relies on numerical model simulations and the
number of experiments. In addition, different multi-column settings in PCCC add more design variables
in process development. In this study, we have developed a rational method for designing PCCC processes based on iterative calculations by mechanistic model-based simulations. Breakthrough curves of a
monoclonal antibody were measured at different residence times for three protein A resins of different
particle sizes and capacities to obtain the parameters needed for the simulation. Numerical calculations
were performed for the protein sample concentration in the range of 1.5 to 4 g/L. Regression curves were
developed to describe the relative process performances compared with batch operation, including the
resin capacity utilization and the buffer consumption. Another linear correlation was established between
breakthrough cut-off (BT%) and a modified group composed of residence time, mass transfer coefficient,
and particle size. By normalizing BT% with binding capacity and switching time, the linear regression
curves were established for the three protein A resins, which are useful for the design and optimization
of PCCC to reduce the process development time.
© 2022 The Authors. Published by Elsevier B.V.
This is an open access article under the CC BY license ( />
1. Introduction
Compared to the traditional batch chromatography in the
downstream process of manufacturing monoclonal antibodies
(mAbs), continuous chromatography for the capture process aims
to reduce the production cost by decreasing the amount of column
medium and buffer required, and shortening process time. In a periodic counter-current chromatography (PCCC), multiple columns
are switched in between loading step, post-load wash (PLW) step,
and turnaround steps including wash, elution, clean-in-place (CIP),
and equilibration. Two columns are connected in series for loading
while the other column(s) undergoes turnaround cycles. The connected tandem columns can thus capture additional product breakthrough compared to a single column. In order to accomplish the
continuous sample feed, the time for non-loading operation needs
to be equal or shorter than the loading time. To prevent product
loss from the outlet column, the loading needs to be controlled
in a threshold range, which is generally defined as 1 – 3 % break-
∗
Corresponding author.
E-mail address: (S. Yamamoto).
through (BT%) from the outlet column or the corresponded % in the
dynamic binding capacity (DBC) [1,2]. Theoretically, the utilization
of column capacity can be increased by PCCC operation compared
to a batch process at the same productivity, and the material cost
can be cut down because of the buffer consumption reduction [3–
5].
Commercial apparatus for PCCC with 2 to 16 columns are already available. The control system for column switching in PCCC
can be categorized as static control and dynamic control. Static
control switches columns at a fixed time duration, while dynamic
control switches columns when a trigger signal is received from an
in-line UV detector. As the column performance degradation or the
variation of the sample feed concentration with time is not considered in static control, dynamic control can better maintain a stable performance if the monitoring is precise and reliable. Although
the hardware is well constructed and ready for continuous operation, the process parameters including column switching time and
the flow rate corresponding to the feed concentration and desired
performances are difficult to obtain without pre-knowledge of the
columns, feed materials, adsorption isotherms and mass transfer
mechanism.
/>0021-9673/© 2022 The Authors. Published by Elsevier B.V. This is an open access article under the CC BY license ( />
C.-S. Chen, F. Konoike, N. Yoshimoto et al.
Journal of Chromatography A 1658 (2021) 462604
Many studies have been published for the methodology in modeling and simulation of PCCC in different column settings, including the schematic design and loading strategy [2,6–8]. Generally,
the design of the model-based PCCC approaches includes the adsorption isotherm of mAb for protein A chromatography columns
related to the binding capacity, and the mass transfer kinetics
dominated by the (intraparticle) pore diffusion. Although analytical solutions such as constant pattern approximation (CPA) can be
used in batch loading [9,10], numerical calculation is more widely
adopted as the limitation of continuous flow in PCCC requires more
process parameters to be synchronized. The modeling of PCCC requires the knowledge of the adsorption, mass transfer, and the optimal loading threshold, which can be determined by iterations of
the numerical calculation. However, the numerical solution is necessary every time when there are changes in the column or the
feed. The number of columns in PCCC will also affect the switching
condition. The cost in development in a continuous multi-column
chromatography process is thus higher than a batch operation [11].
In this study, we aim to develop a rational method to assess the
column switching threshold in PCCC. Three commercially available
protein A media were used. By simulating the loading profile in
PCCC using mechanistic models, the operation conditions with the
maximum productivity can be obtained. Series of experiments in
2 column (2C) - PCCC and 4 column (4C) - PCCC under different
columns and concentrations were conducted for verification. The
process performances including productivity (P), resin utilization,
and buffer consumption were also examined for each PCCC process. Based on the simulations, the effects of feed concentration
and resin particle size to the loading cut-off BT% were investigated.
The results were used to develop a linear relationship between BT%
and new groups including particle size and mass transfer coefficients in PCCC processes, which can be used to determine the BT%
threshold.
IV Loading step: The sample feed is loaded to the (re-connected)
tandem column at Fv1 for the duration t2C .
The steady state PCCC cycle is composed of step (Ⅱ) to step (Ⅳ).
The general assumptions for each PCCC calculation in this study
include (a) constant amount of loading for every cycle, (b) PLW,
(c) identical columns in multi-column settings, (c) 100% recovery
during elution, and (e) no degradation or fouling in the column
and the sample. The schematic diagram of a 2C-PCCC process can
be shown as Fig. 1(A).
The design variables in a 2C-PCCC process in this study include
the time duration at each step (tnonload , tPLW , and t2Cload ), BT% at
the switching point, and flow rates Fv1 and Fv2 . The non-loading
protocol and initial loading flow rate are pre-defined, and BT% at
switching point and Fv2 are calculated by satisfying the constraints
in the PCCC setup. The calculation results for BT% and Fv2 are
aimed to achieve the highest productivity while maintaining less
than BT1% (C/C0 <0.01) from the column outlet.
During the step I, BT%1C,max can be calculated by DBC1% at Fv1 .
A BT% smaller than BT%1C,max is then assigned, and the total mass
during loading (Mtot ) and the accumulated mass (Maccu ) in the second column can be calculated as
Mtot = Fv1 t1C0 < DBC1%,Fv1 (2Vt )
(1)
where t1 is the start-up time.
Maccu = Ac
2Z
Z
[εC + (1 − ε )Cs ]dz =
VB
0
C (V )dV
(2)
C is the concentration in the mobile phase, Cs is the concentration
in the stationary phase, and z is the distance from the column inlet. Maccu can be also calculated by integrating the concentration
of the breakthrough curve (BTC) of the single column, C(V) from V
= 0 to VB = Fv1 t1 (breakthrough volume at the BT% assigned).
During PLW, the washed amount from the first column is assumed as one column volume material , which is defined as
MPLW = C0 Vt . As long as Eq. (3) is satisfied, the total loss is controlled below BT1%.
2. Theory
2.1. 2-column PCCC
Maccu + MPLW ≤ DBC1%,Fv1 Vt
For a 2 column-PCCC (2C-PCCC), two columns of the column
cross sectional area, Ac (= π /4•dcol 2 ) and the column bed height,
Z are used (the column diameter dcol , the column bed volume Vt
=Ac Z and the column void volume Vo = ε Vt where ε is the void
fraction). The loading can be kept continuous except at the PLW
step, which flushes the sample in the mobile phase in the first column to the second column to prevent the loss of the sample. To
satisfy the constraint that non-stop loading should be kept while
the other column is at non-loading operations (wash, CIP, and reequilibration), the loading flow rates in the tandem-column phase
(Fv1 ) and in the single column phase (Fv2 ) can be different. By using a lower Fv2 for the single column, the DBC (= C0 VB /Vt , where
C0 is the sample feed concentration and VB is the breakthrough
volume) can be increased [12–14]. It can also prevent the possible leakage from the column when the other column is undergoing non-loading operations. As a result, the continuous loading is
possible when its duration is matched to the required non-loading
time.
To better illustrate a 2C-PCCC, the operation can be divided to
the following four steps.
(3)
The tnonload is the time needed for the non-loading steps, and
is equal to the loading time for the second column at Fv = Fv2 . As
shown in Fig. 1 (A), the sum of the loading at Fv2 (MF v2 ) and the
accumulation should be below the BT1% point at Fv2 , which can be
presented as
MFv2 = Fv2 tnonloadC0 ≤ DBC1%,Fv2 Vt − MPLW − Maccu
(4)
where 0 < Fv2 ≤ Fv1 , so the loading can be continuous with leakage less than BT1% within the period of tnonload . It should be noted
that the limit of the loading capacity changed to DBC1% at Fv = Fv2
instead of Fv = Fv1 at this step.
Finally, the duration of t2Cload can be calculated as
t2Cload =
Mtot − Maccu − MPLW − MFv2
C0 Fv1
(5)
The column switching time (tswitch ) is thus given by
tswitch = t2Cload + tPLW + tnonload = tC /2 = tC /Ncol
(6)
where tC is the duration of a complete cycle and Ncol is the number
of the columns.
Process performance for a 2C-PCCC is defined as shown in Eqs.
(7) - (9).
I Starting step: The loading to the connected columns (tandem
column) starts at Fv1 and ends at t = t1 .
II PLW (post-load wash) step: The wash buffer is fed to the
tandem-column.
III Non-loading step (turnaround steps): While the first column is
at the non-loading steps, the sample feed is loaded to the other
column at Fv2 .
P=
Mtot − Maccu
2Vt tswitch
RU =
2
Mtot − Maccu
Mtot − Maccu
=
Q (1 − ε )Vt
(SBC )Vt
(7)
(8)
C.-S. Chen, F. Konoike, N. Yoshimoto et al.
Journal of Chromatography A 1658 (2021) 462604
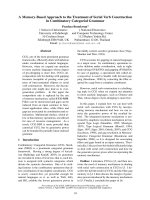
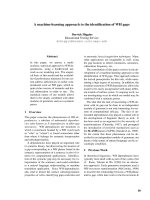
Fig. 1. Schematic illustration of (A) full process from start to cycling phase in 2C-PCCC.
Time for each step is labeled in the left with subscripted labels (including PLW, non-loading, and 2C-connected phase), and the loading flow rate is written as Fv1 and Fv2
in each step. (B) 3C-PCCC from starting phase (t1 as duration) followed by one non-loading operation (including PLW and 2C-connected phases). (C) 4C-PCCC. Loading to
the two connected columns can be completed respectively in tnonload with each loading duration up to tPLW + t2Cload. Color layers represent the loading amount at different
stages. All loading profiles are theoretical representatives.
BF =
VNL
(VNL /Vt )
=
Mtot − Maccu
RU(SBC )
loading operation. When the same non-loading protocol is employed, one column is used for the non-loading operations in 3CPCCC whereas two columns are used sequentially in 4C-PCCC. As
the duration of the non-loading protocol is shared by the two
columns, it becomes 2 times shorter compared to 3C-PCCC as illustrated by Fig. 1 (B)-(C). As Eq. (10) is the main constraint in PCCC,
a shorter turnaround time can allow a faster flow rate in the 4CPCCC compared to the 3C-PCCC. It can also provide more flexibility
for a process having a feed in a higher titer or a lengthy cleaning
procedure (long non-loading time, tnonload ).
Compared to the 2C-PCCC, the number of design variables is
less because of the constant flow rate in loading, which is determined by the DBC1% at Fv . When a desired Fv (or residence time,
RT) is selected, BT% for column switching becomes the only factor
that needs to be obtained.
The processes shown in Fig. 1 (B)-(C) can be broken down to
the starting step, the PLW step, and the non-loading step. For the
starting step Mtot is given by Eq. (11), which is similar to Eq. (1).
(9)
where P, RU, and BF represent productivity, resin utilization, and
buffer consumption respectively. Q is the saturated (maximum)
protein capacity of resin, SBC is the static binding capacity, and VNL
is the total volume of buffer in the non-loading operation. Since
(VNL /Vt ) and (SBC) are fixed for the operation, BF is inversely proportional to RU. Namely, BF and RU provide the same information.
2.2. 3-column and 4-column continuous chromatography
Since the column(s) is available during PLW step for 3C- and
4C-PCCC settings, loading can be completely continuous as shown
in Fig. 1 (B) – (C). In a complete cycle, the majority of the time is
used for the loading to the tandem column. The loading to the single column is carried out only during the PLW step. Since the duration of PLW is short compared to the overall cycle time in most
cases, loading flow rate can be kept constant for 3C- and 4C-PCCC
even at the single column loading step as long as Eq. (10) is satisfied. Only when a column completes CIP and re-equilibrium before the loading to the connected columns reaches BT1%, it can be
redirected to the tandem columns and let the primary one to be
disconnected.
tload = tPLW + t2Cload = tswitch ≥
tnonload
Ncol − 2
Mtot = Fv t1C0 ≤ DBC1%,Fv (2Vt )
(11)
The accumulated amount in the second column Maccu can be
calculated by Eq. (2). Considering the single column loading in PLW
step, the inequality relation for the PLW step is given by Eq. (12),
which is similar to Eq. (3). Similar to 2C-PCCC, MPLW = C0 Vt is captured by the second column.
(10)
MPLW + Maccu ≤ DBC1%,Fv Vt
Here, tload is the sum of the loading time for the connected
columns (tandem column) and that for the single column. Note
that tC = tswitch Ncol
Although both 3C- and 4C-PCCC use the tandem column for the
loading, the difference lies in the number of columns for the non-
(12)
To guarantee that loss will not be over BT1% throughout the
process, the loading amount to the single column after PLW,
MSL = Fv t2Cload C0 should be given by Eq. (13). By having the
same criteria for every column switching, loss below BT1% can be
3
C.-S. Chen, F. Konoike, N. Yoshimoto et al.
Journal of Chromatography A 1658 (2021) 462604
MiniChrom columns packed with KC3 (0.8 cm i.d. × 2 cm) supplied from Repligen (Waltham, MA) and self-packed to empty plastic columns (0.7 cm i.d. × 2.5 cm) were used for KC3. AA3 was
self-packed to Cytiva Tricorn empty columns (0.5 cm i.d. × 5 cm).
Breakthrough curves (BTCs) were measured by ÄKTA pure,
ÄKTA pcc (Cytiva), and Contichrom CUBE HPLC 30 system (YMC,
Kyoto, Japan), and were used for inverse fitting of isotherm parameters and lumped mass transfer coefficients by ChromWorks
(Ypso Facto, Nancy, France). Experiments were carried out at different concentrations and flow rates until BT% over 70% was reached.
Details of the column geometry and experimental condition are
shown in Table 1.
2C-PCCC experiments were performed on the Contichrom system with the process parameters provided by the embedded software. The column switching was controlled by fixed time.
4C-PCCC experiments were carried out on the ÄKTA pcc system.
Dynamic control was enabled for column switching.
20 mM phosphate with 150 mM NaCl at pH 7.2 was used for
equilibration and wash operation. 100 mM acetic acid at pH 3.2
was used as elution buffer, and 0.1 M NaOH was used for CIP. Nonloading protocols were described in Supplementary Material Part
2.
achieved.
MSL = Mtot − Maccu − MPLW
(13)
PCCC simulations can be carried out by using mechanistic models described in section 2.3. Then, the process performance can be
calculated by Eqs. (7) - (9). Productivity can also be estimated by
Eq. (14) for 3C- and 4C-PCCC.
P=
FvC0
NcolVt
(14)
2.3. Mechanistic models
The linear driving force equation for the mass transfer along
with the axial dispersion in the mobile phase was used as a
lumped rate model because of its simplicity for faster calculating
speed in PCCC. The equation for the mobile phase is given by
∂C
∂ Cs
∂ 2C
∂C
+H
= DL 2 − u
∂t
∂t
∂z
∂z
(15)
where u = Fv /(ε Ac ) is the mobile phase velocity, H = (1−ε )/ε is
the column phase ratio, DL is the axial dispersion coefficient and
Cs is the average concentration of protein in the stationary phase.
For protein A chromatography, the Langmuir isotherms are
widely used, which can be inserted into the linear driving force
approximation expressed by Eq. (16).
dC s
Q KLC
= Ks (Cs ,i − C s ) = Ks (
− Cs )
dt
1 + KLC
3.2. Simulation platform
ChromWorks served as a tool for fitting the Langmuir isotherm
parameters and mass transfer coefficients from experimental BTCs.
R (Open source software) was used for the calculation of column
switching time and related process performances such as productivity, resin utilization, and buffer consumption rate in PCCC. The
details of the models and the calculations are described in Supplementary Material Part 1.
Model-based approach was adopted for process optimization in
a single column batch chromatography as well as PCCC, which
requires the two mass transfer parameters, Ks and DL , and the
two Langmuir isotherm parameters, Q and KL . Ks values were determined by fitting the experimental BTCs with the numerical
simulation or with the constant pattern approximation given by
Eqs. (17) – (19) [10]. DL was assumed to be 4 times the product
of dp and u [15–18].
R has several packages that can solve PDEs such as ReacTran,
deSolve, and rootSolve [20,21]. ReacTran has a function of finite
difference approximations of the general diffusive-advective transport equation, which is in the form as
(16)
where Cs,i is the surface (interface) concentration of protein in the
stationary phase, KL is the Langmuir constant, Q is the maximum
concentration, and Ks is the lumped mass transfer coefficient.
The constant pattern approximation (CPA) solution for the
Langmuir isotherm is given by Eqs. (17)-(19) [10].
Req ln X − ln (1 − X ) − (1 − Req )
(tu/Z ) − 1
= Ks H K0 (Z/u )
−1
1 − Req
H K0
(17)
Req = 1/(1 + KLC0 )
Ks =
60εp ψp Dp
0.775
where ψp =
K0 dp2
1 − 0.225Req 0.5
(18)
(19)
∂C
∂C
∂ 2C
= −u
+ DL 2 + f (t, z, C )
∂t
∂z
∂z
Here Req is the separation factor, X = C/C0 , K0 = Cs0 /C0 , Cs0 is
Cs at C = C0 , ε p is the particle porosity, ψ p is the correction factor,
Dp is the stationary phase (pore) diffusion coefficient, and dp is the
particle diameter.
(20)
Equation (20) can be used as the model equation by
Eq. (15) and (16) provided that the source term f (t, z, C) can
be regarded as the linear driving force Eq. (16). The appropriate
boundary conditions were employed for the numerical calculations
of Eq. (20). The validity of the calculation method was confirmed
through good agreements between the calculated BTCs by R and
those by ChromWorks.
The optimization for PCCC was performed with restrictions of
loss below BT1% and Eq. (10) using self-programmed code with
Reactran package in R [22]. Different residence times and concentrations were examined for the optimal switching BT% by iterations
for the highest productivity P and resin utilization RU as given by
3. Materials and Methods
3.1. Multi-column chromatography (PCCC)
Clarified supernatant containing monoclonal IgG (mAb) from
fermentation of Chinese hamster ovary cell culture was used as
feed material. Purified mAb from the clarified supernatant of various concentrations were used for measuring the breakthrough
curves.
The following three protein A gels (resins or media) of different particle diameter dp were used in this study: MabSelect SuRe
(MSS) (dp = 85 μm) from Cytiva (Uppsala, Sweden), KanCapA 3G
(KC3) (dp = 75 μm) from Kaneka (Osaka, Japan) and Amsphere
A3 (AA3) (dp = 50 μm) from JSR (Tokyo, Japan). Prepacked HiTrap columns (0.7 cm i.d. × 2.5 cm) were used for MSS. OPUS
arg max{P (BT% ), RU(BT% )}
(21)
BT%
Buffer consumption BF values were calculated with the corresponded BT%. The range of residence time was chosen below
the maximum flow rate from the Carman-Kozeny equation, where
0.2 MPa was set for the maximum process pressure. Loading flow
rate (Fv ) was kept constant in single batch, 3C-PCCC, and 4C-PCCC,
4
C.-S. Chen, F. Konoike, N. Yoshimoto et al.
Journal of Chromatography A 1658 (2021) 462604
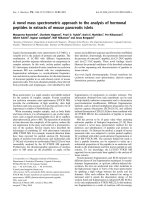
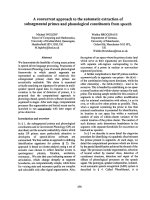
Fig. 2. Breakthrough curves from experimental data (symbols) and simulation (lines) from ChromWorks or the constant pattern approximation CPA (only in (B)) of (A) – (B)
MSS, (C) – (D) AA3, (E) – (F) KC3. The details of calculation by ChromWorks are shown in Supplementary Part 4.
simulation at short RT such as RT = 1 min, such low DBC values
were not used in our PCCC simulation system since they did not
meet the requirement given by Eqs. (3), (4), (11) and (12).
while it was changed in the tandem (connected) column (Fv1 ) and
the single column step (Fv2 ) in 2C-PCCC to reach maximum productivity. PLW is included in the non-loading protocols in 2C-, 3C-,
and 4C-PCCC.
4.2. Process simulation
4. Results
The simulation of batch and PCCC was carried out. Validation
was performed by comparing the PCCC experiments with the simulation results. A wide range of process conditions was examined
including the feed concentration (2 – 3.5 g/L of IgG) in either
4C-PCCC or 2C-PCCC settings. Details of the experiments and the
resulted switching time (tswitch ) along with productivity are presented in Table 1. The non-loading protocol was different from
resin to resin in 4C-PCCC. A lower feed concentration was applied
in 2C-PCCC.
All 4C-PCCC experiments were performed first with BT% fixed
at 25% or 30%. By applying the condition to our model with corresponding non-loading protocol, switching time can be obtained
by the method described in section 2. Dynamic control was employed for 4C-PCCC. The difference between estimated switching
time and actual switching time by UV is less than 6% as shown in
Table 1. The experimental P values were lower than the simulation
values as the time for start-up and end sequences were not con-
4.1. Breakthrough curves
Breakthrough curves (BTCs) for MSS were well fitted by the numerical solutions using ChromWorks as shown in Fig. 2 (A). The
constant pattern approximation (CPA) was also able to fit the BTCs
as shown in Fig. 2 (B) with the same Ks value. The constant pattern approximation was used for the estimation of Ks at different
C0 in later simulations.
BTCs with AA3 and KC3 are shown in Fig. 2 (C) and (D), respectively. As AA3 has smaller dp (50 μm) compared to MSS (85 μm),
the lower mass transfer resistance was reflected on the larger Ks
values (0.0015 – 0.0025 s−1 ). As dp of KC3 (75 μm) is in between
AA3 and MSS, the fitted Ks is among the two (Ks = 0.001 - 0.002
s−1 ).
It should be noted that although DBCs simulated by the simple
Langmuir isotherm model are lower than the values by the exact
5
C.-S. Chen, F. Konoike, N. Yoshimoto et al.
Journal of Chromatography A 1658 (2021) 462604
Table 1
PCCC experiments conducted for 4C-PCCCa and 2C-PCCCb at RT 2 min. Relative errors in parentheses were
calculated by comparing simulation (Sim) with experimental results (Exp).
Column
Ncol (dimension)
4
4
4
4
2
a
b
c
d
e
MSS (0.7 cm id × 2.5 cm)
AA3 (0.5 cm id × 5 cm)
AA3 (0.5 cm id × 5 cm)
KC3 (0.7 cm id × 2.5 cm)
KC3 (0.8 cm id × 2 cm)
C0
(g/L)
3.5
3.5
3.5
3.5
2
tnonload
(min) BT%
38
49
11.5
38
39
25
30
30
25
30
Exp
26
35
34
33
76.2
27 (+3.8%)
33 (-5.7%)
33 (-2.9%)
32 (-3.0%)
74.8 (-1.9%)
Sim
d
23.8
24.1d
25.7d
24.9d
20.3e
26 (+9.2%)
26 (+7.9%)
26 (+1.2%)
26 (+4.4%)
20.3 (0%)
1.3- to 2.5-fold compared to batch mode for AA3 and MSS respectively. The buffer volume can be reduced by 20% to 60% for low C0 ,
while the difference between PCCC and batch operation reduces if
C0 goes higher. The overall trend of BF∗ increases as C0 increases,
while RU∗ decreases over P as shown from the slopes. In the case
of KC3 shown in Fig. 4 (E) – (F), the reduction of buffer can be
over 70% when C0 < 1.5 g/L. Even when C0 = 4 g/L, 40% reduction
in buffer consumption can still be achieved. The resin utilization is
increased by a factor of 2 to 3.
Although high concentration leads to higher productivity, the
trade-off in RU and BF should be considered by examining the RU∗
and BF∗ vs. P curves. When BF∗ < 1 or RU∗ > 1, it is more beneficial to use PCCC. Instead of conducting numerous experiments
or simulations for several C0 values every time, the RU∗ and BF∗
vs. P may be developed with just the extremum of C0 as high linearity exists (R2 > 0.9) based on the results in Fig. 4. The trends
shown in Fig. 4 indicate that at lower C0 , PCCC has more advantages in buffer consumption and resin utilization compared to the
batch operation. It is also shown that PCCC is more beneficial when
mass transfer rates are low such as large particles. In the ideal case
where the diffusion mass transfer is very fast, the performance difference between PCCC and batch operation will disappear.
4.3. Process efficiency
Since the feed concentration C0 influences the shape of BTC
heavily, it also affects the process parameters in PCCC. The product
titer from upstream is increasing with the improvement in fermentation technology for mAbs [23–25], which makes the capability to
process high C0 essential in the downstream process.
The maximum P for 2C-PCCC with MSS, AA3 and KC3 were obtained by the simulation. The C0 from 1.5 to 4 g/L were examined
as the average titer for mAb products is expected to be above 3 g/L
with recent industrial standard [25]. Corresponded process performances were calculated based on the loading results derived from
R, and the process parameters were listed in Supplementary Material Table S3.
To further evaluate the benefit of PCCC compared with the
batch chromatography, the two process evaluation parameters
were introduced; relative buffer consumption (BF∗ ) and relative
resin utilization (RU∗ ). They were defined as the ratio of the performance in PCCC over batch at the same productivity by Eq. (22).
Fig. 3 shows BF and RU as a function of P for 2C-PCCC and a batch
repeated cyclic operation (RCO). By comparing the results between
PCCC and RCO, the relative process performances can be calculated.
Lower BF∗ (< 1.0) and higher RU∗ (> 1.0) imply the superiority of
PCCC.
4.4. Determination of breakthrough threshold in PCCC
We have already shown that the DBC normalized by the SBC,
E∗ = DBC/SBC is a linear function of the dimensionless group
F∗ = dp 2 /[Ds (Z/u)] [16,19,26].
E∗ =
DBC
= f (F ∗ ) = f
SBC
2
dp
Ds (Z/u )
(23)
where Ds is the stationary phase (pore) diffusivity. The E∗ - F∗ linear relationship was used in batch operation with DBC10% or DBC1%
[26]. However, as the switching BT% in PCCC is influenced by other
factors such as the number of columns and the non-loading protocols, the application of Eq. (23) to PCCC is not straightforward.
The important parameter for PCCC, BT%, changes with the loading flow rate. Although automatic iterations can be used to find
the optimal BT%, calculation time heavily depends on the computation power and algorithms applied. To improve the process development speed and the accessibility for general users of PCCC,
we examined the simulation data for different protein A media including MSS, AA3, and KC3 with the same non-loading protocol
(Supplementary Material Table S2) at different C0 to find a good
correlation for BT%.
As the switching BT% in PCCC over different RTs is not a constant DBCx% , BT% was normalized as BT%norm with SBC and tswitch .
After replacing Ds /dp 2 with dp 2 Ks /60, the following relationship
BF ∗ = BFPCCC /BFbatch
RU∗
Productivity (g/L/hr)
Sim
10 cycles performed
2 cycles performed
Averaged values from cycles
Overall productivity (start-up time and end time included)
Calculated values from Contichrom software.
sidered in the simulation. Since extra holding time will be needed
from the start to the end with additional line-wash step employed
in the PCCC apparatus, slight deviation exists between the overall
productivity and the estimated productivity from Eq. (14). Nevertheless, the results show that our model can simulate the concentration profiles in the columns in PCCC, and can be used to derive
the critical operation parameter, tswitch accurately with errors below 6%. The model can be applied to different process conditions
such as Ncol and non-loading protocol.
RU ∗ = RUPCCC /RUbatch
tswitch (min)
Expc
(22)
BF∗
Fig. 4 shows
and
vs. P curves as a function of C0 for
2C-PCCC. Each curve has a parabolic to polynomial profile with
an optimal point, the lowest BF∗ or the highest RU∗ . The minimum/maximum values were not clearly shown at high C0 for MSS
and KC3 as the loading amount due to low DBC is so small that the
short loading time cannot improve the productivity anymore. By
using the same non-loading protocols for all three resins, the highest RU∗ or the lowest BF∗ values can be linearly correlated with P
as shown in Fig. 4. Note that (BF∗ × RU∗ ) calculated by the correlation equations are constant, which can be easily understood by
Eqs. (8) and (9). From these correlations, the effect of C0 can be understood. For instance, the resin utilization can be improved up to
6
C.-S. Chen, F. Konoike, N. Yoshimoto et al.
Journal of Chromatography A 1658 (2021) 462604
Fig. 3. The process performances including RU (open symbols) and BF (filled symbols) over P from AA3 at C0 = 2 g/L of 2C-PCCC (circle) and batch RCO (square). The
following non-loading protocol was used. 1) equilibration 3CV, RT= 1 min 2) PLW 2CV, RT= 0.5 min, 3) Wash 2CV, RT= 0.5 min, 4) Elution 4CV, RT= 0.5 min, 5) CIP 3CV,
RT= 1min
Fig. 4. RU∗ and BF∗ vs. P. (A) – (B) MSS, (C) – (D) AA3 and (E) – (F) KC3. Comparison was made between values from 2C-PCCC and batch processes. Regression curves were
developed among the optimal points (filled or bold) with the highest RU∗ or lowest BF∗ from each concentration. The mass transfer coefficients used are shown in Table S3.
7
C.-S. Chen, F. Konoike, N. Yoshimoto et al.
Journal of Chromatography A 1658 (2021) 462604
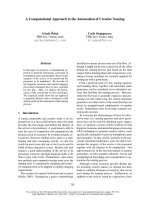
Fig. 5. Plots of BT%norm (y-axis) over the new functional group F’ (x-axis) from three protein A media. (A), (C), and (E) are for different column PCCC settings and feed
concentration as marked. The scatter plots of switching time over RT from the same dataset are illustrated in (B), (D), and (F) with the same order. The linear correlation of
BT%norm and F’ are labeled with regression coefficient R2 . The mass transfer coefficients used for the simulation are labeled for each resin.
RT 2 min are presented in Table 2. The differences of BT% between
the linear regression and iterative results from numerical solutions
are within 10%. As the calculation time of iterations usually takes
up from minutes to hours (depending on the scanning area), the
linear regression can reduce significant calculation resources and
provide the comparable results. The schematic illustration for the
determination method of BT% is presented in Fig. 6. Although the
example was for 3C-PCCC settings, 4C-PCCC will have the same
trend since tswitch and BT% will not change with the number of
columns, only productivity and performance have dependency on
column numbers when we compare 3C-PCCC with 4C-PCCC.
The linear relationship still holds for C0 = 2 g/L with the same
resins and the non-loading protocol as shown in Fig. 5 (C) with
R2 = 0.98 and similar performance between BT%reg and BT%sim . The
slope of BT%norm and F’ becomes steeper for higher feed concentration, which matched to the BTCs (Fig. 2). Higher C0 leads to steeper
BTCs and shorter VB,1% and makes the switch time shorter, which
is reflected in Fig. 5 (D).
can be derived between the normalized BT% and a new modified
group (F’)
BT%norm =
BT%
(SBC )tswitch
= f(
60
ε (RT )Ks dp 2
) = f (F )
(24)
In an example using 3.5 g/L of IgG as feed for the three different
resins in a 3C-PCCC setting, results from Eq. (24) is shown in Fig. 5
(A) – (B).
A linear relation of BT%norm and F’ was observed for the three
different media with R2 = 0.97. The points that diverged out from
the linear regression are the extreme values at the lowest RT in
3C-PCCC. Since higher RT is usually adopted in actual processes,
the outliers in Fig. 5 (A) could be possibly excluded from the linear
trend. The switch time can also be expressed as a linear function
of RT as shown in Fig. 5 (B). As a result, the BT% at different conditions can be estimated by the relationship in Eq. (24) once the
regression has been obtained. The comparison of BT% from the regression (BT%reg ) and BT% from numerical simulations (BT%sim ) at
8
C.-S. Chen, F. Konoike, N. Yoshimoto et al.
Journal of Chromatography A 1658 (2021) 462604
Table 2
Comparison of BT% from linear regression and numerical simulation in 3C-PCC at C0 = 3.5 g/L under RT = 2 min.
Resin
SBC (g/L)a
tswitch (min)
F’ (μm−2 )
BT%norm (%Lg−1 min−1 )
BT%reg (%)
BT%sim (%)
Error (%)b
MSS
AA3
KC3
91.00
72.10
109.9
31.82
40.86
38.04
0.14
0.27
0.15
0.021
0.035
0.021
60.28
103.3
87.78
67.28
99.43
83.70
-10.4
3.93
4.87
a
b
Calculated from fitted Q, Vt , and ɛ
(BT%reg − BT%sim )/BT%sim
Fig. 6. Steps for determining BT% for PCC switching from regressions developed in Fig. 5.
In 2C-PCCC, the starting RT cannot represent the whole loading since the flow rates may be different during the single column
loading (Fv2 ) and the tandem column loading (Fv1 ). The tswitch in
Eq. (24) was replaced by t2C , which is the loading time for the tandem column. The modified BT%norm is re-written to Eq. (25).
BT%norm = BT%/SBC/t2C = f (
60
ε (RT )Ks dp 2
) = f (F )
matography [1–8]. However, compared with the standard batch
capture chromatography, choosing the proper operating conditions
and/or column properties is difficult. By replacing experimental
runs with in silico simulations based on mechanistic models, process performances and operation parameters can be determined in
a systematic way.
Design strategies for PCCC processes that match to the current
available PCCC instruments were presented in the study. The methods of modeling and process simulation for repeated cyclic batch
operation (RCO) and PCCC were developed.
Among the process performances, productivity P describes the
amount of product being processed per volume of resin per unit
of time, which can connect to the time needed to process a certain amount of the material. As buffer consumption BF is defined
as per liter of buffer required to process per gram of mAb, it can
be related to buffer cost easily. Resin utilization RU, on the other
hand, expresses the amount of product can be loaded per volume of resin per cycle, which correlates to the cleaning cycles on
the resin affecting its lifetime. As easily shown by Eq. (9), BF is
inversely proportional to RU. While protein A resin is expensive,
higher resin utilization can lead to lower frequency of the replacement of resin hence reducing overall production cost [28–32]. Although PCCC cannot eliminate the tradeoff between P and other
performances, it is possible to achieve better balance in RU or BF
while maintaining the same or higher P compared to batch operation.
Previous studies [5–7] have also shown that P of PCCC is not
higher than that of batch operation whereas BF of PCCC can be reduced at the same P. In this study effect of feed concentration C0 ,
and mass transfer coefficient (particle diameter, dp ) on the relative
productivity and buffer consumption values were shown. Higher C0
and smaller dp resulted in higher P and lower BF, which are simi-
(25)
With the same non-loading protocol, results for BT%norm in
2C-PCCC are shown in Fig. 5 (E). By considering the two flow
rates with t2C , a linear relationship between BT%norm and F’ with
R2 = 0.96 was obtained. The slope was steeper than the one in
3C-PCCC with the same C0 . By reducing Fv2 for loading, DBC increases and elevates the possible loading amount in the column.
Hence, the BT% for column switching can be increased in 2C-PCCC
although t2C in Fig. 5 (F) is similar to tswitch in the 3C-PCCC.
By expressing a normalized BT% as a function of F’, a generalized linear relationship can be acquired across resins in different
particle diameters without dependency on column geometry with
the same non-loading protocol applied. As shown in our previous
study [19], by using such resin properties as particle size, SBC, and
mass transfer coefficient (pore diffusion coefficient), PCCC operating conditions can be easily estimated. The linear relationship can
be constructed under different feed concentrations or the number
of columns in PCCC settings including 2C-, 3C-, and 4C-PCCC.
5. Discussion
In manufacturing of bio-based drugs, continuous integrated
process has become a production strategy enabling agile production of high quality drugs with less regulatory oversight [27, ].
PCCC is a well-established method for continuous capture chro9
C.-S. Chen, F. Konoike, N. Yoshimoto et al.
Journal of Chromatography A 1658 (2021) 462604
lar to the repeated batch cyclic operation (RCO) [19]. However, the
benefit of PCCC over RCO decreases with decreasing dp . In addition, the column back pressure p increases with 1/dp 2 [19]. The
calculations in this study were carried out with the column height
Z = 2 –5 cm. For such short columns, p was below 0.2 MPa at
residence time RT = 1 min even for dp = 50 μm. Process-scale
chromatography column height is longer than 10–15 cm. As p is
over 1 MPa at RT =1 min for Z = 15 cm with dp = 50 μm, longer
RT (lower flow velocity) may be needed to lower p as the process pressure. It is also important to keep in mind that higher P
with small dp results in shorter tC , which in turn requires a larger
number of cycles. Therefore, understanding the fouling mechanism
to develop a proper cleaning protocol or monitoring the fouling
is essential for a stable PCCC operation [33–35]. Although column
fouling is not considered in the present study, it is possible to introduce a safety factor (e.g. 0.9) in the normalized BT% or lower
the BT% from 1% to 0.5 – 0.8% depending on the expected resin
life cycle, and develop the corresponded linear correlation next.
In our 2C-PCCC experiments (five runs), the column performance
did not change after 72 hour operation according to the yield
(>80%) measured by the UV absorbance at 280 nm and the purity (>95%) determined by size exclusion chromatography with a
TSK G30 0 0SWXL HPLC column (data not shown).
Another important point to notice is that the fitting of BTC at
shorter RTs was not good compared with the BTC at longer RTs as
shown in Fig. 2. Therefore, simulated results for high P values in
Fig. 4 are not very precise. However, the trends shown in Fig. 4 do
not change even when somewhat different fitted values from different chromatography models are used. It was not our purpose
to show how to find the optimum conditions. As is clear from
Figs. 3 and 4, BF increases sharply near the maximum P, and hence
it is not beneficial to choose the maximum P conditions.
Acknowledgment
This research was partially supported by AMED under
Grant Number JP20ae0101056, JP20ae0101058, JP21ae0121015, and
JP21ae0121016.
Supplementary materials
Supplementary material associated with this article can be
found, in the online version, at doi:10.1016/j.chroma.2021.462604.
References
[1] V. Warikoo, R. Godawat, K. Brower, S. Jain, D. Cummings, E. Simons, T. Johnson,
J. Walther, M. Yu, B. Wright, J. Mclarty, K.P. Karey, C. Hwang, W. Zhou, F. Riske,
K. Konstantinov, Integrated continuous production of recombinant therapeutic
proteins, Biotechnol. Bioeng. 109 (2012) 3018–3029, doi:10.1002/bit.24584.
[2] M. Angarita, T. Müller-Späth, D. Baur, R. Lievrouw, G. Lissens, M. Morbidelli,
Twin-column CaptureSMB: A novel cyclic process for protein A affinity chromatography, J. Chromatogr. A. 1389 (2015) 85–95, doi:10.1016/j.chroma.2015.
02.046.
[3] O. Ötes, H. Flato, J. Winderl, J. Hubbuch, F. Capito, Feasibility of using continuous chromatography in downstream processing: Comparison of costs and
product quality for a hybrid process vs. a conventional batch process, J.
Biotechnol. 259 (2017) 213–220, doi:10.1016/j.jbiotec.2017.07.001.
[4] J. Pollock, J. Coffman, S.V. Ho, S.S. Farid, Integrated continuous bioprocessing:
Economic, operational, and environmental feasibility for clinical and commercial antibody manufacture, Biotechnol. Prog. 33 (2017) 854–866, doi:10.1002/
btpr.2492.
[5] O. Kaltenbrunner, L. Diaz, X. Hu, M. Shearer, Continuous bind-and-elute protein A capture chromatography: Optimization under process scale column constraints and comparison to batch operation, Biotechnol. Prog. 32 (2016) 938–
948, doi:10.1002/btpr.2291.
[6] D. Baur, M. Angarita, T. Müller-Späth, F. Steinebach, M. Morbidelli, Comparison
of batch and continuous multi-column protein A capture processes by optimal
design, Biotechnol. J. 11 (2016) 920–931, doi:10.1002/biot.201500481.
[7] D. Pfister, L. David, M. Holzer, R.M. Nicoud, Designing affinity chromatographic
processes for the capture of antibodies. Part I: A simplified approach, J. Chromatogr. A. (2017), doi:10.1016/j.chroma.2017.02.070.
[8] R. Godawat, K. Brower, S. Jain, K. Konstantinov, F. Riske, V. Warikoo, Periodic counter-current chromatography - design and operational considerations
for integrated and continuous purification of proteins, Biotechnol. J. 7 (2012)
1496–1508, doi:10.10 02/biot.20120 0 068.
[9] V. Natarajan, A.L. Zydney, Protein a chromatography at high titers, Biotechnol.
Bioeng. 110 (2013) 2445–2451, doi:10.1002/bit.24902.
[10] M. LeVan, G. Carta, Perry’s Chemical Engineers’ Handbook: Adsorption and Ion
Exchange, McGraw-Hill Professional, New York, 2008.
[11] H. Mahal, C. Stamatis, S.S. Farid, Integrated continuous bioprocessing: Costs
of goods versus cost of development, Integrated Continuous Biomanufacturing
IV, Brewster (Cape Cod), Massachusetts, USA, 2019 confintl.org/
biomanufact_iv/82/.
[12] G. Carta, Predicting protein dynamic binding capacity from batch adsorption
tests, Biotechnol. J. 7 (2012) 1216–1220, doi:10.10 02/biot.20120 0136.
[13] S. Ghose, D. Nagrath, B. Hubbard, C. Brooks, S.M. Cramer, Use and Optimization of a Dual-Flowrate Loading Strategy To Maximize Throughput in ProteinA Affinity Chromatography, Biotechnol. Prog. 20 (2004) 830–840, doi:10.1021/
bp0342654.
[14] R.L. Fahrner, H.V. Iyer, G.S. Blank, The optimal flow rate and column length
for maximum production rate of protein A affinity chromatography, Bioprocess
Eng 21 (1999) 287, doi:10.10 07/s0 04490 050677.
[15] M.R. Ladisch, Bioseparations Engineering: Principles, Practice, and Economics,
Wiley, 2001.
[16] G. Carta, A. Jungbauer, Protein Chromatography, Wiley, 2010, doi:10.1002/
9783527630158.
[17] G. Guiochon, D.G. Shirazi, A. Felinger, A.M. Katti, Fundamentals of Preparative
and Nonlinear Chromatography, Academic Press, 2006.
[18] N. Yoshimoto, Y. Sugiyama, S. Yamamoto, A simple method for calculating
the productivity of polyphenol separations by polymer-based chromatography, Biosci. Biotechnol. Biochem. 81 (2017) 812–816, doi:10.1080/09168451.
2017.1283210.
[19] C.-S. Chen, N. Yoshimoto, S. Yamamoto, Prediction of the performance of
capture chromatography processes of proteins and its application to the repeated cyclic operation optimization, J. Chem. Eng. Jpn. 53 (2020) 689–697,
doi:10.1252/jcej.20we116.
[20] K. Soetaert, J. Cash, F. Mazzia, Solving Differential Equations in R, Springer,
Berlin Heidelberg, 2012, doi:10.1007/978- 3- 642- 28070- 2.
[21] K. Soetaert, F. Meysman, Solving partial differential equations, using R package ReacTran, 2009. />vignettes/PDE.pdf
[22] K. Soetaert, F. Meysman, Package ‘ReacTran, ’ R Doc. (2012).
[23] J. Xu, M.S. Rehmann, X. Xu, C. Huang, J. Tian, N.-X. Qian, Z.J. Li, Improving titer
while maintaining quality of final formulated drug substance via optimization
Conclusion
We have developed a method for designing the PCCC conditions
based on the linear driving force mechanistic model with the mass
transfer coefficients and the Langmuir isotherm parameters. The
performance between PCCC and the batch operation were compared by the relative buffer consumption BF∗ and resin utility RU∗
values as a function of productivity, P. Linear correlations were observed between BF∗ or RU∗ and P.
We have also proposed a useful linear correlation between the
normalized BT% and F’, which includes binding capacity, the duration of non-loading protocols, particle size, and mass transfer coefficient. By using this correlation, BT% at different conditions in
PCCC can be determined without the numerical calculations.
Credit authorship contribution statement
Chyi-Shin Chen: Modelling, Simulation, Writing –original draft,
review and editing. Fuminori Konoike: Experiment design and
run, Writing- review. Noriko Yoshimoto: Supervision, Writing –
review & editing. Shuichi Yamamoto: Framework of the research,
Funding acquisition, Project management, Writing –review & final
editing.
Declaration of Competing Interest
The authors declare that they have no known competing financial interests or personal relationships that could have appeared to
influence the work reported in this paper.
10
C.-S. Chen, F. Konoike, N. Yoshimoto et al.
[24]
[25]
[26]
[27]
[28]
[29]
[30]
Journal of Chromatography A 1658 (2021) 462604
of CHO cell culture conditions in low-iron chemically defined media, in: MAbs,
Taylor & Francis, 2018, pp. 488–499.
P. Gronemeyer, R. Ditz, J. Strube, Trends in upstream and downstream process development for antibody manufacturing, Bioengineering 1 (2014) 188–
212, doi:10.3390/bioengineering1040188.
R.A. Rader, E.S. Langer, Biopharmaceutical manufacturing: historical and future
trends in titers, yields, and efficiency in commercial-scale bioprocessing, Bioprocess. J. 13 (2014).
N. Yoshimoto, T. Yada, S. Yamamoto, A simple method for predicting the adsorption performance of capture chromatography of proteins, Japan J. Food
Eng. 17 (2016) 95–98, doi:10.11301/jsfe.17.95.
J. Woodcock, Modernizing pharmaceutical manufacturing–continuous manufacturing as a key enabler, Int. Symp. Contin. Manuf. Pharm., 2014.
S. Klutz, L. Holtmann, M. Lobedann, G. Schembecker, Cost evaluation of antibody production processes in different operation modes, Chem. Eng. Sci. 141
(2016) 63–74, doi:10.1016/j.ces.2015.10.029.
M. Bisschops, L. Frick, S. Fulton, T. Ransohoff, Single-use, continuous-countercurrent, multicolumn chromatography, BioProcess Int 7 (2009) 18–23.
S. Klutz, J. Magnus, M. Lobedann, P. Schwan, B. Maiser, J. Niklas, M. Temming,
G. Schembecker, Developing the biofacility of the future based on continuous processing and single-use technology, J. Biotechnol. 213 (2015) 120–130,
doi:10.1016/j.jbiotec.2015.06.388.
[31] D. Baur, M. Angarita, T. Müller-Späth, M. Morbidelli, Optimal model-based design of the twin-column CaptureSMB process improves capacity utilization and
productivity in protein A affinity capture, Biotechnol. J. 11 (2016) 135–145,
doi:10.1002/biot.201500223.
[32] L. David, P. Schwan, M. Lobedann, S.O. Borchert, B. Budde, M. Temming,
M. Kuerschner, F.M.A. Aguilo, K. Baumarth, T. Thute, B. Maiser, A. Blank,
V. Kistler, N. Weber, H. Brandt, M. Poggel, K. Kaiser, K. Geisen, F. Oehme,
G. Schembecker, Side-by-side comparability of batch and continuous downstream for the production of monoclonal antibodies, Biotechnol. Bioeng. 117
(2020) 1024–1036.
[33] J. Zhang, S. Siva, R. Caple, S. Ghose, R. Gronke, Maximizing the functional lifetime of Protein A resins, Biotechnol. Prog. 33 (2017) 708–715.
[34] M.C. Nweke, A.S. Rathore, D.G. Bracewell, Lifetime and aging of chromatography resins during biopharmaceutical manufacture, Trends Biotechnol 36 (2018)
992–995.
[35] F. Feidl, M.F. Luna, M. Podobnik, S. Vogg, J. Angelo, K. Potter, E. Wiggin, X. Xu,
S. Ghose, Z-J. Li, M. Morbidelli, A. Butté, Model based strategies towards protein A resin lifetime optimization and supervision, J. Chromatogr. A 1625
(2020) 461261.
11