A compound post-column re-focusing approach in supercritical fluid chromatography
Bạn đang xem bản rút gọn của tài liệu. Xem và tải ngay bản đầy đủ của tài liệu tại đây (2.89 MB, 11 trang )
Journal of Chromatography A 1660 (2021) 462642
Contents lists available at ScienceDirect
Journal of Chromatography A
journal homepage: www.elsevier.com/locate/chroma
A compound post-column re-focusing approach in supercritical fluid
chromatography
Mingzhe Sun a,b,∗, Peter Schoenmakers a,b
a
b
Analytical Chemistry Group, Van’t Hoff Institute for Molecular Sciences, University of Amsterdam, 1098 XH Amsterdam, The Netherlands
Centre for Analytical Sciences Amsterdam (CASA), The Netherlands
a r t i c l e
i n f o
Article history:
Received 10 September 2021
Revised 19 October 2021
Accepted 20 October 2021
Available online 1 November 2021
Keywords:
Concentration enhancement
Heart-cut
Re-mobilizing
Signal enhancement
Trapping
a b s t r a c t
Supercritical-fluid chromatography (SFC) is regaining popularity in various fields of analytical chemistry
owning to significant advances in instrumentation made in the past decade. However, due to the CO2
based mobile phase and the high flow rates often employed, detection of trace amounts of analytes and
coupling with certain detectors or other chromatography techniques are still difficult under many circumstances. In this study we propose a post-column re-focusing approach for SFC analysis to achieve
not only signal enhancement in UV-Vis detection, but also actual concentration enhancement of the analyte. By heart-cutting and transporting a selected fraction from the SFC flow into a trapping column with
a flushing solvent, re-focusing of the collected analytes can be achieved by re-mobilization with another
solvent once the depressurized CO2 is eliminated. By carefully selecting the trapping stationary phase and
the two solvents, signal-enhancement ratios between 2.2 and 6.4 were realized for four representative
compounds eluting with very different percentages of SFC modifier (methanol). The actual concentration
enhancement was lower (ratios between 1.7 to 2.9), because the UV response of the analytes was found
to differ significantly under SFC and LC conditions.
© 2021 The Author(s). Published by Elsevier B.V.
This is an open access article under the CC BY license ( />
1. Introduction
In the past decade we have witnessed an increased proliferation of supercritical-fluid chromatography (SFC) in many application fields, thanks to significant advances in instrumentation and
column technology [1]. Most SFC applications utilize compressed
CO2 as the major constituent of the mobile phase, with a polar
organic solvent added as modifier. Compared with reversed-phase
liquid chromatography (RPLC) and normal-phase liquid chromatography (NPLC), which are widely used in chemical analysis at the
moment, SFC type mobile phases offer a much lower viscosity, despite having a liquid-like density [2]. This allows high flow rates
to be used in SFC. Since a low viscosity concurs with a high diffusivity, the mass transfer of analytes is also greatly enhanced and
high flow rates are optimal. These unique properties, combined
with the possibility of using both non-polar and polar stationary
phases, make SFC a viable option for the analysis of a wide range
of compounds [3,4].
∗
Corresponding author.
E-mail addresses: ,
(P. Schoenmakers).
(M.
Sun),
Despite the advantages SFC offers over other chromatographic
techniques, analyte band dilution arising from the high flow feature of SFC together with noise caused by fluctuations in mobile phase density can lead to poor detection limits in many applications, especially when the detector is concentration dependent or has a limited active detection volume [5–7]. The high flow
rate and CO2 -based SFC mobile phases also raise various technical challenges for the realization of hyphenated systems, such as
the coupling of SFC with different types of mass spectrometers and
on-line two-dimensional (heart-cut SFC-LC or comprehensive twodimensional SFC × LC) [8,9]. To mitigate these negative effects of
SFC mobile phases on detection and hyphenation, an additional analyte focusing step after the SFC separation is desirable.
While analyte focusing has been very rarely investigated in SFC,
relevant studies in HPLC have been abundant in two main categories, viz. on-column focusing and post-column re-focusing [10–
15]. The generic HPLC post-column re-focusing approach involves
the use of a strongly retentive trapping column installed after the
analytical column to focus the analytes and of a strong solvent
to re-mobilize the trapped analyte bands [12]. To adopt this approach in supercritical-fluid chromatography, the trapping column
must be placed after the back-pressure regulator (BPR). However,
this does cause a number of complications. The depressurized ef-
/>0021-9673/© 2021 The Author(s). Published by Elsevier B.V. This is an open access article under the CC BY license ( />
M. Sun and P. Schoenmakers
Journal of Chromatography A 1660 (2021) 462642
fluent, consisting of CO2 and co-solvent flows through the trapping
column at a much higher linear velocity than that in the analytical
column. The adiabatically expanded CO2 cools down the trapping
column. The combination of cold CO2 and cold co-solvent cannot
be smoothly transported through the trapping column at very high
velocities. Besides, when the SFC mobile phase contains only a low
concentration of co-solvent, analyte precipitation may take place
in the BPR. Finally, if a significant amount of CO2 remains in the
trapping column it will have to be removed before re-mobilizing
the analytes, to avoid a noisy baseline. It is also highly unlikely to
find one trap that accommodates the vast range of properties of
compounds analysed in SFC. This makes efficient and reliable analyte focusing a challenging issue in SFC.
The objective of the present work is to develop an SFC postcolumn re-focusing approach that is generally applicable to a wide
range of analytes, with collection and subsequent trapping of an
SFC peak performed in a 2D “heart-cutting” fashion. We aim to
evaluate the re-focusing performance of the proposed approach,
the UV signal enhancement and concentration enhancement using
a small number of representative compounds. We also aim to eliminate all CO2 from the trapping column, using a flushing solvent,
before the trapped analytes are re-mobilized by a flow of strong
solvent. Different combinations of trapping chemistry and solvent
systems are tested as to their potential to successfully re-focus the
representative compounds that vary in polarity and elute at different SFC mobile-phase compositions.
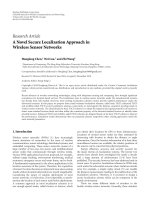
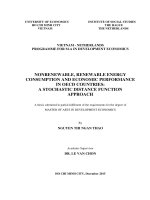
Fig. 1. SFC-UV system without (A) and with (B) post-column re-focusing.
DAD was used and spectral data from 200 to 450 nm were collected with a resolution of 1.2 nm. The sampling rate was 20 Hz
and the filter time was set at 0.1 s. Signal data used for plotting
chromatograms were collected at 280 nm, compensated by a reference signal from 400 nm to 450 nm. System control and data
processing were performed with Empower 3 software (Waters).
2. Material and methods
2.1. Chemicals, columns and equipment
The four representative compounds phenanthrene, phenol,
theobromine and p-coumaric acid were all purchased from SigmaAldrich (Zwijndrecht, The Netherlands). Acetonitrile (ACN) and
methanol were obtained from Biosolve (Valkenswaard, The Netherlands). n-Hexane and diethyl ether were purchased from VWR
(Amsterdam, The Netherlands). Ethanol was obtained from Merck
(Darmstadt, Germany). All organic solvents were of HPLC grade
or better. Water purified using Sartorius Arium 611 UV system
was used for all experiments. SFC-grade carbon dioxide (4.8) was
obtained from Praxair (Vlaardingen, The Netherlands). Individual
standards of phenanthrene, phenol and p-coumaric acid of different concentrations were prepared in acetonitrile. Standards of
theobromine of different concentrations were prepared by diluting a 1 mg/mL dimethyl sulfoxide (DMSO) solution with acetonitrile. Standard mixtures of the four compounds were prepared in
acetonitrile in different concentrations. All standard solutions were
stored at -20°C when not being used. Five columns were used either as SFC separation column or trapping column in this work,
viz. Waters BEH (ethylene-bridged silica, 100 mm × 3 mm i.d.; 1.7
μm particle size), Waters Torus DIOL (100 mm × 3 mm; 1.7 μm),
Waters Torus 2-PIC (2-picolylamine, 100 mm × 3 mm; 1.7 μm),
Agilent ZORBAX Eclipse Plus C18 (30 mm × 2.1 mm; 1.8 μm), and
Agilent ZORBAX Eclipse Plus C18 (50 mm × 3 mm; 1.8 μm).
SFC experiments were carried out on a Waters UltraPerformance Convergence Chromatography (UPC2 ) System (Waters,
Milford, MA, USA) with a binary solvent pump, an auto-sampler, a
column oven, a back-pressure regulator, and a diode-array detector (DAD). A 10-μL injection loop was used for injection. An additional Waters UPLC binary pump was used when a liquid flow
was needed in post-column re-focusing experiments. Two sampling loops of 160 μL and 230 μL were prepared to collect SFC
fractions in the re-focusing experiments. The SFC column oven
had two channels that were employed to control the temperature
of the SFC and trapping columns separately. For all experiments
(stand-alone SFC and SFC with post-column re-focusing), the same
2.2. SFC system design with and without post-column re-focusing
Fig. 1A shows the simple SFC-UV system without the postcolumn re-focusing process. It is used to generate chromatograms
for peak-height comparison and for acquiring UV-Vis spectra.
Fig. 1B shows the SFC-UV system with post-column re-focusing
embedded. The valve is in Position 1 to collect the peak of interest in a sample loop. After the collection is completed, the valve
is switched to Position 2. Then the first step (Step 1) involves
a flushing solvent to transport the collected fraction to the trapping column and to remove any remaining CO2 from the trap. In
the next step (Step 2), a re-mobilizing solvent flow is applied to
quickly elute the trapped compounds to the UV detector. After the
analysis is done, the valve is switched back to Position 1 to recondition the trapping column and prepare for the next injection.
2.3. SFC separation and post-column re-focusing of four
representative compounds
2.3.1. SFC separation of the four compounds
The SFC separation of the four representative compounds was
performed with the BEH column. The gradient started with 2%
methanol (with 0.1% formic acid), ramped up to 26% methanol in 4
min, then decreased to the starting composition in 1 min after a 1
min hold at 26%. The flow rate was 1 mL/min, with a column temperature of 50°C and back pressure of 13 MPa (130 bar). To generate the SFC chromatograms of the separation, a standard mixture
of the four compounds (phenanthrene, phenol and p-coumaric acid
all having a concentration of 0.25 mg/mL, while theobromine was
of 0.05 mg/mL) was used and the injection volume was 1 μL. All
injections were performed in triplicate.
2
M. Sun and P. Schoenmakers
Journal of Chromatography A 1660 (2021) 462642
2.3.4. Evaluation of polar trap with hexane/ethanol solvent system
In order to compare the trapping performance of the three relatively polar compounds on the DIOL and 2-PIC columns, 1D-LC
experiments were performed with hexane and ethanol as weak
and strong solvents, respectively. The mobile-phase flow rate was
0.3 mL/min, with a gradient from 100% hexane to 100% ethanol
in 5 min. After 5 min, the mobile phase was held at 100%
ethanol to elute strongly retained compounds. Column temperature was set at 40°C. The same standard mixture of the four compounds (phenanthrene, phenol, p-coumaric acid and theobromine;
1 μL injection volume; triplicate injections) that was described in
Section 2.3.1 was used in the experiments.
2.3.5. Post-column re-focusing of phenol
The re-focusing experiments of phenol were carried out using
the 2-PIC column as the trap. 30°C, 40°C and 50°C were investigated as trap temperatures. The flushing solvent was hexane, delivered at 0.4 mL/min. Three flushing end times were used and compared in the re-focusing experiments, i.e. 2.5, 3.0, and 3.5 min. The
re-mobilizing solvent was ethanol and three flow rates were studied, i.e. 0.3, 0.4, and 0.5 mL/min. The influence of solvent-switch
time was also assessed, by setting it at 0.01, 0.5, and 1.0 min.
All re-focusing experiments were done with 1 μL injection of 0.2
mg/mL phenol solution in ACN in triplicate.
2.3.6. Post-column re-focusing of p-coumaric acid
The DIOL column was utilized as the trapping column for refocusing experiments of p-coumaric acid. 30°C, 45°C and 55°C
were used as trap temperatures. Hexane at a flow rate of 0.4
mL/min was employed as the flushing solvent, while ethanol was
used as the re-mobilizing solvent at three different flow rates, i.e.
0.3, 0.4, and 0.5 mL/min. Different end time of hexane flushing
were studied and compared, i.e. 4.5, 5.5, and 6.5 min. Also, different solvent-switch times were adopted to study its influence,
i.e. 0.01, 0.5 min and 1.0 min. All re-focusing experiments were
performed with 1 μL injection of a solution of 0.05 mg/mL pcoumaric acid in ACN in triplicate.
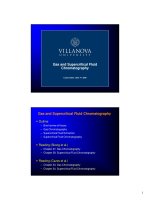
Fig. 2. SFC separation of four representative compounds. Refer to Section 2.3.1 for
detailed SFC conditions. (A) no extra connection between the column outlet and the
DAD; (B) 160-μL loop placed between the column outlet and DAD; and (C) 230-μL
loop placed between the column outlet and DAD. Peak identity: 1. Phenanthrene; 2.
Phenol; 3. p-Coumaric acid; 4. Theobromine.
2.3.2. Post-column re-focusing of phenanthrene
The post-column re-focusing experiments of phenanthrene
were performed with the 30 mm long C18 column as the trapping
column. Trap temperatures of 35°C, 45°C and 55°C were tested.
The flushing solvent for CO2 removal was H2 O with a constant
flow rate of 0.2 mL/min. To study the influence of flushing time
on the re-focusing performance, different end times of the flushing
were employed, ranging from 2.05 to 6.05 min. The re-mobilizing
solvent used was acetonitrile and different times were tested to
switch the solvent from 100% H2 O to 100% ACN, viz. 0.01 min, 0.5
min and 1.0 min. The flow rate of the re-mobilizing solvent was
also varied (from 0.12 mL/min to 0.35 mL/min) to study its effect
on the re-focusing. All re-focusing experiments were performed in
triplicate with 1 μL injection of 0.2 mg/mL phenanthrene solution
in ACN.
2.3.7. Comparison of ethanol and methanol as re-mobilizing solvents
for theobromine
To compare the retention of theobromine on the DIOL column
with ethanol and methanol as re-mobilizing solvents, 1D-LC injections of 1 μL of a solution of 0.1 mg/mL theobromine in acetonitrile were made. The column temperature was set at 30°C. The
isocratic mobile phase consisted of either 100% ethanol or 100%
methanol, with a flow rate of 0.4 mL/min. For each experiment,
triplicate injections were performed.
2.3.8. Post-column re-focusing of theobromine
The trapping column for post-column re-focusing experiments
with theobromine as analyte was the DIOL column. Only 20°C
was used as the trap temperature. The flushing solvent was diethyl ether, delivered at 0.5 mL/min, and three flushing end-times
were investigated and compared, i.e. 5.0, 6.0, and 7.0 min. The remobilizing flow of methanol was delivered after the flushing flow
with three different solvent-switch times (0.01, 0.5, and 1.0 min).
Three flow rates were studied for the re-mobilizing solvent, i.e. 0.3,
0.4, and 0.5 mL/min. All re-focusing experiments were performed
in triplicate with 1-μL injections of a solution of 0.1 mg/mL theobromine in ACN.
2.3.3. Testing the trapping system for other compounds
The C18 trap and H2 O/ACN solvent system were also tested for
re-focusing of the other three compounds. Only the small loop (160
μL) was used for SFC peak collection. The 50 mm long C18 column
was used and the trap temperature was set at 55°C. The flushing
flow of H2 O was set at 0.2 mL/min and the end time of the flushing was 3.5 min, 5.2 min and 5.6 min for phenol, p-coumaric acid
and theobromine, respectively. The re-mobilizing flow of ACN was
delivered at 0.2 mL/min with a solvent switch time of 0.01 min.
The same standard mixture of the four compounds (phenanthrene,
phenol, p-coumaric acid and theobromine; 1 μL injection volume;
triplicate injections) that was described in Section 2.3.1 was used
in the experiments.
2.4. Translating peak-height ratio to concentration ratio
Standard mixtures of the four compounds at different concentrations were analysed (in triplicate) by SFC using the same conditions as described in section 2.3.1. Thereafter, the system was converted into a one-dimensional UPLC system with the same DAD
3
M. Sun and P. Schoenmakers
Journal of Chromatography A 1660 (2021) 462642
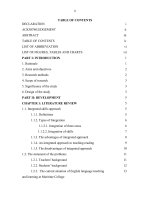
Fig. 3. (A) Re-focusing chromatogram (orange) of phenanthrene, with SFC chromatogram (black) for comparison. The identities of the peaks are confirmed with UV-Vis
absorption spectra (bottom). (B) Re-focusing chromatogram generated from a blank injection under the same experimental conditions as (A). (C) Overlapped re-focusing
chromatograms of three repeated injections. Refer to Table S-1 for specific experimental conditions used for re-focusing experiments.
Fig. 4. Investigation of the parameters influencing post-column re-focusing of phenanthrene: (A) sampling-loop volume; (B) H2 O flushing time; (C) trapping temperature;
(D) solvent-switch time and (E) ACN flow rate. Refer to Table S-2 for specific experimental settings used for re-focusing experiments in each case.
as used for SFC injections. Phenanthrene standard solutions of different concentrations were analysed using the 30-mm C18 column with isocratic elution with 100% acetonitrile at 0.25 mL/min.
The column temperature was set at 55°C. Phenol standard solutions of different concentrations were analysed using the 2-PIC
column with isocratic elution with 100% ethanol at 0.25 mL/min.
The column temperature was set at 50°C. Standard solutions of
the other two compounds were injected into the DIOL column.
Isocratic elution at 0.25 mL/min was adopted for p-coumaric
acid with 100% ethanol at 45°C, and for theobromine with 100%
methanol at 20°C. All the 1D-LC injections were performed in
triplicate.
3. Results and discussion
3.1. SFC separation of the four representative compounds
The four compounds selected in this study present a wide range
of physio-chemical properties. For example, the logarithms of their
octanol-water distribution coefficients (log P) range from -0.78 to
4.46. As can be seen in Fig. 2A, the four compounds elute at very
different methanol percentages in the gradient SFC run. Together
with their varying polarities, this makes the effective trapping and
re-mobilizing of all four compounds using one trapping column extremely difficult. It should also be noted that severe peak broad-
4
M. Sun and P. Schoenmakers
Journal of Chromatography A 1660 (2021) 462642
Fig. 5. Re-focusing of the three relatively polar compounds using H2 O and ACN as flushing and re-mobilizing solvent, respectively, with the 50-mm C18 column as trap: (A)
SFC chromatogram of the four compounds for comparison; (B) re-focusing of phenol; (C) re-focusing of p-coumaric acid and (D) re-focusing of theobromine. Refer to Table
S-3 for specific experimental settings used for re-focusing experiments in each graph. (E) and (F) 1D-LC evaluation of the polar trap - hexane/ethanol system; (E) DIOL, (F)
2-PIC. See Section 2.3.4 for parameter settings. Peak identity: 1. Phenanthrene; 2. Phenol; 3. p-Coumaric acid; 4. Theobromine; 5 and 6. Background peaks.
ening is unavoidable once the collection loop is added between
the SFC column outlet and the DAD for fraction collection. Fig. 2B
and 2C show the broadened SFC peaks when the 160 μL and 230
μL collection loops were used, respectively. The peaks are much
broader than when the column outlet was directly connected to
the DAD (Fig. 2A). To allow for a fair comparison in this study,
the re-focused peaks are always compared with the SFC peaks obtained when the column is directly connected to the DAD.
tent in the SFC mobile phase increases during the gradient. Both
the flushing and re-mobilizing solvents have to be carefully chosen
to match the following criteria: (i) the flushing solvent is miscible
with the re-mobilizing solvent; (ii) the flushing solvent must be a
weak eluent for the analytes to ensure trapping on the stationary
phase; (iii) the re-mobilizing solvent must be a strong eluent to
quickly wash the analytes off the trapping column.
Phenanthrene eluted with approximately 3% methanol in CO2
from the SFC column. C18 can be used to effectively trap the
phenanthrene after transfer from the sampling loop, given the low
amount of methanol present and the non-polar character of the
compound. Phenanthrene has a log P value of 4.46, so water is
a very weak eluent and can be used as a flushing solvent to remove the remaining CO2 , without severely disturbing the band of
trapped analyte. Acetonitrile would be a suitable re-mobilizing solvent.
A typical re-focusing chromatogram is shown in Fig. 3A. Peak 1
(black line) is the phenanthrene peak obtained in an SFC-UV run
without the re-focusing process. In the re-focusing chromatogram,
the complex noisy signals from around 1 to 3.6 min originated
from depressurized CO2 passing through the detector, as well as
the remaining CO2 that was flushed out by water. Once all the
3.2. Post-column re-focusing of phenanthrene
The successful re-focusing of a compound requires that both
trapping and re-mobilizing steps are efficient. As the outlet of the
trapping column is not pressurized, the transferred SFC fraction
will undergo a phase separation when it reaches a certain point in
the trapping column. This leads to CO2 becoming a gas and losing
its solvation power, while most of the compounds are dissolved
in the precipitated (liquid) methanol. The methanol phase is dispersed on the surface of the stationary phase, which must provide strong enough interactions with the analytes to retain them
on the trapping column. This is increasingly important for the relatively late-eluting compounds from the SFC, as the methanol con5
M. Sun and P. Schoenmakers
Journal of Chromatography A 1660 (2021) 462642
Fig. 6. Investigation of the parameters affecting the post-column re-focusing of phenol: (A) sampling-loop volume; (B) re-focusing chromatogram of a blank injection for
comparison; (C) solvent-switch time; (D) trapping temperature; (E) hexane flushing time and (F) ethanol flow rate. Refer to Table S-4 for specific experimental settings used
for re-focusing experiments in each graph.
CO2 was eliminated from the trapping column, the background returned to normal. The sudden solvent switch from 100% H2 O to
100% ACN gave rise to a small peak that can be seen at around
4 min, after which the trapped analyte was re-mobilized to the
DAD by the ACN flow, generating peak 2. The identity of the refocused peak can be verified both by matching the UV-Vis absorption spectra of peak 1 and 2, and by comparing the re-focused
chromatogram of phenanthrene with one acquired from a blank
injection under the same experimental settings (Fig. 3B). As can be
seen from comparing Fig. 3A and 3B, the CO2 noise pattern was
not repeatable and varied greatly from injection to injection. However, the re-focused peak presented good repeatability in terms of
elution time, peak height and peak area, as shown by the overlapped re-focusing chromatograms of repeated injections of the
same phenanthrene solution (Fig. 3C).
Some parameters that may potentially influence the final refocusing results have been investigated in this study. Two sampling
loops (160 μL and 230 μL) were compared to investigate whether
the volume of the collected SFC fraction affected the trapping. As
can be seen in Fig. 4A, the size of the sampling loop hardly affected the height of the re-focused peak. There was a shift in elution time, because of the different dwell volumes of the loops.
The invariable peak height in Fig. 4A indicated that the trapping
process was successful. Both peaks were equally high and equally
broad, despite the broader starting profile (before trapping) that
resulted from using a larger loop (see Fig. 2). The 160-μL loop was
then picked for the other experiments. Compared with samplingloop size, an increase in H2 O flushing time brought a clear increase in peak height (Fig. 4B). However, the improvement is not
dramatic when considering the longer time needed. Possibly, the
more-efficient removal of the SFC co-solvent leads to a sharper
H2 O/ACN front at the elution stage. The trap temperature certainly
plays an important role, not only during the trapping process, but
also during re-mobilization. As shown in Fig. 4C, increasing the
trapping temperature led to higher re-focused peaks, especially
when the temperature was changed from 45°C to 55°C. An increase
in the solvent-switching time resulted in only a slight decrease in
the height of the re-focused peaks (Fig. 4D). The peak-compression
effect normally encountered in gradient-elution HPLC was not observed here, but somewhat sharper peaks were obtained with a
faster transition from the flushing solvent to the re-mobilizing solvent. A change in the flow rate of the re-mobilizing solvent flow
rate greatly influenced the area of the re-focused peak, as expected, but led to very small changes in peak height (Fig. 4E). This
means that the concentration of phenanthrene at the top of the
re-focused peak was almost unchanged, regardless of the varying
ACN flow rate. A high re-mobilizing flow is preferred to shorten
the analysis time, as long as column pressure is not a concern.
6
M. Sun and P. Schoenmakers
Journal of Chromatography A 1660 (2021) 462642
Fig. 7. Investigation of the parameters influencing the post-column re-focusing of p-coumaric acid: (A) sampling loop volume; (B) re-focusing chromatogram of a blank
injection for comparison; (C) trap temperature; (D) hexane flushing time; (E) ethanol flow rate and (F) solvent-switch time. Refer to Table S-5 for specific experimental
settings used for re-focusing experiments in each graph.
nol, p-coumaric acid and theobromine. To reduce the probability
of losing analytes during the flushing step, n-hexane was selected
as the flushing solvent. Acetonitrile was replaced by ethanol for
solvent-miscibility reasons. Before using these NPLC systems in refocusing experiments, 1D-LC experiments with hexane and ethanol
as weak and strong solvents were performed on the DIOL and 2PIC columns to compare their trapping performance for the three
polar compounds (Fig. 5E and 5F). When subjected to the same
solvent gradient, phenol and theobromine presented very similar
retentions on the two columns. p-Coumaric acid was much-more
retained on the 2-PIC column than on the DIOL column, while displaying much more severe peak broadening. For the sake of peak
width and analysis time, the 2-PIC column was selected as the
trapping column for re-focusing of phenol and the DIOL column
was used for re-focusing of p-coumaric acid and theobromine.
3.3. Re-focusing of phenol, p-coumaric acid and theobromine with
the C18 trap
The implementation of the C18 trapping with H2 O and ACN as
flushing and re-mobilizing solvent, respectively, did not provide
good performance for the three more polar compounds, despite
the use of a longer C18 column for trapping. As shown in Fig. 5 (BD), only very small re-focused peaks could be observed for phenol and p-coumaric acid, while theobromine was not trapped at
all. This was to be expected, as these compounds were transferred to the trapping column with higher amounts of methanol
(phenol, p-coumaric acid and theobromine eluted with approximately 8%, 18% and 21% methanol in CO2 , respectively). In these
cases, the methanol may lead to partial or total breakthrough of
the compounds from the trapping column. Furthermore, water is
no longer an appropriate flushing solvent as the compound polarity increases, especially for theobromine, which is more soluble in H2 O than in most organic solvents. While the H2 O flow removed the remaining CO2 from the trap, the analytes could also be
flushed away.
3.5. Post-column re-focusing of phenol
The system consisting of the 2-PIC trapping column and nhexane and ethanol as flushing and re-mobilizing solvents, respectively, was evaluated for the re-focusing of phenol. As displayed
in Fig. 6A, two peaks close to each other appeared after the background returned to normal from the CO2 noise. A blank injection
revealed that the second peak was the re-focused phenol peak,
while the first one was most likely caused by the fast solvent
3.4. Evaluation of polar trap with hexane/ethanol solvent system
Polar stationary phases (DIOL and 2-picolylamine, 2-PIC) were
then considered in order to achieve more effective trapping of phe7
M. Sun and P. Schoenmakers
Journal of Chromatography A 1660 (2021) 462642
Fig. 8. (A) 1D-LC comparison of methanol and ethanol as re-mobilizing solvents for theobromine. (B). Re-focusing chromatogram of a blank injection. Investigation of the
parameters influencing the post-column re-focusing of theobromine: (C) sampling-loop volume; (D) diethyl-ether flushing time; (E) MeOH flow rate and (F) solvent-switch
time. Refer to Table S-6 for specific experimental settings used for re-focusing experiments in each graph.
Table 1
Overall best re-focusing conditions and enhancement ratios for the four representative compounds achieved in this study.
Phenanthrene
Phenol
Interface
Flushing & re-mobilizing conditions
Loop size: 160 μL Valve pos. 1
to 2: 0.75 min
Trapping column: 30 mm C18, 55°C Flushing solvent: H2 O, 0 - 3.05
min, 0.2 mL/min Re-mobilizing solvent: ACN, 3.06 - 5.06 min, 0.2
mL/min
Trapping column: 2-PIC 50°C Flushing solvent: Hexane, 0 - 3 min, 0.4
mL/min Re-mobilizing solvent: Ethanol, 3.5 - 5.5 min, 0.5 mL/min
Trapping column: DIOL 45°C Flushing solvent: Hexane, 0 - 5.5 min,
0.4 mL/min Re-mobilizing solvent: Ethanol, 5.51 - 7.5 min, 0.3
mL/min
Trapping column: DIOL 20°C Flushing solvent: Diethyl ether, 0 - 6
min, 0.5 mL/min Re-mobilizing solvent: Methanol, 6.01 - 8 min, 0.3
mL/min
size: 230 μL Valve pos. 1
1.69 min
size: 160 μL Valve pos. 1
3.36 min
p-Coumaric
acid
Loop
to 2:
Loop
to 2:
Theobromine
Loop size: 160 μL Valve pos. 1
to 2: 3.67 min
switch from hexane to ethanol. The bigger loop gave rise to a
higher re-focused peak height, as evidenced by Fig. 6A. An increase
in the solvent-switch time brought a very slight increase in the
height of the re-focused peak (Fig. 6C). Similar to the trend observed with re-focusing of phenanthrene, an increase in the trap
temperature led to an increase in the height of the re-focused phenol peak, although the effect is much weaker than in the case
of phenanthrene (Fig. 6D). Practically no difference was observed
when the hexane flushing time was varied (Fig. 6E), which could
be attributed to the poor solvation power of hexane for phenol. By
UV peak
height
enhancement
Concentration
enhancement
6.4 times
2.6 times
6.4 times
2.2 times
3.2 times
2.9 times
2.2 times
1.7 times
employing a higher re-mobilizing ethanol flow, a slight increase in
the height of the re-focusing peak was achieved in a shorter analysis time (Fig. 6F).
3.6. Post-column re-focusing of p-coumaric acid
Although the 2-PIC column provided the strongest retention of
p-coumaric acid, it was not deemed a good option for re-focusing,
because re-mobilizing the trapped compound with ethanol in a
sharp band would be extremely difficult. Therefore, the DIOL col8
M. Sun and P. Schoenmakers
Journal of Chromatography A 1660 (2021) 462642
umn was chosen, together with hexane and ethanol as the flushing and re-mobilizing solvents. The re-mobilizing p-coumaric acid
peak was observed after the background peak that resulted from
the solvent switch (Fig. 7A and 7B). The use of sampling loops
of two different volumes did not yield any apparent differences
in the height of the re-focused peak. The 160-μL loop was used
for the rest of the tests, as it required a shorter total analysis
time. Surprisingly, changes in the trap temperature, hexane flushing time and ethanol flow rate did not induce any clear differences
in the re-focused peak (Fig. 7C-E). A shorter solvent-switching time
(immediate switch or 0.5-min gradient) yielded slightly better refocusing performance than the longer gradient (1.0 min; Fig. 7F).
pounds, which might lead to a significantly broadened trappedcomponent band. Also, ethanol could possibly be ineffective in remobilizing the trapped compound, as the solubility of theobromine
in ethanol is limited. Methanol displays much higher solubility of
theobromine than ethanol [16]. Therefore, methanol was investigated as the re-mobilizing solvent for theobromine. To avoid solvent immiscibility issues, it was combined with diethyl ether as
the flushing solvent. 1D-LC experiments were performed to compare the elution of theobromine using methanol and ethanol from
the DIOL column. As can be seen in Fig. 8A, methanol eluted the
compound faster and in a narrower band.
One benefit of using diethyl ether as the flushing solvent could
be that it can potentially remove precipitated methanol from the
transferred SFC fraction. However, its high volatility is a concern
for pumping, as can be observed in Fig. 8 (B-F). A comparison of
Fig. 8B and 8C revealed that the re-focused peak eluted right after
the noisy baseline returned to normal. Fig. 8D shows that this was
the case, regardless of the diethyl-ether flushing time. Thus, it was
evident that the fluctuations in the baseline originated from the
pumping of diethyl ether. They disappeared right after the solvent
switch to methanol and before the elution of the re-focused peak.
3.7. Post-column re-focusing of theobromine
The DIOL trapping - hexane/ethanol flushing/re-mobilizing system was also evaluated in the re-focusing of theobromine. However, the results from the preliminary runs were not satisfactory. The re-focused peaks were too broad. This was not totally
unexpected, as theobromine eluted with the largest concentration of methanol from the SFC column among the four test com-
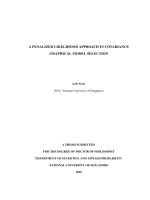
Fig. 9. (A) SFC/LC UV response ratio (PHE - Phenanthrene; PH - Phenol; COU - p-Coumaric acid; THEO - Theobromine). (B) Compound UV spectra in SFC-type and LC-type
solvents. The SFC UV signal and spectra for each compound were measured under their elution conditions in SFC. The LC UV signal and spectra for each compound were
measured under the optimized re-mobilizing conditions described in Table 1, except that 0.25 mL/min was used for all analytes.
9
M. Sun and P. Schoenmakers
Journal of Chromatography A 1660 (2021) 462642
To minimize the problems related to solvent volatility, only 20°C
was later used as trap temperature to study the factors influencing
the re-focusing performance.
The volume of the sampling loop did not lead to any significant variations in the re-focusing performance (Fig. 8C), with the
smaller loop yielding slightly higher re-focused peaks. The diethylether flushing time had almost no effect on the re-focusing of
theobromine (Fig. 8D), likely due to the limited elution strength
of diethyl ether, which caused the theobromine band in the trapping column to remain unaltered. Similar to what was observed
with the other compounds, re-mobilizing flow rate and solventswitch time hardly had any impact on the re-focused peak height
(Figs. 8E-F).
fine if only a single fraction is selected for further analysis, as in
commonly applied heart-cut 2D approaches. However, it is a drawback for multiple-heart-cut approaches. This drawback may feasibly be overcome by using a multiple-loop collector to store fractions [17]. However, this will unavoidably prolong the total analysis time. The drawback is even greater for comprehensive 2D chromatography, where many fractions must be collected and modulation times must be kept short.
Besides the use of columns packed with sub-2-μm particles to
achieve highly efficient and fast separations, another current trend
in SFC is the use of mobile phase containing high concentrations
(more than 50%) of modifier [18,19]. This type of mobile phase that
is intermediate between supercritical and liquid solvents extend
the range of compounds that can be analysed by SFC systems. The
use of the post-column re-focusing approach proposed in this work
under such conditions will be extremely challenging, as a very high
trapping capacity would be needed to successfully retain the compounds. In such a situation, the design may have to be modified
to include an extra solvent-dilution step before trapping, similar to
the concept of active solvent modulation in 2D-LC [20].
The main purpose of this work was to propose a strategy for
achieving SFC post-column re-focusing, with emphasis on the possibility of nuclear-magnetic-resonance (NMR) spectroscopy as a
quantitative structure-elucidative detector for SFC. NMR can be a
powerful chemical analysis tool when coupled with LC separations
[21]. However, one of the biggest challenges of this hyphenation is
the sample dilution in the LC mobile phase, which makes the detection of low-abundant analytes very difficult [22]. This issue is
even more challenging in the on-line coupling of SFC with NMR,
as much higher flow rates are often employed than in (U)HPLC [6].
A controlled-expansion type SFC-NMR interface has been proposed
in recent years for analyte re-focusing after SFC separation and before NMR detection [6,23,24]. The basic idea was to retain the compounds in small amount of precipitated SFC modifier, while letting
the CO2 expand in a controlled fashion. In comparison, the postcolumn re-focusing approach presented minimizes the effects of
the SFC modifier on the NMR measurements and eliminates the
need to use deuterated modifiers in SFC.
The influencing parameters assessed were not exhaustive. Other
parameters may potentially improve the re-focusing performance,
such as the length of the trapping column and direction of the remobilizing flow (forward flush or backflush). Such factors may be
reconsidered if the proposed post-column re-focusing approach is
adopted in real applications in future work.
3.8. Peak height enhancement and concentration enhancement of all
compounds
Table 1 summarizes the parameters employed to obtain the
best overall re-focusing performances for the four compounds
achieved in this study, together with the UV peak height and concentration enhancement ratio. As a compound’s UV-detector response at a specific concentration may vary greatly in different solvents, a straightforward translation of peak-height enhancement to
concentration enhancement may be erroneous. To accurately calculate the concentration enhancement brought by the post-column
re-focusing approach, calibration lines (peak area vs. concentration) were obtained for the four compounds under SFC and LC
elution conditions, respectively (Figures S1 and S2). After correction with the different flow rates employed in LC and SFC, the
UV response differences of the compounds in SFC and LC type
mobile phase were revealed. For example, a phenanthrene fraction of the same concentration showed an approximately twice as
high UV response in 100% acetonitrile than in supercritical CO2
with a small amount of methanol (Fig. 9A). The response difference can be partially attributed to a shift in compound UV absorption spectra (Fig. 9B). For phenanthrene, an obvious red shift
can be observed when the solvent changed from SFC-type to LCtype, which enhances the absorption at 280 nm. It should be noted
that the signal-enhancement ratios can change drastically if signals
are determined at different wavelengths that lead to maximum absorbance under SFC and LC elution conditions, respectively.
4. Conclusions, limitations and perspectives
A trapping approach has been developed to achieve SFC postcolumn re-focusing of compounds of a wide polarity range. Adequate re-focusing can be achieved for relatively non-polar compounds by using a C18 trapping column, combined with water as
flushing solvent and acetonitrile as re-mobilizing solvent. For effective trapping and focusing of more polar compounds, polar stationary phases were proven successful, in combination with n-hexane
or diethyl ether as flushing solvent and ethanol or methanol as remobilizing solvent. The effects of flushing time, sampling-loop size,
trap temperature, re-mobilizing flow rate and solvent switch time
were studied. In most cases the effects of these parameters were
found to be negligible or small. UV peak height enhancement ratios of 6.4, 6.4, 3.2, 2.2 were achieved for phenanthrene, phenol,
p-coumaric acid and theobromine, respectively. Concentration enhancement ratios of 2.6, 2.2, 2.9, 1.7, respectively, were obtained
for the same four analytes, taking into consideration differences in
UV absorption between SFC and LC conditions.
Since most SFC separations are completed within 5-15 mins
with contemporary instruments and columns, one obvious limitation of the current post-column re-focusing design is its low speed.
Practically, only one or two peaks can be re-focused if one sampling loop is used for collection of the SFC eluents. This is perfectly
Declaration of Competing Interest
The authors declare that they have no known competing financial interests or personal relationships that could have appeared to
influence the work reported in this paper.
CRediT authorship contribution statement
Mingzhe Sun: Conceptualization, Methodology, Formal analysis,
Investigation, Data curation, Writing – original draft, Writing – review & editing, Project administration. Peter Schoenmakers: Resources, Writing – original draft, Writing – review & editing, Supervision, Funding acquisition.
Acknowledgement
The research is part of the SFC-NMR project that is funded by
the Dutch Research Council (NWO) in the framework of Technology Area COAST (project 053.21.115), and the MANIAC project that
is funded by NWO in the framework of the Programmatic Technology Area PTA-COAST3 of the Fund New Chemical Innovations
10
M. Sun and P. Schoenmakers
Journal of Chromatography A 1660 (2021) 462642
(project 053.21.113). The authors thank Prof. Arno Kentgens and Dr.
Fleur van Zelst for inspiring scientific discussions and suggestions
on the SFC-NMR coupling.
[11] A.F.G. Gargano, M. Duffin, P. Navarro, P.J. Schoenmakers, Reducing dilution and
analysis time in online comprehensive two-dimensional liquid chromatography
by active modulation, Anal. Chem. 88 (2016) 1785–1793.
[12] J. De Vos, G. Desmet, S. Eeltink, A generic approach to post-column refocusing
in liquid chromatography, J. Chromatogr. A 1360 (2014) 164–171.
[13] J. Slobodnik, H. Lingeman, U.A.T. Brinkman, Large-volume liquid chromatographic trace-enrichment system for environmental analysis, Chromatographia
50 (1999) 141–149.
[14] L. Griffiths, R. Horton, Optimization of LC-NMR III - Increased signal-to-noise
ratio through column trapping, Magn. Reson. Chem. 36 (1998) 104–109.
[15] M.J. Mills, J. Maltas, W.J. Lough, Assessment of injection volume limits when
using on-column focusing with microbore liquid chromatography, J. Chromatogr. A 759 (1997) 1–11.
[16] J.L. Zhong, N. Tang, B. Asadzadeh, W.D. Yan, Measurement and correlation of
solubility of theobromine, theophylline, and caffeine in water and organic solvents at various temperatures, J. Chem. Eng. Data 62 (2017) 2570–2577.
[17] M. Pursch, S. Buckenmaier, Loop-based multiple heart-cutting two-dimensional liquid chromatography for target analysis in complex matrices, Anal.
Chem. 87 (2015) 5310–5317.
[18] M.R. Silva, F.N. Andrade, B.H. Fumes, F.M. Lancas, Unified chromatography: Fundamentals, instrumentation and applications, J. Sep. Sci. 38 (2015) 3071–3083.
[19] S.V. Olesik, Enhanced-fluidity liquid chromatography: connecting the dots between supercritical fluid chromatography, conventional subcritical fluid chromatography, and HPLC, Lc Gc N. Am. (2015) 39–44.
[20] D.R. Stoll, K. Shoykhet, P. Petersson, S. Buckenmaier, Active solvent modulation: A valve-based approach to improve separation compatibility in two-dimensional liquid chromatography, Anal. Chem. 89 (2017) 9260–9267.
[21] G.S. Walker, T.N. O’Connell, Comparison of LC-NMR and conventional NMR for
structure elucidation in drug metabolism studies, Expert Opin. Drug Met. 4
(2008) 1295–1305.
[22] M.V.S. Elipe, Advantages and disadvantages of nuclear magnetic resonance
spectroscopy as a hyphenated technique, Anal. Chim. Acta. 497 (2003) 1–25.
[23] S. van Meerten, F. van Zelst, K. Tijssen, A. Kentgens, An optimized NMR
stripline for sensitive supercritical fluid chromatography-nuclear magnetic resonance of microliter sample volumes, Anal. Chem. 92 (2020) 13010–13016.
[24] F.H.M. van Zelst, S.G.J. van Meerten, A.P.M. Kentgens, Characterising polar compounds using supercritical fluid chromatography-nuclear magnetic resonance
spectroscopy (SFC-NMR), Faraday Discuss 218 (2019) 219–232.
Supplementary materials
Supplementary material associated with this article can be
found, in the online version, at doi:10.1016/j.chroma.2021.462642.
References
[1] C. West, Current trends in supercritical fluid chromatography, Anal. Bioanal.
Chem. 410 (2018) 6441–6457.
[2] L. Novakova, A.G.G. Perrenoud, I. Francois, C. West, E. Lesellier, D. Guillarme,
Modern analytical supercritical fluid chromatography using columns packed
with sub-2 mu m particles: A tutorial, Anal. Chim. Acta. 824 (2014) 18–35.
[3] H.K. Vlckova, V. Pilarova, P. Svobodova, J. Plisek, F. Svec, L. Novakova, Current
state of bioanalytical chromatography in clinical analysis, Analyst 143 (2018)
1305–1325.
[4] C. West, E. Lemasson, S. Bertin, P. Hennig, E. Lesellier, An improved classification of stationary phases for ultra-high performance supercritical fluid chromatography, J. Chromatogr. A 1440 (2016) 212–228.
[5] L. Akbal, G. Hopfgartner, Hyphenation of packed column supercritical fluid
chromatography with mass spectrometry: where are we and what are the remaining challenges? Anal. Bioanal. Chem. 412 (2020) 6667–6677.
[6] F.H.M. van Zelst, S.G.J. van Meerten, P.J.M. van Bentum, A.P.M. Kentgens, Hyphenation of supercritical fluid chromatography and NMR with in-Line sample
concentration, Anal. Chem. 90 (2018) 10457–10464.
[7] T.A. Berger, B.K. Berger, Minimizing UV noise in supercritical fluid chromatography. I. Improving back pressure regulator pressure noise, J. Chromatogr. A
1218 (2011) 2320–2326.
[8] D. Guillarme, V. Desfontaine, S. Heinisch, J.L. Veuthey, What are the current solutions for interfacing supercritical fluid chromatography and mass spectrometry? J. Chromatogr. B 1083 (2018) 160–170.
[9] I. Francois, A.D. Pereira, F. Lynen, P. Sandra, Construction of a new interface
for comprehensive supercritical fluid chromatography x reversed phase liquid
chromatography (SFC x RPLC), J. Sep. Sci. 31 (2008) 3473–3478.
[10] V. Pepermans, J. De Vos, S. Eeltink, G. Desmet, Peak sharpening limits of
solvent-assisted post-column refocusing to enhance detection limits in liquid
chromatography, J. Chromatogr. A 1586 (2019) 52–61.
11