Membrane-based liquid-phase microextraction of basic pharmaceuticals – A study on the optimal extraction window
Bạn đang xem bản rút gọn của tài liệu. Xem và tải ngay bản đầy đủ của tài liệu tại đây (1.82 MB, 8 trang )
Journal of Chromatography A 1664 (2022) 462769
Contents lists available at ScienceDirect
Journal of Chromatography A
journal homepage: www.elsevier.com/locate/chroma
Membrane-based liquid-phase microextraction of basic
pharmaceuticals – A study on the optimal extraction window
Maria Schüller a, Kim Tu Thi Tran a, Elisabeth Leere Øiestad a,b, Stig Pedersen-Bjergaard a,c,∗
a
Department of Pharmacy, University of Oslo, P.O. Box 1068 Blindern, 0316 Oslo, Norway
Oslo University Hospital, Division of Laboratory Medicine, Department of Forensic Sciences, P.O. Box 4459 Nydalen, 0424, Oslo, Norway
c
Department of Pharmacy, Faculty of Health and Medical Sciences, University of Copenhagen, Universitetsparken 2, 2100 Copenhagen, Denmark
b
a r t i c l e
i n f o
Article history:
Received 5 July 2021
Revised 10 December 2021
Accepted 20 December 2021
Available online 23 December 2021
Keywords:
Sample preparation
Liquid-phase microextraction
Hollow fiber
Pharmaceuticals
Deep eutectic solvents
a b s t r a c t
The present paper defines the optimal extraction window (OEW) for three-phase membrane-based liquidphase microextraction (MP-LPME) in terms of analyte polarity (log P), and anchors this to existing theories for equilibrium partitioning and kinetics. Using deep eutectic solvents (DES) as supported liquid
membranes (SLM), we investigated how the OEW was affected by ionic-, hydrogen bond and π -π interactions between the SLM and analyte. Eleven basic model analytes in the range -0.4 < log P < 5.0 were
extracted by MB-LPME in a 96-well format. Extraction was performed from 250 μL standard solution
in 25 mM phosphate buffer (pH 7.0) into 50 μL of 10 mM HCl acceptor solution (pH 2.0) with mixtures of coumarin, camphor, DL-menthol, and thymol, with and without the ionic carrier di(2-ethylhexyl)
phosphate (DEHP), as the SLM. The OEW with pure DES was in the range 2 < log P < 5, and low SLM
aromaticity was favorable for the extraction of non-polar analytes. Here, extraction recoveries up to 98%
were obtained. Upon addition of DEHP to the SLMs, the OEW shifted to the range -0.5 < log P < 2, and
a combination of 5% DEHP and moderate aromaticity resulted in extraction recoveries up to 80% for the
polar analytes. Extraction with ionic carrier was inefficient for the non-polar analytes, due to excessive
trapping in the SLM. The results from our study show that LPME performs optimally in a relatively narrow log P-window of ≈ 2–3 units and that the OEW is primarily affected by ionic carrier and aromaticity.
© 2021 The Author(s). Published by Elsevier B.V.
This is an open access article under the CC BY license ( />
1. Introduction
Microextraction techniques like liquid-phase microextraction
(LPME) are popular choices for the extraction of targeted analytes
from biological matrices. Offering low consumption of organic solvents and the potential for automation, they are favorable with
regards to greenness and efficiency in high-throughput applications [1]. Current efforts focus on the implementation of LPME in
routine laboratories, including the commercialization of equipment
and better understanding of the optimal area of use. This work will
focus on the latter.
LPME can be performed with both two and three phases where
the former is based on the partition of a substance between two
immiscible liquids, like an aqueous sample and organic acceptor
solution. In a three-phase system, a second aqueous phase is introduced as the acceptor, allowing for the yield of cleaner extracts
and better HPLC compatibility [2]. The principle is based on liquid-
∗
Corresponding author.
E-mail address: (S. Pedersen-Bjergaard).
liquid extraction with back extraction, with a configuration allowing the extraction to take place in a single step [3]. Fig. 1B illustrates the basic principle with two aqueous phases, the donor,
and acceptor, separated by an immiscible organic supported liquid membrane (SLM). In a typical scheme for basic analytes, like
many pharmaceutical drugs, the donor is alkaline, and the acceptor is acidic. A high pH in the donor promotes the extraction of
the analyte as a neutral species into the SLM, while a low pH in
the acceptor promotes extraction and collection of the same analyte as the protonated species. Extraction recovery will depend on
the partition between these three phases [3]. Extraction in a threephase system is typically used for organic analytes with weak base
or acid properties.
An array of configurations for LPME has been developed
through the years, each with specific advantages and limitations.
Beginning in 1996, pioneering work for two-phase LPME was
conducted by Dasgupta [4] and Cantwell [5] with the introduction of single-drop microextraction (SDME), where a drop of organic liquid is immersed into an aqueous sample. Another important milestone in the field of microextraction, pioneered by
Pedersen-Bjergaard and Rasmussen, was the introduction of the
/>0021-9673/© 2021 The Author(s). Published by Elsevier B.V. This is an open access article under the CC BY license ( />
M. Schüller, K.T.T. Tran, E.L. Øiestad et al.
Journal of Chromatography A 1664 (2022) 462769
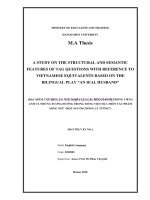
Fig. 1. A) Membrane-based liquid phase microextraction in 96-well format. B) The principle of three-phase liquid-phase microextraction. For the extraction of basic analytes
the donor is alkalized to deprotonate the base. The neutral analyte diffuses across the SLM and is protonated in the acidic acceptor solution.
membrane-based technique hollow-fiber liquid-phase microextraction (HF-LPME), which initiated the development of three-phase
microextraction systems [6]. In later years, several alternatives
have been developed, including dispersive liquid-liquid microextraction (DLLME) [7], dispersive liquid-liquid microextraction based
on solidified floating organic droplets (DLLME-SFO) [8], solvent
bar microextraction (SBME) [9], and other membrane-based techniques such as membrane-based LPME (MB-LPME) in a 96-well format [10,11] and electromembrane extraction (EME) [12,13]. In the
present study, MB-LPME in a 96-well format was used (Fig. 1A).
LPME has been applied in various fields of health and life
science, such as pharmacology [14], forensics [15], environmental
chemistry [16], clinical chemistry [17], toxicology [18], and antidoping control [19] with scientific publications steadily increasing
from the mid-’90s until today. Although LPME has kept its relevance, implementation into routine laboratories has still not been
facilitated. One reason is the need for commercialized equipment,
such as seen for solid-phase microextraction (SPME). While LPME
equipment is still not commercially available, equipment for EME
is very close to market, and when used without voltage, it operates
as a MB-LPME system [20]. Another reason is the need for generic
methods, where molecular descriptors can be used to predict and
select appropriate standardized extraction conditions for given analytes. Although a large number of validated applications have
been published [21–25], development of generic methods from this
material is difficult. Extractions have been done using very different experimental conditions, and performances have not been anchored sufficiently in fundamental understanding about partitioning and molecular interactions.
Therefore, in the present work we have looked into LPME again,
now from a highly fundamental angle. We have studied the extraction of selected basic pharmaceuticals as model analytes in the log
P range from −0.4 to 5.0, using selected deep eutectic solvents as
the SLM. With the latter, hydrogen bonds, π -π -, and ionic interactions were controlled and varied systematically. For each SLM, we
investigated (1) which model analytes suffered from poor partition
into the SLM, (2) which model analytes were extracted efficiently
across the SLM, and (3) which model analytes suffered from poor
partition from SLM and into the acceptor. Model analytes belonging to (2) were within the optimal extraction window (OEW) of
each SLM, and OEWs were assigned for different SLMs based on
molecular interactions and analyte log P as a single molecular descriptor. The purpose of this was to develop a starting point for
the development of generic methods. The work is therefore fundamental and general, and extractions were conducted only from
pure standard solutions. Applications, quantifications in biological
fluids, method development, and validation, which are required to
develop the final generic methods, will follow in future papers. The
intention is that the current paper will serve as fundamental reference.
2. Experimental
2.1. Chemicals and reagents
Coumarin, thymol, camphor, DL-menthol, di(2-ethylhexyl) phosphate, hydrochloride acid 37%, sotalol hydrochloride, metaraminol
bitartrate, atenolol, tyramine, ephedrine hydrochloride, metoprolol tartrate, pethidine hydrochloride, haloperidol, nortriptyline hydrochloride, loperamide hydrochloride, and methadone hydrochloride were purchased from Sigma-Aldrich (St. Louis, MO, USA).
Sodium hydroxide, acetonitrile (HPLC grade), and formic acid 99%
(LC-MS grade) were purchased from VWR (Radnor, PA, USA).
Deionized water was obtained with a Milipak® (0.22 μm filter) purification system from Milli-Q (Molsheim, France).
Individual stock solutions of each analyte were prepared at concentrations of 1–4 mg mL−1 and dissolved in pure deionized water
or 30% v/v methanol in deionized water. From these, a polar analyte mix (sotalol, metaraminol, atenolol, tyramine, ephedrine, and
metoprolol) and a non-polar analyte mix (pethidine, haloperidol,
nortriptyline, loperamide, and methadone) were prepared with analyte concentrations of 10 μg mL−1 in 25 mM phosphate buffer.
These analyte mixes were pipetted into the donor wells. The final
methanol concentration never exceeded 0.3% and was not assumed
to affect extraction recoveries. To calculate the recovery, a 50 μg
mL−1 standard polar mix and 50 μg mL−1 standard non-polar mix
were prepared in 10 mM HCl. All solutions were stored at 4 °C and
protected from light.
DES were prepared by weighing and mixing appropriate
amounts of HBA components (coumarin or camphor) and HBD
components (thymol or DL-menthol) in molar ratios of 1:1 and 1:2.
The mixtures were heated in an oven (80 °C) for approximately
10 min and vortexed until homogenous. In SLMs with ionic carrier,
DEHP was added to the DES mixtures in volume ratios of 0.5, 2, 5,
or 10%.
2.2. Liquid-phase microextraction procedure
The equipment used is previously described in [22]. The extraction was performed with a 96-well polypropylene donor plate
with 0.5 mL wells from Agilent (Santa Clara, CA, USA). The acceptor plate was a 96-well MultiScreen-IP filter plate from Merck
Millipore (Carrigtwohill, Ireland). The membrane material was
polyvinylidene fluoride (PVDF) with a pore size of 0.45 μm. A
Platemax Pierceable Aluminum Sealing Film (Axygen, Union City,
2
M. Schüller, K.T.T. Tran, E.L. Øiestad et al.
Journal of Chromatography A 1664 (2022) 462769
CA, USA) was used to seal the acceptor plate. Agitation during extraction was accomplished with a Vibramax 100 agitation system
from Heidolph (Kellheim, Germany).
The extraction was performed by pipetting 250 μL of standard
solution into the well of the donor plate. The filter on the acceptor
plate was impregnated with 4 μL of DES, creating the SLM. Acceptor solution (50 μL) was pipetted into the wells of the acceptor
plate. The acceptor and donor plate were clamped together and
sealed with adhesive foil. The whole set-up was placed into the
agitation device for extraction for 60 min at 900 rpm. After extraction, the donor and acceptor solution were collected and analyzed
with HPLC-UV. Details to the use of the extraction unit are provided in Supplementary Section 2.
3.1. Extraction theory and definition of optimal extraction window
The partition coefficient K1 between the donor and the SLM can
be written as:
K1 =
K2 =
K=
Here, Ca, f inal and Cd,initial are the concentrations in the acceptor
after the extraction and the concentration of analyte in the donor
before the extraction, respectively. The terms Va and Vd denote the
volume of the acceptor and donor, respectively.
Table 1
Physical-chemical properties of the studied drugs.
pKa
−3.2
−2.5
−2.8
−2.0
−1.9
−1.5
−1.1
0.2
1.2
1.3
1.5
9.43
9.68
9.67
9.66
9.52
9.67
8.16
8.05
10.47
9.41
9.12
(5)
ASLM DSLM K1
t
Vd h
(6)
Here, Cd (t ) is the concentration in the donor as a function of
time, Cd0 is the initial concentration in the donor (t = 0), ASLM is
the surface area of the SLM, h is the thickness of the SLM, and
DSLM is the diffusion coefficient of the analyte in the SLM.
Exact values of K1 and K2 are generally not available, unless 1octanol is used as the SLM. With 1-octanol, computer-generated
log P and log D values can be used to describe the efficiency of a
three-phase LPME system. K1 is equal to P for the neutral species,
while K2 is set to 1/D for the species at pH 2.
Selecting three compounds with different log P and log D values
from our set of model analytes, namely methadone, pethidine, and
sotalol, the phase distribution for t = 60 min was calculated based
on Eq. (5) and Eq. (6) using computer-generated log P and log D
values [28]. Details of the calculations are found in Supplementary
Section 3. For methadone, log P is 5.0, while log D at pH 2 is 1.5.
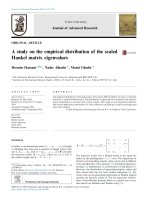
The calculated distribution is illustrated in Fig. 2. The donor is depleted, 70% is trapped in the SLM, and only 30% of the analyte is
extracted into the acceptor. Because methadone is non-polar, K1 is
large, and the donor is therefore rapidly depleted. Correspondingly,
K2 is small, causing methadone to suffer from serious membrane
trapping. Similar behavior is expected for other analytes with log
P higher than 3.5, including loperamide and nortriptyline from our
set of model analytes, with 1-octanol as the SLM. After 60 min, the
extraction system has entered equilibrium, and membrane trapping remains unaffected upon extension of the extraction time.
For sotalol, log P and log D are −0.4 and −3.2, respectively. Sotalol is a polar substance; K1 is low, while K2 is high. Therefore,
partition into the SLM is highly unfavorable, and mass transfer is
correspondingly slow. After 60 min of extraction, 99% of sotalol is
Eleven drug compounds were selected as model analytes with
−0.4 < log P < 5.0. This range was chosen, as it represents a common range for small-molecule drugs [26]. Polar analytes were defined as having log P < 2.0 and non-polar analytes were defined
as having log P > 2.0. Analyte log P, log D at pH 2, and pKa values
are shown in Table 1.
Log D (pH 2)
K × Va
× 100%
K × Va + K1 × VSLM + Vd
Cd (t ) = Cd0 · exp −
3. Results and discussion
−0.4
−0.1
0.4
0.7
1.3
1.8
2.5
3.7
4.4
4.7
5.0
(4)
Here, Va , Vd , and VSLM denote the volumes of the acceptor,
donor, and SLM, respectively.
Eq. (4) is valid for estimating extraction recoveries when the
system has entered equilibrium. The time required to reach equilibrium is compound-dependent. Previous work has shown that
partition into the SLM often is the rate-limiting factor in threephase LPME [27]. Thus, kinetics are controlled by K1 , and can be
modelled using the following equation:
(1)
Log P
Ceq,a
= K1 × K2
Ceq,d
R (% ) =
The extraction recovery was calculated by Eq. (1):
Sotalol
Metaraminol
Atenolol
Tyramine
Ephedrine
Metoprolol
Pethidine
Haloperidol
Nortriptyline
Loperamide
Methadone
(3)
Assuming that K is unaffected by the organic phase, K2 is decreasing when K1 is increasing, and vice versa.
Based on the partition coefficients, the theoretical extraction recovery in three-phase LPME may be calculated by:
2.4. Calculations
Drug compound
Ceq,a
Ceq,SLM
Here, Ceq,a is the equilibrium concentration in the acceptor. The
overall partition coefficient K between the donor and acceptor can
be expressed as the product of K1 and K2 :
HPLC-UV analysis was performed on a 30 0 0 Ultimate HPLCUV (Thermo Fisher Scientific, Waltham, MA, USA) with an Acquity
UPLC HSS T3 (2.1 mm I.D × 150 mm, 1.8 μm particle size) purchased from Waters (Wexford, Ireland). Mobile phase A consisted
of 0.1% formic acid in 95:5 deionized water/methanol (v/v). Mobile
phase B consisted of 0.1% formic acid in 95:5 methanol/deionized
water (v/v). Further details on the elution gradients, detection parameters and chromatograms are provided in Supplementary Section 1.
Ca, f inal
Va
×
× 100%
Cd,initial
Vd
(2)
Here, Ceq,d and Ceq,SLM are the equilibrium concentrations in the
donor and SLM, respectively. Correspondingly, the partition coefficient K2 between the SLM and acceptor can be written as:
2.3. High performance liquid chromatography with UV-detection
R=
Ceq,SLM
Ceq,d
Chemicalize was used to generate structure properties (retrieved 27.02.2021,
) developed by ChemAxon (maxon.
com) [28].
3
M. Schüller, K.T.T. Tran, E.L. Øiestad et al.
Journal of Chromatography A 1664 (2022) 462769
(aromatic ring count). Mixtures of coumarin and DL-menthol did
not form stable deep eutectic mixtures, seen as precipitation after
heating, and were therefore not tested. DES compositions with or
without ionic carrier were selected based on literature and previous experience [31–33].
3.3. Pure eutectic solvents
In the first set of experiments, the effect of hydrogen bond interactions was investigated using SLMs with different HBA/HBD ratios and an aromatic ring count equal to zero. Two SLMs were
compared, namely camphor:DL-menthol in molar ratios 1:1 and
1:2 (HBA/HBD ratio 2.0 and 1.5, respectively). To establish mass
balance data, both the acceptor and the donor were analyzed.
Experimental data obtained with camphor:DL-menthol (1:1) are
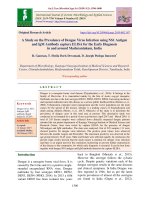
summarized in Fig. 3A. The results were in accordance with the
theoretical discussion in Section 3.1. The polar model analytes sotalol, metaraminol, atenolol, tyramine, ephedrine, metoprolol, and
pethidine largely remained in the donor. These compounds, representing the log P range from −0.4 to 2.5, suffered from slow kinetics. For haloperidol, nortriptyline, loperamide, and methadone,
with log P values between 3.7 and 5.0, recoveries were generally
high, and this indicated that the extraction was under ideal or
near-ideal conditions in the OEW. When the molar ratio of camphor and DL-menthol was changed from 1:1 to 1:2 (results shown
in Fig. 3B), the HBA/HBD ratio decreased from 2.0 to 1.5. The OEW
was seemingly unaffected, but the overall membrane trapping increased for the model analytes within this region. Since the aromatic ring count was zero with both SLMs, the slight increase in
membrane trapping was caused by increased HBD activity.
In a next set of experiments, the effect of aromatic ring count
was investigated. Three different SLMs were compared, namely
coumarin:thymol, camphor:thymol, and camphor:DL-menthol, all
in molar ratios of 1:1. These SLMs represented three, one, and zero
aromatic ring counts, respectively, while the HBA/HBD ratio was
2.0 in all cases.
Experimental data obtained with coumarin:thymol (1:1) are
summarized in Fig. 3C. This SLM was highly aromatic, with a ring
count of three. Sotalol, metaraminol, atenolol, tyramine, ephedrine,
and metoprolol (−0.4 < log P < 1.8) were prone to slow kinetics.
Pethidine (log P = 2.5), however, was extracted with 65% recovery
and was within the OEW for this SLM. For haloperidol, nortriptyline, loperamide, and methadone, with log P between 3.7 and 5.0,
mass balance data verified significant membrane trapping in the
range between 64 and 100%. With camphor:thymol (1:1) (Fig. 3D),
the aromatic ring count was one. Again, the polar analytes in the
range −0.4 < log P < 1.8 suffered from slow kinetics and were
not extracted from the donor. Here, the OEW was shifted towards
lower log P values compared to previously discussed SLMs. The analytes in the log P range from 2.5 to 5.0 were extracted to some
extent, but membrane trapping still dominated. This was especially evident for loperamide, possibly due to strong π -π interactions between the SLM (ring count one) and loperamide (ring
count three).
With camphor:DL-menthol (1:1), the SLM was non-aromatic.
Pethidine was no longer within the OEW, while haloperidol, nortriptyline, loperamide, and methadone were all extracted with high
recoveries (Fig. 3A). Since all the non-polar model analytes are aromatic, the change to a non-aromatic SLM increased their extraction into the acceptor. Therefore, the optimal extraction window
was shifted slightly towards higher log P. Loperamide was now extracted with high recovery, most probably because the π -π interactions were absent. No significant membrane trapping was observed for this SLM, but is assumed to be present above the tested
log P range.
Fig. 2. Calculated relative amounts of sotalol, pethidine, and methadone found
in the donor (blue), SLM (yellow), and recovered in the acceptor (green) with
t = 60 min.
still left in the donor, and extraction is limited by slow kinetics.
With 1-octanol as the SLM, slow kinetics is to be expected for all
substances with log P below 2.0. Recoveries can be improved by
increasing extraction time, and theoretically, exhaustive extraction
is achieved at the end. However, this requires extraction far beyond
60 min, which is of little relevance for analytical applications.
For pethidine, log P and log D are 2.5 and −1.0, respectively.
Compared to methadone, K1 is lower and K2 is higher. Due to this,
the balance between K1 and K2 is more appropriate, and the equilibrium distribution is much more in favor of high recovery for
pethidine (Fig. 2). With K1 sufficiently high to prevent slow kinetics, without causing membrane trapping, the analytes are extracted
under ideal conditions. With 1-octanol as the SLM, similar behavior
is expected for other analytes with log P in the range of 2.0 to 3.5.
This is the optimal extraction window (OEW) for 1-octanol, where,
in theory, exhaustive extraction is to be expected.
Although the partition coefficients change if 1-octanol is replaced by another solvent, the principles discussed above are still
valid. The here described theoretical trends have also been observed in previous literature [29,30]. Thus, a given SLM solvent has
an OEW, where K1 and K2 are balanced and exhaustive extraction
can be expected. More polar analytes (low K1 ) are expected to suffer from slow kinetics, while more non-polar analytes (low K2 ) are
prone to membrane trapping.
In the following, OEWs were established for different SLMs,
with reference to analyte log P.
3.2. Tuning SLM properties with deep eutectic solvents
OEWs were investigated with different deep eutectic solvents
(DES), also including combinations with DEHP as the ionic carrier. This enabled individual assessment of hydrogen bond-, π -π , and ionic interactions, and their impact on the OEW. Four eutectic components, two HBA components, and two HBD components were mixed in molar ratios of 1:1 and 1:2. Coumarin and
camphor were selected as HBA components, while thymol and DLmenthol were selected as HBD components. Coumarin and thymol,
provided aromatic character to the deep eutectic solvents. Table 2
gives an overview of the tested membrane compositions, including the number of HBA and HBD sites, and aromatic properties
4
M. Schüller, K.T.T. Tran, E.L. Øiestad et al.
Journal of Chromatography A 1664 (2022) 462769
Fig. 3. Relative amounts of model analyte found in the donor (blue), SLM (yellow), and recovered in the acceptor (green) after 60 min of extraction for A) camphor:DLmenthol (1:1) and B) camphor:DL-menthol (1:2), C) coumarin:thymol (1:1), D) camphor:thymol (1:1) The error bars represent the standard deviation (SD) of the acceptor
with n = 4.
mine, and ephedrine and the non-polar analytes haloperidol, nortriptyline, and loperamide were all extracted with low recoveries
(<30%). As observed in the mass balance data the majority of analyte was trapped in the SLM. Satisfactory extraction recoveries
(> 60%), were measured for the non-polar analytes pethidine and
methadone. The data show no apparent correlation with analyte
log P values. When increasing the DEHP percentage to 2% (See
3.4. Eutectic solvents with DEHP
In the next set of experiments, the effect of ionic interactions
was investigated by adding 0.5, 2, 5, and 10% DEHP to the nonaromatic SLM camphor:DL-menthol (1:1).
Experimental data obtained with 0.5% DEHP are summarized
in Fig. 4A. The polar analytes sotalol, metaraminol, atenolol, tyra5
M. Schüller, K.T.T. Tran, E.L. Øiestad et al.
Journal of Chromatography A 1664 (2022) 462769
Fig. 4. Relative amounts of model analyte found in the donor (blue), SLM (yellow), and recovered in the acceptor (green) after 60 min of extraction for A) camphor:DLmenthol (1:1) + 0.5% DEHP, B) camphor:DL-menthol (1:1) + 2% DEHP, C) camphor:DL-menthol (1:1) + 5% DEHP, and D) camphor:DL-menthol (1:1) + 10% DEHP, E)
camphor:DL-menthol (1:1) + 5% DEHP, F) camphor:thymol (1:1) + 5% DEHP, and G) coumarin:thymol (1:1) + 5% DEHP. Sample size n = 4. The error bars represent the
standard deviation (SD) of the acceptor with n = 4.
6
M. Schüller, K.T.T. Tran, E.L. Øiestad et al.
Journal of Chromatography A 1664 (2022) 462769
Table 2
Overview of tested membranes, including computer-generated HBA sites, HBD sites, aromatic ring count, and molecular structures of the eutectic components.
SLM composition
HBA sitesa
HBD sitesa
Aromatic
ring counta
Ionic carrier
(Y/N)
Coumarin:thymol (1:1)
Camphor:thymol (1:1)
Camphor: DL-menthol (1:1)
Camphor: DL-menthol (1:2)
Camphor: DL-menthol (1:1) + 0.5% DEHP
Camphor: DL-menthol (1:1) + 2% DEHP
Camphor: DL-menthol (1:1) + 5% DEHP
Coumarin:thymol (1:1) + 5% DEHP
Camphor:thymol (1:1) + 5% DEHP
Camphor: DL-menthol (1:1) + 10% DEHP
2
2
2
3
2
2
2
2
2
3
1
1
1
2
1
1
1
1
1
2
3
1
0
0
0
0
0
3
1
0
N
N
N
N
Y
Y
Y
Y
Y
Y
Coumarin
Camphor
DL-menthol
Thymol
DEHP
a
Chemicalize was used to generate structure properties (assessed by 01.2020, ) developed by ChemAxon ()
[28].
est extraction recoveries were obtained for camphor:thymol + 5%
DEHP (Fig. 4F). This SLM has an aromatic ring count equal to one.
Further increasing or decreasing the aromatic ring count increased
the amount of membrane trapping. This SLM was the overall best
for the polar analytes. For the non-polar analytes, the increase
in aromatic ring count decreased the extraction recoveries due to
membrane trapping. This shows that aromatic SLMs in combination with DEHP are highly unfavorable for the extraction of nonpolar analytes.
Fig. 4B), the extraction recoveries of the polar analytes generally
increased. The increase was both due to increased donor depletion and decreased membrane trapping. Extraction recoveries all
decreased for the non-polar analytes. From the mass balance data,
it is evident that this was due to an increase in membrane trapping.
For higher DEPH concentrations, namely 5 and 10%, similar observations were made (Fig. 4C and 4D). The extraction recoveries of
the polar analytes were around 50%, except for atenolol, which suffered from membrane trapping. For the majority of the non-polar
analytes, the recoveries were below 10%, and mass balance data revealed serious membrane trapping. Pethidine was extracted close
to ideal conditions when DEPH concentrations were high, while
the extraction recovery of methadone fluctuated with the higher
DEPH concentrations.
From the obtained mass balance data, addition of DEHP generally increased the extraction of polar analytes from 5- to a 50%level. This shows that ionic interactions are essential for the extraction of these analytes, even with deep eutectic solvents. DEHP
increases the partition into the SLM, and the donor is depleted.
For the non-polar analytes, except pethidine and methadone, the
addition of an ionic carrier significantly increased the amount of
membrane trapping. For nortriptyline, as an example, membrane
trapping increased from 20 to 93% upon addition of 10% DEHP.
It is suspected that the ion exchange at the membrane-acceptor
interface is too weak to accommodate for the strong ionic and
hydrophobic interactions between the non-polar analytes and the
SLM. Pethidine and methadone are behaving similarly to the polar
analytes, where higher DEHP concentrations increased donor depletion.
In the last set of experiments, the combined effect of aromaticity and ionic interactions were investigated. Hydrogen bonding was
not investigated further, as previous experiments revealed an insignificant effect on the OEW. For this last set of experiments,
5% DEHP was added to coumarin:thymol, camphor:thymol, and
camphor:DL-menthol, all in molar ratios of 1:1. These SLMs represented zero, one, and three aromatic ring counts, respectively;
while the HBA/HBD ratio was equal to 2.0 in all SLMs. Mass balance data are shown in Fig. 4. For the polar analytes, the high-
4. Conclusion
In the present study, we proposed the terms optimal extraction window (OEW), slow kinetics, and membrane trapping, to
express the log P range where a given three-phase membranebased liquid-phase microextraction (MB-LPME) system can be expected to be optimal. We investigated a selection of supported liquid membranes (SLM) based on deep eutectic solvents (DES) with
varying HBA/HBD and aromatic ring count, and established their
OEWs using a set of pharmaceutical drugs (−0.4 < log P < 5.0)
as model analytes. With pure DES, extraction was primarily facilitated by hydrogen bond and π -π interactions, and the OEWs
were typically within the range 2 < log P < 5. Model analytes
with log P < ∼2 suffered from slow kinetics, while model analytes
with log P > ∼3.5 were prone to membrane trapping. OEWs were
slightly affected by the HBA/HBD ratio and shifted towards higher
log P values with increasing aromatic ring count. Within the OEWs,
the model analytes were extracted with high recoveries, except for
highly aromatic ones, which were prone to strong π -π interactions
and membrane trapping. Although the pure DES were strong solvents regarding hydrogen bond and π -π interactions, they were
insufficient for the extraction of polar analytes (log P < 2). With
the addition of ionic carrier (DEHP) to the SLMs, polar analytes
were efficiently extracted and the OEWs shifted to the range −0.5
< log P < 2. The SLM with 5% DEHP and moderate aromaticity resulted in extraction recoveries of up to 80% for the polar analytes.
For the non-polar analytes, however, the same SLM suffered from
membrane trapping. The results from our study show that a given
three-phase liquid-phase microextraction system is efficient only
7
M. Schüller, K.T.T. Tran, E.L. Øiestad et al.
Journal of Chromatography A 1664 (2022) 462769
in a relatively narrow log P range within the optimal extraction
window (OEW). Minor shifts of the OEW can be expected from alterations of HBA, HBD, and aromatic ring count, while major shifts
can be expected when introducing ionic carriers.
Identifying OEWs for different SLMs is a step towards a better understanding of LPME. In the future, this can help users in
routine laboratories to define the possibilities and limitations of a
given LPME system. More research on SLMs with an added carrier is planned to increase knowledge on carrier-mediated LPME.
This will help developing better theoretical models to predict operational conditions and performance.
˚
[11] L. Vårdal, G. Wong, A.M.L.
Øiestad, S. Pedersen-Bjergaard, A. Gjelstad, E.L. Øiestad, Rapid determination of designer benzodiazepines, benzodiazepines, and
Z-hypnotics in whole blood using parallel artificial liquid membrane extraction and UHPLC-MS/MS, Anal. Bioanal. Chem. 410 (2018) 4967–4978.
[12] L. Vårdal, E.L. Øiestad, A. Gjelstad, S. Pedersen-Bjergaard, Electromembrane extraction of substances with weakly basic properties: a fundamental study with
benzodiazepines, Bioanalysis 10 (2018) 769–781.
[13] S. Pedersen-Bjergaard, K.E. Rasmussen, Electrokinetic migration across artificial liquid membranes. New concept for rapid sample preparation of biological
fluids, J. Chromatography A 1109 (2006) 183.
[14] P.K. Jagtap, K. Tapadia, Pharmacokinetic determination and analysis of nortriptyline based on GC–MS coupled with hollow-fiber drop-to-drop solvent microextraction technique, Bioanalysis 10 (2018) 143–152.
[15] T. Kuuranne, T. Kotiaho, S. Pedersen-Bjergaard, K.Einar Rasmussen, A. Leinonen,
S. Westwood, R. Kostiainen, Feasibility of a liquid-phase microextraction
sample clean-up and liquid chromatographic/mass spectrometric screening
method for selected anabolic steroid glucuronides in biological samples, J.
Mass Spectrometry 38 (2003) 16–26.
[16] E. Zeini Jahromi, A. Bidari, Y. Assadi, M.R. Milani Hosseini, M.R. Jamali, Dispersive liquid–liquid microextraction combined with graphite furnace atomic
absorption spectrometry: ultra trace determination of cadmium in water samples, Anal. Chim. Acta 585 (2007) 305–311.
[17] L. Dong, X. Shen, C. Deng, Development of gas chromatography–mass spectrometry following headspace single-drop microextraction and simultaneous
derivatization for fast determination of the diabetes biomarker, acetone in human blood samples, Anal. Chim. Acta 569 (2006) 91–96.
[18] I. Kohler, J. Schappler, T. Sierro, S. Rudaz, Dispersive liquid–liquid microextraction combined with capillary electrophoresis and time-of-flight mass spectrometry for urine analysis, J. Pharm. Biomed. Anal. 73 (2013) 82–89.
[19] Z. Zhang, D. Wang, L. Zhang, M. Du, G. Chen, Determination of diuretics in human urine by hollow fiber-based liquid-liquid-liquid microextraction coupled
to high performance liquid chromatography, Analyst 133 (2008) 1187–1194.
[20] M. Drobnjak, F.A. Hansen, E. Øiestad, T. Løvli, R. Trones, Ø. Martinsen, S. Pedersen-Bjergaard, Electromembrane extraction with vials of conducting polymer,
LC GC N Am 38 (2020) 435.
[21] M.F. dos Santos, C.C. Ferri, S.C. Seulin, V. Leyton, C.A.G. Pasqualucci,
D.R. Muñoz, M. Yonamine, Determination of antidepressants in whole blood
using hollow-fiber liquid-phase microextraction and gas chromatography–mass
spectrometry, Forensic Toxicol. 32 (2014) 214–224.
[22] K.S. Ask, M. Lid, E.L. Øiestad, S. Pedersen-Bjergaard, A. Gjelstad, Liquid-phase
microextraction in 96-well plates - calibration and accurate quantification of
pharmaceuticals in human plasma samples, J. Chromatography A 1602 (2019)
117–123.
[23] R.A. Menck, C.D.R. de Oliveira, D.S. de Lima, L.E. Goes, V. Leyton,
C.A. Pasqualucci, D.R. Muñoz, M. Yonamine, Hollow fiber–liquid phase microextraction of barbiturates in liver samples, Forensic Toxicol. 31 (2013) 31–36.
[24] J. Zhang, M. Zhang, S. Fu, T. Li, S. Wang, M. Zhao, W. Ding, C. Wang, Q. Wang,
Simultaneous determination of imperatorin and its metabolite xanthotoxol in
rat plasma by using HPLC–ESI-MS coupled with hollow fiber liquid phase microextraction, J. Chromatogr. B 945-946 (2014) 185–192.
[25] S. Yudthavorasit, C. Chiaochan, N. Leepipatpiboon, Simultaneous determination
of multi-class antibiotic residues in water using carrier-mediated hollow-fiber
liquid-phase microextraction coupled with ultra-high performance liquid chromatography tandem mass spectrometry, Microchimica Acta 172 (2011) 39–49.
[26] S. Knoll, T. Rösch, C. Huhn, Trends in sample preparation and separation methods for the analysis of very polar and ionic compounds in environmental water
and biota samples, Anal. Bioanal. Chem. 412 (2020) 6149–6165.
[27] A. Gjelstad, H. Jensen, K.E. Rasmussen, S. Pedersen-Bjergaard, Kinetic aspects
of hollow fiber liquid-phase microextraction and electromembrane extraction,
Anal. Chim. Acta 742 (2012) 10–16.
[28] "Chemicalize." Access date: 27.02.2021, from .
[29] S.
Pedersen-Bjergaard,
K.E.
Rasmussen,
A.
Brekke,
T.S.
Ho,
T.Grønhaug Halvorsen, Liquid-phase microextraction of basic drugs – selection of extraction mode based on computer calculated solubility data, J.
Sep. Sci. 28 (2005) 1195–1203.
[30] S. Pedersen-Bjergaard, T. Ho, K. Rasmussen, Fundamental studies on selectivity
in 3-phase liquid-phase microextraction (LPME) of basic drugs, J. Sep. Sci. 25
(2002) 141–146.
[31] F.A. Hansen, E. Santigosa-Murillo, M. Ramos-Payán, M. Muñoz, E. Leere Øiestad, S. Pedersen-Bjergaard, Electromembrane extraction using deep eutectic
solvents as the liquid membrane, Anal. Chim. Acta 1143 (2021) 109–116.
[32] P. Makos´ , A. Przyjazny, G. Boczkaj, Hydrophobic deep eutectic solvents as
“green” extraction media for polycyclic aromatic hydrocarbons in aqueous
samples, J. Chromatogr. A 1570 (2018) 28–37.
[33] D.J.G.P. Van Osch, C.H.J.T. Dietz, J. Van Spronsen, M.C. Kroon, F. Gallucci, M. Van
Sint Annaland, R. Tuinier, A search for natural hydrophobic deep eutectic
solvents based on natural components, ACS Sustain. Chem. Eng. 7 (2019)
2933–2942.
Supplementary information
HPLC-UV method – Additional details; MB-LPME in 96-well format – Equipment and handling; Calculations for theoretical extraction model.
Declaration of Competing Interest
The authors declare that they have no known competing financial interests that could have appeared to influence the work reported in this paper.
Supplementary materials
Supplementary material associated with this article can be
found, in the online version, at doi:10.1016/j.chroma.2021.462769.
CRediT authorship contribution statement
Maria Schüller: Conceptualization, Methodology, Formal analysis, Investigation, Writing – original draft, Writing – review & editing, Visualization. Kim Tu Thi Tran: Methodology, Formal analysis,
Investigation, Writing – review & editing. Elisabeth Leere Øiestad:
Supervision, Writing – review & editing. Stig Pedersen-Bjergaard:
Conceptualization, Methodology, Formal analysis, Writing – original draft, Writing – review & editing, Supervision.
References
[1] S.H. Hansen, S. Pedersen-Bjergaard, Bioanalysis of pharmaceuticals: sample
preparation, separation techniques, and mass spectrometry, 1st. Ed., John Wiley & Sons, Ltd, Chichester, UK, 2015.
[2] M. Ghambarian, Y. Yamini, A. Esrafili, Developments in hollow fiber based liquid-phase microextraction: principles and applications, Microchimica Acta 177
(2012) 271–294.
[3] S. Pedersen-Bjergaard, B. Gammelgaard, T.G. Halvorsen, Introduction to Pharmaceutical Analytical Chemistry, 2nd. ed., Wiley, Hoboken, NJ, 2019.
[4] H. Liu, P.K. Dasgupta, Analytical chemistry in a drop. Solvent extraction in a
microdrop, Anal. Chem. 68 (1996) 1817–1821.
[5] L. Araujo, M.E. Troconis, D. Cubillán, J. Mercado, N. Villa, A. Prieto, Single drop
microextraction and gas chromatography–mass spectrometry for the determination of diflufenican, mepanipyrim, fipronil, and pretilachlor in water samples, Environ Monit Assess 185 (2013) 10225–10233.
[6] S. Pedersen-Bjergaard, K.E. Rasmussen, Liquid-liquid-liquid microextraction for
sample preparation of biological fluids prior to capillary electrophoresis, Anal.
Chem. 71 (1999) 2650–2656.
[7] M. Rezaee, Y. Assadi, M.-R.Milani Hosseini, E. Aghaee, F. Ahmadi, S. Berijani,
Determination of organic compounds in water using dispersive liquid–liquid
microextraction, J. Chromatogr. A 1116 (2006) 1–9.
[8] M.-.I. Leong, S.-.D. Huang, Dispersive liquid–liquid microextraction method
based on solidification of floating organic drop combined with gas chromatography with electron-capture or mass spectrometry detection, J. Chromatogr. A
1211 (2008) 8–12.
[9] X. Jiang, H.K. Lee, Solvent bar microextraction, Anal. Chem. 76 (2004)
5591–5596.
[10] A. Gjelstad, A.T. Andresen, A. Dahlgren, T.E. Gundersen, S. Pedersen-Bjergaard,
High-throughput liquid-liquid extraction in 96-well format: parallel artificial
liquid membrane extraction, LC GC Eur 30 (2017) 10–17.
8