The impact of endotoxin masking on the removal of endotoxin during manufacturing of a biopharmaceutical drug product
Bạn đang xem bản rút gọn của tài liệu. Xem và tải ngay bản đầy đủ của tài liệu tại đây (2.2 MB, 10 trang )
Journal of Chromatography A 1671 (2022) 462995
Contents lists available at ScienceDirect
Journal of Chromatography A
journal homepage: www.elsevier.com/locate/chroma
The impact of endotoxin masking on the removal of endotoxin during
manufacturing of a biopharmaceutical drug product
Martina Wespel a, Melanie Geiss a, Matthias Nägele a, Stephanie Combé a, Johannes Reich b,
Joey Studts a, Jessica Stolzenberger a,∗
a
b
Boehringer Ingelheim Pharma GmbH & Co. KG, Biberach, Germany
Microcoat Biotechnologie GmbH, Bernried, Germany
a r t i c l e
i n f o
Article history:
Received 14 December 2021
Revised 18 March 2022
Accepted 24 March 2022
Available online 26 March 2022
Keywords:
Low endotoxin recovery
Endotoxin removal
Ion exchange chromatography
Ultrafiltration/Diafiltration
Bacterial Endotoxin Testing
Endotoxin
Lipopolysaccharide
a b s t r a c t
Endotoxins are a highly pyrogenic and immunogenic contaminant of bacterial origin that must be avoided
during the manufacturing of biopharmaceutical products to ensure safety and efficacy. Low endotoxin recovery, also known as a masking effect, is defined as the ability to detect <50% [21] of the expected
endotoxin in an endotoxin assay. Masking can be caused by the ability of endotoxins to build aggregates,
bind to the protein or organise in micelles or vesicles that in turn inhibit detection of the endotoxin in
the solution being tested. Therefore, a masking effect can result from physical parameters of the molecule
being tested or from the buffer/environmental conditions of the solution the molecule is in. This can subsequently lead to the underestimation of endotoxin contaminations and lead to a potential false negative
test. Tight control over the effectiveness of the downstream process and the use of well-characterised
endotoxin testing assays are needed to ensure optimal endotoxin removal.
This manuscript demonstrates the capacity to remove the endotoxins within a proven acceptable
range by also controlling and evaluating the potential masking effects during downstream process at ambient temperature and also during sample storage condition until the analyse was performed. The endotoxin removal study (ERS) is divided in the initial part to evaluate the process buffers and the conditions
of the molecule to avoid the underestimation of endotoxins in process samples in advance. This pre-study
is a necessary prerequisite to evaluate the results after the endotoxin spiked downstream unit operations.
With those aspects, the removal capacity can be demonstrated. A study was carried out to characterise
the endotoxin removal capability of the purification process including controlling of masking effects. The
endotoxin removal capacity on ion exchange chromatography and during ultrafiltration/diafiltration unit
operations of the downstream processing of an immunoglobulin G1 antibody was conducted using various process parameters to understand their impact on endotoxin removal. In the small-scale study, the
processing steps from each tested unit operation were spiked with Escherichia coli endotoxins. The potential masking effect during purification was addressed by controlling the hold time by spiking studies
of the different generated pools at ambient temperature. By conducting a masking study, all generated
protein pools (flow-through/wash, eluate and regeneration pools) had no masking effect caused through
sample handling prior to analysis.
Overall, this study showed that endotoxins could be successfully removed by anion exchange chromatography. A partial removal could be achieved by cation exchange chromatography and endotoxins
could not be removed with ultrafiltration/diafiltration.
© 2022 The Authors. Published by Elsevier B.V.
This is an open access article under the CC BY-NC-ND license
( />
1. Introduction
∗
Corresponding author.
E-mail address: (J. Stolzenberger).
Endotoxins, also known as lipopolysaccharides (LPS), are a component of the cell wall from gram-negative bacteria and play
an important role in bacterial virulence. LPS is an amphiphilic
molecule that consists of three domains: a polar heteropolysaccharide (O-antigen), the core oligosaccharide and a non-polar lipid
/>0021-9673/© 2022 The Authors. Published by Elsevier B.V. This is an open access article under the CC BY-NC-ND license ( />
M. Wespel, M. Geiss, M. Nägele et al.
Journal of Chromatography A 1671 (2022) 462995
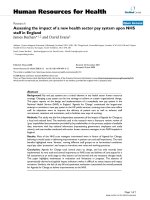
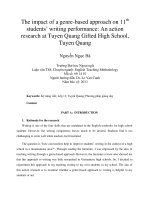
Fig. A. Process flow chart and sampling strategy.
Downstrream process is refelcted by several unit operations (chromatography steps and filtration steps). BET study determined the endotoxin masking behaviour of intermediates samples in dependency of storage temperature and hold time. Intermediate samples (load pool and product pool) will be spiked with 10 EU/mL in the end dilution
and hold at 2-8°C. Five sampling points were tested at t0, t1 (48 h), t2 (2 weeks), t3 (3 weeks) and t4 (5 weeks) for ensure that during the samping storage time no
masking effect was occurred. This prerequisite study was conducted to establish the sample storage condition and to evaluate the unit operations for the endotoxin removal
study. ERS sampling strategy controls the potential masking effect during the process at ambient temperature. T0 will be stored immediatly at the fixed sample storage
condition established in the BET study. T1 demostrates the hold time at ambient temperature for the subsequent process (duration of load, flow through, product pool and
regeneration). The endotoxin recovery will be calculated based on measured amount of the sub steps.
AEX, anion exchange; CEX, cation exchange; UF/DF, ultrafiltration and diafiltration; BET, bacterial endotoxin test; HCCF, harvested cell culture fluid; t, timepoint; ERS, endotoxin removal study; n.a., not applicable.
moiety known as lipid A, which anchors the endotoxin to the bacterial outer membrane [1,2]. Endotoxins are highly pyrogenic and
immunogenic, with trace levels able to cause an immune response
in humans resulting in fever and septic shock [2,3]. Endotoxins are
the major contributors to this pyrogenic response caused by contaminated pharmaceutical products, formulation ingredients and
medical devices [4]. The high mortality due to endotoxin shock remains a clinical problem, especially in debilitated and immunosuppressed patients [5,6]. In addition to the harmful effects of endotoxins, their presence may alter the results of in vivo and in vitro
studies carried out during pre-clinical activities [7].
The reduction and removal of endotoxins, and the testing to
demonstrate low levels require considerable efforts in development
and manufacturing [8]. A continuous control during the downstream process is critical in order to comply with the standard
when eliminating endotoxins during product purification [4], corresponding to an allowable endotoxin limit of 5 endotoxin units
[EU]/kg per adult to avoid the possibility of fever or hypotension in
the case of endotoxin contamination [9,10]. The downstream process in biopharmaceutical manufacturing consists of an initial recovery by extraction or isolation, followed by purification and polishing steps [4]. A downstream purification process is comprised of
several chromatography and membrane-based filtration steps, including virus inactivation and filtration, and a final concentration
and diafiltration (DF) step [4,11,12] (Figure A). The capacity of endotoxin removal from proteins during the purification process depend on the characteristics of the target protein [13]. The characteristics most likely to impact endotoxin removal are generally the
size (e.g. gel filtration chromatography, ultrafiltration [UF]) and the
electrostatic/hydrophobic character of the IgG molecule (e.g. ion
exchange chromatography) [7,13]. Typically, three chromatographic
separations are applied in a classic manufacturer process after antibody capturing with protein A chromatography, anion exchange
(AEX) and cation exchange (CEX) chromatography, or hydrophobic
interaction chromatography, which is mostly used as polishing step
[12] (Figure A). In addition to the release testing, evaluating the
effectiveness of endotoxin removal in the in-process intermediates
in the downstream process is critical to process understanding and
control [4,8,12].
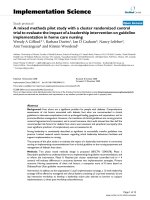
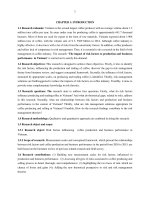
Fig. 1. Low endotoxin recovery: The inability to detect endotoxins that are added
to undiluted drug samples is known as the LER effect, that occurs when endotoxin
recovery is <50% according to PDA technical report No 82 [21]. The LER effect is
caused by endotoxin masking, due to endotoxin aggregates, formation of protein
complexes and micelles. The LER and associated masking effects are influenced by
various conditions, including the analysis of samples (e.g. hold time, hold temperature, spike concentration, sample preparation and calculation of endotoxin recovery), sample composition (e.g. pH, protein charge, salt concentration and matrix
components), and the endotoxin standard (e.g. manufacturer, microbial origin and
applied endotoxin standard).
LER, low endotoxin recovery.
This manuscript describes the methods and evaluates the endotoxin removal capability of the downstream purification process
for an immunoglobulin (Ig) G1 antibody. To investigate this, an ERS
was developed to determine endotoxin behaviour during the individual process steps.
A bacterial endotoxin test (BET) hold time study was performed
for all in-process samples (load pools and product pools) (Table1)
to detect potential low endotoxin recovery (LER) and evaluate potential masking effects. LER, also known as a masking effect, exists when the endotoxin recovery is <50%, leading to false negatives when quantifying masked endotoxins [14]. The ability to detect endotoxin in an assay is influenced by various conditions related to the analysis itself, and the properties and the composition of the sample (Fig. 1) [1,15]. LER can be caused by the abil2
M. Wespel, M. Geiss, M. Nägele et al.
Journal of Chromatography A 1671 (2022) 462995
Table 1
Kinetic chromogenic LAL assay test parameters.
Parameter
Requirement
Total number of process step samples
10 (HCCF, Capture step product pool; AEX load pool, AEX product pool, CEX product
pool, VF product pool, polishing step 3 load pool, polishing step 3 product pool, UF/DF
product pool, DS product pool
1
3
Minimum of five concentrations (minimum 0.005 EU/mL – maximum 50.0 EU/mL)
Prepared with CSE
Prepared with LRW or endotoxin-free WFI
10.0 EU/mL CSE in end dilution to be tested
n/a
Spike LRW or WFI with an end concentration of 10.0 EU/mL CSE
Nunc 3.6 mL polypropylene tubes used as sample storage containers
Spike concentration control to be tested for each time point and stored under the same
conditions as test samples
Technical duplicates for standard curve, spike concentration control, test samples and
negative controls
Biological triplicates for all test samples
Non-inhibitory dilution up to 200-fold as per validated method
t0 =0h, t1 =24h (1 day), t2 =168h (7 days), t3 =504h (21 days), t4 =840h (35 days) (each ±
2 hour) from time of spike (=t0 )
Additional time point(s) may be added to monitor an LER effect
A full list of buffers is presented in Table S1
3.6 mL or 4.6 mL Nunc polypropylene tubes (Thermo Fischer) for sample containers or
for validations, respectively
Wavelength: 405 nm
Measurement cycle: every 150 seconds
Max number of measurements: 40
OD value: 0.2 OD
Temperature reader: 37°C ± 1°C
+5°C ± 3°C in Nunc polypropylene tubes
Minimum number of test iterations per sample
Test samples
Standard curve (performed for every plate)
Negative control
Spike value of CSE
Product positive control
Spike concentration control
Replicates
Dilutions
Measured time points (tx )
Process buffers
Storage container
KQCL parameters
Sample storage condition
HCCF, harvested cell culture fluid; AEX, anion exchange; CEX, cation exchange; VF, virus filtration; UF/DF, ultrafiltration and diafiltration; DS, drug substance;
CSE, control standard endotoxin; LRW, LAL Reagent Water; OD, optical density; SCC, spike concentration control; T, temperature; WFI, water for injection.
ity of endotoxins to build mixed aggregates, bind to the protein
or organise itself into micelles or vesicles [14]. This phenomenon
has been noticed in biopharmaceutical products, which normally
contain large protein molecules such as monoclonal antibodies as
the active pharmaceutical ingredient, whereby the detection of potential endotoxin during the purification process may not be ensured, and, therefore, masked LPS can trigger unwanted immune
responses [1,14,16]. In these samples, LPS may be adsorbed to antibodies, interfering with the endotoxin detection systems.
Based on the endotoxin behaviour detected in the BET study,
three unit operations, namlyanion exchange (AEX), cation exchange
(CEX) and 30 kD ultra-/diafiltration (UF/DF) of the downstream
processing were chosen to evaluate the capacity for endotoxin removal in their in-process steps. Therefore, ion exchange polishing steps with AEX and CEX resins to remove host cell proteins
and residual DNA were evaluated in the ERS. Since endotoxins are
smaller than the normal cut-off of the UF/DF membrane (30 kD),
this unit was also evaluated as a possible removal step during
the downstream purification. The ERS was conducted in a small
scaled model using endotoxin-spiked load material from a 2,0 0 0 L
bioreactor. Here we report the results of the experiments of this
study in which endotoxin removal capabilities were assessed using
varying process parameters within their proven acceptable process
ranges (PAR). To the best of the author’s knowledge, it is the first
time analysing capability of endotoxin removal whilst controlling
masking effects of endotoxin.
sample preparation conditions were established (sample dilution).
These final conditions were determined during the verification
study and resulted as follows: 100 EU/mL to AEX load pool and
product pool; CEX load pool was not addressed in the BET hold
time study, due to the identical buffer composition with AEX
product pool, 10 0 0 EU/mL to CEX product pool; 20 0 0 EU/mL to
30 kD UF/DF load pool and 200 EU/mL to 30 kD UF/DF product pool samples were subsequently stored at 2–8°C for up to
five weeks. Samples were diluted to a test concentration of 10
EU/mL before BET, and endotoxin recovery was determined at t0 ,
48 hours, and 1, 3 and 5 weeks. The testing is performed as per
the pharmacopeial requirements for the kinetic chromogenic limulus amoebocyte lysate (LAL) assay. Test parameters are described
in Section 2.3, and additional sample strategy is summarised in
Table 1 and Fig. A.
2.2. The ERS study
2.2.1. Columns and membrane
Columns (length 25 cm, diameter 1 cm; Cytiva) were newly
packed for AEX with Q-Sepharose FF (Cytiva) and CEX with POROS
50 HS resins (Applied Biosystems) in a qualified downstream scale
down model. Column efficiency and peak asymmetry was determined for each column prior to the experiments. For Q Sepharose
FF 2142 plates per meter and asymmetry of 0.96 and of the POROS
50HS 2243 plates per meter and an asymmetry of 1.37 were
reached. An Omega 186 cm2 T-Series Centramate polyethersulfone
membrane (PALL Corporation) with a molecular weight cut-off of
30 kD was used for the UF/DF step. Amicon 4 mL filters with a
30 kD regenerated cellulose membrane (Merck) were used for the
UF/DF with spiked water experiment (see section 2.5). Following
equilibration of the columns or the membrane, an endotoxin sample was drawn and analysed within 3 hours to ensure that the sys-
2. Materials and methods
2.1. BET hold time study
For time-dependent endotoxin recovery experiments, different
concentrations of endotoxin from the E. coli strain 055:B5 (Lonza)
were spiked into undiluted samples. For the expected pools, the
3
M. Wespel, M. Geiss, M. Nägele et al.
Journal of Chromatography A 1671 (2022) 462995
Fig. 2. Sampling plan schematics for AEX, CEX and UF/DF for the ERS study.
Samples were collected for analysis from a) AEX, b) CEX and c) UF/DF. Generally, the load, flow-through, wash, filtrate, product and regeneration pools were collected at
two time points (t0 and t1 ) and analysed three times (n=3, technical replicates). ERS sampling strategy controls the potential masking effect during the process at ambient
temperature. T0 will be stored immediately at the fixed sample storage condition established in the BET study. T1 demonstrates the hold time at ambient temperature for
the subsequent process (duration of load, flow through, product pool and regeneration).
tem was endotoxin free. In addition, a sanitisation step was performed after each experiment to avoid endotoxin carryover.
same incubation step was used to sanitise the ÄKTA Avant system.
The sampling strategy is demonstrated in Fig. 2a and b.
2.2.2. Preparation of load pools, buffers, solutions and endotoxin
standard
The load pools from the unit operations AEX, CEX and the
UF/DF were prepared following manufacturing at scale and spiked
with control standard endotoxin (CSE) to a predefined level of
50 EU/mL (AEX), 20 EU/mL (CEX) and 10 EU/mL (UF/DF). The
load pool was spiked separately for each run, and immediately
before the load step started. Storage conditions of the samples (2-8°C) were determined in the BET hold time study (see
Sections 2.1 and 3.1). The preparation of the CSE standard from
the E. coli strain O113:H10 was prepared as per the manufacturer
instructions (Pyroquant Diagnostik GmbH/Associates of Cape Cod,
Inc.) and reconstituted with endotoxin-free water (Pyroquant Diagnostik GmbH/Associates of Cape Cod, Inc.) at >1,250,0 0 0 EU/vial.
Reconstituted pool vials were stored at 2–8°C for ≤3 months. Before the experiments, the CSE was stored at room temperature for
≥30 min and mixed six times for 1 min, with a 2-minute break
between mixing steps.
Process buffers used for the ERS study are listed in the Table S1.
All buffers were filtered prior to use (Sartobran, Sartorius, 0.2 μm
filter). The buffers and solutions for the experiments were adjusted
to the pH and conductivity levels required.
2.2.4. Ultrafiltration/diafiltration
For the size-based UF/DF separation a 30 kD membrane (TSeries Centramate, Pall, PES membrane) was used. Each experiment was equilibrated with DF buffer and followed by protein
loading. Processing was followed firstly by UF, followed by DF
(buffer exchange), a recovery and flush with DF buffer to a target concentration, system regeneration and storage. For preparation/equilibration of the membrane and the regeneration procedure, minimal acceptable volumes of the respective solutions were
used. The process was conducted at a constant transmembrane
pressure of 1 bar and a constant flow rate, unless changed for
experimental purposes. Regeneration with 1 M NaOH was held
overnight to remove residual endotoxins. The same incubation step
was used to sanitise the 30 kD UF/DF membrane. The sampling
strategy is demonstrated in Fig. 2c.
2.2.5. ERS sampling plan
A sampling plan was set up for each unit operation. In general, all relevant pools (load, flow-through/ wash/filtrate, product
and regeneration pool) were collected and analysed. A scheme of
the drawn samples for AEX, CEX and UF/DF is shown in Fig. 2a,b,c.
All samples, except for those for setpoint 1 experiments, were filtered using an Acrodisc 32 filter (0.8/0.2 μm, PALL Corporation),
aliquoted in 3.6 mL Nunc tubes (Thermo Scientific) and stored at
2–8°C. Endotoxin samples for UF/DF with spiked water were also
filtered using an Acrodisc 32 filter (0.8/0.2 μm, PALL Corporation).
For the evaluation of the hold time effects at ambient temperature on the endotoxin recovery during processing, each relevant
pool was stored immediately at 2–8°C after finishing the process
step (sample t0 ). A portion of the pool (sample t1 ) was held at
ambient temperature. Sample t1 of the elution pool was held for
the duration of the respective sub step, until the elution pool was
collected. Each sample was drawn and analysed three times.
2.2.3. Ion exchange chromatography
Process intermediate pools spiked with endotoxins were purified with Q-Sepharose FF and POROS 50 HS resins. Columns
were integrated into the ÄKTATM Avant system (Cytiva) and AEX
and CEX chromatography were performed in a flow-through mode
and bind-elute mode, respectively. The following chromatography
steps were followed: equilibration, loading of endotoxin sample,
wash/wash following by elution, strip, regeneration 1 and 2, and
storage.
Column volumes (CV) for each process step were set to the
minimal acceptable volume to simulate worst-case conditions
(AEX/CEX: equilibration 8 CV/5 CV, wash 5 CV/4 CV, elution
0 CV/4 CV, strip 2 CV, regeneration 2 CV and storage 3 CV). The
flow was set to the maximal acceptable flow rate of 3.93 mL/min
(5 min residence time) for all process steps. Regeneration with 1 M
NaOH was held for 5 hours to remove all residual endotoxins. The
2.2.6. ERS experiments
For the evaluation of the endotoxin removal capability of QSepharose FF and POROS 50 HS, three setpoint experiments and
4
M. Wespel, M. Geiss, M. Nägele et al.
Journal of Chromatography A 1671 (2022) 462995
ing samples onto the column. Setpoint experiments were adjusted
to a target of 8.0 mS/cm and pH 7.5. Adjustments to all conductivity parameters to 5.0 mS/cm (LL) and 11.0 mS/cm (UL), and to pH
7.4 (LL) and pH 7.7 (UL) were performed for the additional experiments (Fig. 3a).
Equilibration/wash and elution conductivity were tested in the
CEX chromatography (Fig. 3b). Setpoint experiments were adjusted
to a target of 10.0 mS/cm for equilibration/wash conductivity and
22.5 mS/cm for elution conductivity. Adjustments to equilibration/wash conductivity to 6.0 mS/cm (LL) and 13.0 mS/cm (UL) and
elution conductivity to 20.0 mS/cm (LL) and 25.0 mS/cm (UL), and
were performed for the additional experiments (Fig. 3b), and the
pH of the load pool was adjusted to pH 5.75 in each experiment.
In the UF/DF removal experiments, three setpoint experiments
and three experiments with varying parameters were conducted. A
setpoint run without endotoxin spike was performed before ERS.
The DF factor and feed flow rate were tested against each other on
the UL and LL of the PAR (Fig. 3c). Setpoint experiments were set
at a ×10 DF factor and a LL flow rate of 300 L/m²/h. For additional
experiments only, three runs with PAR conditions were performed
since no UL of the DF factor PAR is defined and a LL for flow rate
does not apply. DF factor was adjusted to the LL of 5.8 and flow
rate was adjusted to the UL of the PAR to 450 L/m²/h (Fig. 3c). An
additional UF/DF experiment was performed with purified water
spiked with 10 EU/mL of endotoxins in a 4 mL Amicon filter with a
30 kD cut-off (Merck) to evaluate if endotoxins could pass through
the membrane in the absence of protein.
2.3. Endotoxin testing
Concentration of endotoxin were measured using the kineticchromogenic method (KQCL) LAL assay in accordance with the European Pharmacopeia (EP 2.6.14) US Pharmacopeia (USP <85>)
and Japanese Pharmacopeia (JP 4.01) [17], and read out with KQCL
reader with WinKQCL software (Lonza). Endotoxin concentrations
(EU/mL) in the samples were determined from a CSE standard
curve diluted in 1:10 dilution steps with endotoxin free water.
Samples were read at 405 nm and 340 nm. The LAL test has a
variance of 50-200 %, so validated dilution factors for each sample were used so that the spike recovery fell within the range. The
coefficient of variation of triplicates was determined to be <10%,
otherwise measurement was repeated.
2.4. Protein quantification
The protein concentration was calculated with a photometric
UV measurement with the Ultrospec 2100 pro UV-/VIS-spectral
photometer (Cytiva). Samples that were at a concentration > 1 g/L
were diluted with the corresponding buffer solution. After calibrating to 0 g/L, samples were measured by absorbance at 280 nm.
Measurement was repeated if triplicates differed >5%. The protein
concentration was calculated based on the Beer-Lambert law using
the extinction coefficient for IgG1 (ɛƛ 1.39 L/g∗ cm).
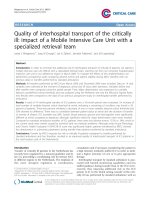
Fig. 3. Schematic experiments in the ERS study.
Scheme of performed a) AEX experiments using Q-Sepharose FF (7 runs), b) CEX
experiments using POROS 50 HS resin (7 runs) and c) UF/DF experiments using a
30 kD membrane (6 runs). Three setpoint experiments and four experiments with
varied input parameters tested against each other on the UL and LL of the PAR,
were conducted.
AEX, anion exchange; CEX, cation exchange; ERS, endotoxin removal study; LL,
lower limit; n.a., not applicable; PAR, proven acceptable range; UF/DF, ultrafiltration
and diafiltration; UL, upper limit.
3. Results and discussion
3.1. Hold time study
To determine a potential LER effect, a BET hold time study of
product-containing process step samples of IgG1 was conducted
prior to the ERS experiments. LER, also known as a masking effect,
exists when the endotoxin recovery is <50% [21], leading to false
negatives when quantifying masked endotoxins [14]. The ability to
detect endotoxin in an assay is influenced by various conditions related to the analysis itself, and the properties and the composition
of the sample (Fig. 1) [1,15]. The study was performed with three
four additional experiments with varying critical process parameters and key process parameters were tested against each other on
the upper limit (UL) and lower limit (LL) of the PAR. In detail, load
conductivity, load pH, equilibration/wash conductivity and equilibration/wash pH were chosen for AEX chromatography (Fig. 3a).
Conductivity and pH of AEX load pool were adjusted prior to load5
M. Wespel, M. Geiss, M. Nägele et al.
Journal of Chromatography A 1671 (2022) 462995
Fig. 4. BET hold time study over 4 weeks at 2–8°C.
Fig. shows endotoxin recovery in percentage of three lots (asterisk, dot, point) of spiked samples which were spiked with 10 EU/mL. The endotoxin recovery was analysed
at t0 , t1 (48 h), t2 (2 weeks), t3 (3 weeks) and t4 (5 weeks) at sample storage temparature of 2-8°C. Unit operations and steps: AEX chromatography following a) AEX load
pool and b) AEX product pool; CEX chromatography following c) CEX product pool, and UF/DF following d) UF/DF load pool and e) UF/DF product pool. Dotted lines display
the acceptable assay variance 50 – 200%.
detected as an outlier because setpoint 1 and 2 (Fig. 5a and b)
showed no underestimation. Experiment performance showed no
noticeable problem by using the equal parameter setup. In all three
product pools no endotoxin could be detected. Within the tested
PARs regarding pH and conductivity of the load, equilibration and
wash steps, the downstream process showed that endotoxin removal was robust (Fig. 5d–g), and total removal of spiked endotoxins (50 EU/mL) was possible and could be recovered in the regeneration pool. Overall, samples of the AEX chromatography showed
no masking, which was also substantiated regarding endotoxin recovery (64.2–142%), and no hold time effect of t0 and t1 samples
was observed; this was expected due to the results of the BET. Furthermore, endotoxins are negatively charged, therefore AEX chromatography is expected to be suitable for endotoxin removal from
positively charged immunoglobulins. Additionally, sample filtration
had no impact on the detected endotoxin level. The setpoint 1 experiment (unfiltered samples) showed comparable endotoxin levels
to the other setpoint/PAR experiments (filtered samples). The total
recovery remains between 50-200% what reflects the assay variance.
different sample lots. This study was used to evaluate the influence
of the storage conditions at 2–8°C for a hold time up to five weeks
on the endotoxin recovery. If the three different lots have a similar behaviour over the hold time and situated between 50-200%
no LER effect caused by sample composition and storage condition.
Fig. 4 shows only data of the chosen sample storage condition and
the chosen unit operations in the further ERS study. The results
of the BET hold time study with samples stored at 2–8°C showed
that the process steps AEX load pool (Fig. 4a), AEX product pool
(Fig. 4b) and CEX product pool (Fig. 4c) were within the 50–200%
recovery range, and thus showed no LER effect. The UF/DF load
pool (Fig. 4d) and the 30 kD UF/DF product pool (Fig. 4e) were
below or borderline of the 50% recovery range.
After evaluation of the BET hold time study, the process steps
AEX and CEX were identified for the ERS because no LER effect
was detected. These process steps were capable of displaying the
removal of the endotoxin without considering a masking effect.
The UF/DF step was also chosen because the LER effect of load
and product pools were comparable. Both pools showed an endotoxin recovery of about 50%. Therefore, UF/DF experiments could
be evaluated with the background knowledge that endotoxin levels were approximately 50% of the real value.
3.3. CEX ERS study
3.2. AEX ERS study
3.3.1. Endotoxin adsorption by IgG1 of CEX load pool
The endotoxin removal experiment spike was set to 20 EU/mL
for the CEX load pools, with detected endotoxin levels between 1.8
and 16.7 EU/mL (Fig. 6). Independent of the assay variance, an underestimation of endotoxins was detected. The adjusted CEX load
pool contains the same matrix as the AEX product pool (25 mM
phosphate 41 mM NaCl), with only the pH adjusted from pH 7.50
(AEX) to pH 5.75 (CEX) by using 1 M acetic acid. The adjusted
buffer pH led to a shift in ionic strength of IgG1 and the spiked
endotoxin. Adapting the ionic strength of the loading conditions
(phosphate acetate and NaCl buffer composition) moved the protein charge to the ionic net loading charge. Therefore, the protein and endotoxin interaction could have an influence during the
CEX step based minor conductivity shifts and can therefore lead to
masking effects (Fig. 6).
Three setpoint experiments and four experiments with varied conditions regarding pH and conductivity were performed. For
evaluation all sub steps (load pool, product pool and regeneration
pool) were analysed to determine the total recovery of endotoxins. This recovery has to be resulted between 50-200% that reflects the assay variance. Due to this evaluation strategy two points
could be addressed. The removal capability of the process step
could be demonstrated and also process safety could be gained by
shown successful regeneration procedure. As shown in Fig. 5a–c,
the net negatively charged endotoxins were able to bind to the
AEX resin, and IgG1 was detected in the product pool samples.
During the high salt regeneration, the endotoxin spike eluted completely from the AEX resin. In Fig. 5c an underestimation of endotoxin in the regeneration pool could be observed. This could be
6
M. Wespel, M. Geiss, M. Nägele et al.
Journal of Chromatography A 1671 (2022) 462995
Fig. 5. Endotoxin results of AEX setpoint and varied parameters experiments.
Figures (a-g) show detectable contents of endotoxin and protein in various experimental setups and sub steps (load pool, product pool, regeneration pool) at different
timepoints. Experiments contains three setpoints (a-c): a) Setpoint 1: pH 7.5, 8.0 mS/cm, unfiltered samples, b)/c) Setpoint 2 and Setpoint 3: pH 7.5, 8.0 mS/cm, with filtered
samples. Experiments with four varied parameters (d-g): d) PAR LL/LL: pH 7.4/ 5.0 mS/cm, e) PAR LL/UL: pH 7.4, 11.0 mS/cm, f) PAR UL/LL: pH 7.7, 5.0 mS/cm and g) PAR
UL/UL pH 7.7, 11.0 mS/cm. Light grey: Amount of endotoxins in EU, grey: amount of protein in mg.
the PAR. The BET study was not performed in the CEX load pool
(adjusted AEX product pool; identical buffer composition), so the
masking effect could not be explained by the BET study.
The increased presence of salt in the load pools was hypothesised to lower the ionic interaction between the protein and endotoxin and therefore avoided masking effects. 2–4-fold higher endotoxin values were measured after the spike in the load pool at
6.5 mS/cm compared with 6.0 mS/cm (Fig. 6), so an increase of
only 0.5 mS/cm had an influence on endotoxin detection (Fig. 6).
Higher endotoxin levels were detected with higher conductivity
and masking effect at 6 mS/cm is shown (Table S2 and Fig. 6).
Furthermore, equilibration buffer spiked with endotoxin showed
no masking effect, which also revealed that masking was not only
conductivity dependent, but also dependent on the protein’s primary and possibly tertiary structure (Fig. 6; Table S2).
Fig. 6. Dependency of the detected endotoxin level on the conductivity in load pool
samples.
Dependency of the detected endotoxin level and the conductivity in CEX load pool
samples (setpoint and varied parameters experiments). Fig. shows detectable endotoxin content as function of the conductivity. n=3 measurements for each experiment are displayed in this diagram. Two experiments (PAR LL/LL and PAR LL/ UL)
were adjusted to conductivity of 6.0 ± 0.02 mS/cm. For the other experiments the
conductivity was between 6.45 ± 0.05 mS/cm. The endotoxin spike concentration
was 20 EU/mL.
3.3.2. Partial flow-through of endotoxins during CEX chromatography
Three setpoint experiments and four experiments with varied conductivity conditions during equilibration, wash and elution were performed. For evaluation all sub steps (load pool, flow
through and wash, product pool and regeneration pool) were analysed to determine the total recovery of endotoxins. This recovery has to be resulted between 50-200% that reflects the assay variance. Due to this evaluation strategy two points could be
addressed. The removal capability of the process step could be
demonstrated and also process safety could be gained by shown
The measured endotoxin levels were assumed to be dependent
on the conductivity of the sample. A lower conductivity correlated
with a lower detected endotoxin value at pH 5.75. Thus, a masking effect was observed due to decreased load conductivity within
7
M. Wespel, M. Geiss, M. Nägele et al.
Journal of Chromatography A 1671 (2022) 462995
Fig. 7. Endotoxin results of POROS 50 HS setpoint and varied parameters experiments.
Figures (a-g) show detectable contents of endotoxin and protein in various experimental setups and sub steps (load pool, flowthrough, product pool, regeneration pool)
at different timepoints. Experiments contains three setpoints: a) Setpoint 1: Equilibration conductivity 10.0 mS/cm and elution conductivity 22.5 mS/cm with unfiltered
samples, b)/c) Setpoint 2 and Setpoint 3: Equilibration conductivity 10.0 mS/cm and elution conductivity 22.5 mS/cm with filtered samples. Experiments with four varied
parameters: d) PAR LL/LL, equilibration conductivity, 6.0 mS/cm, elution conductivity, 20.0 mS/cm; e) PAR LL/UL, equilibration conductivity, 6.0 mS/cm, elution conductivity,
25.0 mS/cm (outlier), f) PAR UL/LL, equilibration conductivity, 13.0 mS/cm, elution conductivity, 20.0 mS/cm and g) PAR UL/UL, equilibration conductivity, 13.0 mS/cm, elution
conductivity, 25.0 mS/cm. Light grey: amount of endotoxins in EU, grey: amount of protein in mg.
successful regeneration procedure. Residual endotoxins present in
flow-through, product pool and regeneration 1 samples indicated
that POROS 50 HS was partially able to remove endotoxin spiked at
a concentration of 20 EU/mL. As shown in Fig. 8a–b, 8.4–59.4% of
the endotoxins remained in the product pool samples, corresponding to theoretical spiked concentration of 20 EU/mL; the remaining endotoxins were mostly detected in flow-through and product
pool samples. Only marginal endotoxin amounts were measured
in regeneration samples (Fig. 7). If the conductivity was increased
during equilibration (13 mS/cm), more endotoxins were detected
in the flow-through samples compared with experiments with a
low equilibration conductivity (6 mS/cm), in line with the before mentioned exposed hypothesis (Fig. 8). The high conductivity
avoided ionic interactions between the protein and endotoxin, and
therefore avoided masking effects. High conductivity conditions (13
mS/cm) during wash enabled endotoxins to flow through the column, while the low equilibration/wash conductivity (6 mS/cm) resulted in an interaction between the endotoxins and the protein.
The low ionic strength conditions could also cause indirect binding to the resin and co-elution of the endotoxin with the protein.
Such protein and endotoxin interactions can result in a drift of the
endotoxin removal, detected in the product pool (Fig. 8a and b).
Overall, 1–12 EU/mL endotoxins were detected in the product pool
regarding all experiments in the proven acceptable range. The ob-
servation was based on the binding conditions and not dependent
on the elution conductivity (Fig. 8b). The masking effect in load
pool will be obvious due to the fact, that after spiking a theoretical
endotoxin content of about 2500 EU should be displayed (Fig. 7).
Due to the assay variance a level between 1250 and 50 0 0 EU (50
- 200%) is acceptable. A level below 1250 EU in load pool could be
explained by potential masking effect based on the charged surface
of the protein by adjusting to pH 5.75, discussed in Section 3.3.1.
Conditions at UL during equilibration and wash resulted in higher
endotoxin content in the flow through substep. The conditions at
LL during equilibration and wash showed a reduced level of endotoxins in the flow through and the level in product pool was
increased (Fig. 7). Therefore, the CEX process only demonstrated
partial endotoxin removal capability, and this capability is dependent on the applied load conditions (load pool and equilibration
conditions).
3.3.3. Reversible masking effect during performing CEX
chromatography
The recovery of endotoxin levels in the CEX step was recognised as a reversible masking effect during the performance of CEX
chromatography. The theoretical amount of all spiked endotoxins
could achieve a mass balance by the summation of all sub steps
(flow-through, elution and regeneration). The interaction of endo8
M. Wespel, M. Geiss, M. Nägele et al.
Journal of Chromatography A 1671 (2022) 462995
Fig. 8. Endotoxin data from the product pool in the CEX experiments with varied conditions.
Endotoxin data in CEX product pool samples with varied conditions on equilibration and elution conductivity: a) endotoxin reduction dependent on equilibration/wash
conductivity; b) endotoxin reduction dependent on elution conductivity.
The figure shows in a) the dependency of equilibration and wash conductivity to the removal of endotoxin. The dotted line represents the linear trend dependent on the
conductivity of equilibration and wash. In b) the dependency of elution conductivity to the removal of endotoxin levels is shown. The dotted line displays that the elution
conductivity has no linear trend regarding the removal of endotoxin in the product pool.
toxins and IgG1 was detected as a reversible masking effect due to
the change in conductivity during elution. The endotoxins could be
demasked by the increase in conductivity of the sample following
chromatography and could be detected in the product pool.
This data demonstrates that the interaction between protein
and endotoxin plays a critical role in the separation of endotoxin
from protein during chromatography, as well as the detection and
analysis of the endotoxin. The ability of proteins to interact with
endotoxins can be controlled by varying buffer conditions and
must be carefully considered for the separate takes of both purification and detection.
endotoxin amount, held for 4 hours and analysed with and without filtration. This resulted in 124 EU/mL of endotoxins in the unfiltered sample and in 7.5 EU/mL in the filtrate (Table S4). Therefore, the assumption that sample filtration was responsible for the
10-fold reduced endotoxin recovery could be confirmed.
The UF/DF experiment showed that no endotoxin removal capability was given by using a 30 kD membrane. Only 42.3% of the
loaded endotoxins were detected in the unfiltered setpoint 1 experiment. Testing of a possible hold time effect could also only be
evaluated in the first experiment. UF/DF product pools of setpoint
2 and 3 were further treated with NaCl to increase the conductivity
and PYROSPERSE to reverse a possible masking effect. The amount
of endotoxin detected did not increase, thus confirming that the
low recovery was caused by sample sterile filtration and not due
to a masking effect.
An additional setpoint experiment was performed with spiked
water to avoid a masking effect due to protein and endotoxin interaction (data not shown). Only 1.3% of the loaded endotoxins (0.08
EU/mL) could be detected in the filtrate. This demonstrates that
endotoxins alone may build aggregates that are not membrane permeable through 30 kD pores, as demonstrated by previous studies
[18]. Hence, 30 kD membranes could not be used to reduce or remove endotoxins. The presence of LPS aggregates in aqueous solutions have been previously reported, which are less likely to be
removed from an undiluted sample regardless the use of detergent
[19].
3.4. UF/DF ERS study
The estimated LER effect on the 30 kD product pool from the
UF/DF unit operation indicated an incomplete recovery (∼50%) due
to a possible masking effect. Endotoxin monomers have a size of
∼10–20 kD, thus the endotoxin could theoretically be removed
partly through the 30 kD membrane. However, in the 30 kD load
pool that was spiked with 10 EU/mL endotoxins, 13.2–15.0 EU/mL
could be detected which represents a full recovery with respect to
the method variability (50 – 200 %) (Table S3).
Three setpoint experiments and three experiments with varied
conditions regarding flow rate and DF factor were performed. Endotoxins could only be detected in product pool samples (Table
S3). No endotoxins were found in the filtrate and regeneration 1
samples. This phenomenon was independent of the experiment parameters. Also, only 2.8–8.2% of the theoretical spiked amount of
the endotoxin (10 EU/mL) could be recovered in the product pools.
An exception was the setpoint 1 experiment, wherein 42.3% of endotoxins were recovered, which was in line with the expected LER
effect. The setpoint 1 sample was the first experiment in the 30 kD
set up; this experiment was considered an unfiltered reference to
examine the sterile filtration effect. One assumption was that endotoxins in the 30 kD product pool build aggregate structures, and
that the sample filtration for the following experiments was responsible for this effect. To verify this hypothesis, the 30 kD product pool was spiked with 136 EU/mL, the total theoretical loaded
4. Conclusions
Removal of endotoxins during the manufacturing process is
essential to assure drug quality and patient safety. This work
presents the endotoxin removal capability and the behaviour of
several downstream unit operations related to an IgG1 antibody.
Not all unit operations were eligible for the ERS study, given that
a BET hold time study revealed possible LER effects. These results
demonstrate the relevance of performing a BET hold time study to
ensure accurate endotoxin removal capacities and avoid false negative results.
9
M. Wespel, M. Geiss, M. Nägele et al.
Journal of Chromatography A 1671 (2022) 462995
Furthermore, from the three-unit operations tested (AEX, CEX
and UF/DF), only the AEX step using Q-Sepharose FF was capable
of completely removing the spiked 50 EU/mL endotoxins. CEX using POROS 50 HS was able to partly remove the endotoxins, and a
masking effect increased the risk of false negatives for endotoxin
levels due to low conductivity during the load step, thus allowing
co-elution with the protein. The UF/DF using a 30 kD membrane
could not remove endotoxins. UF has shown to be ineffective in
endotoxin removal from antibodies [20] and has shown limitations
in removing endotoxins for molecules smaller than endotoxin aggregates [4], which was demonstrated in this study. Therefore, this
method is likely to be more suitable for small molecules with no
affinity for endotoxins or non-protein solutions [4]. Overall, AEX
has proved to be the most effective method for a high protein recovery and robust endotoxin removal with no masking effects, independent of the pH and conductivity used. The hypothesis could
be confirmed, that at pH 7.5 the endotoxin (positive charged) binds
to the AEX resin and the IgG1 (negative charged) flows through the
column. Therefore, the endotoxin could be completely removed by
AEX step in this study. The CEX should theoretically demonstrates
a reverse behavior due the protein and endotoxin charge at pH
5.75. The endotoxin should flow through the column. The protein
binds to the resin and will be eluted by the increased conductivity. The study showed partly removal of the endotoxin based on
the conductivity distribution during the load and wash step. It is
being expected that the charged surface on the endotoxin will be
dependent to the endotoxin source. The protein charge behavior is
caused by the primary structure and the IP. In this ERS an interaction between IgG1 and the used CSE was detected based on this
phenomenon. This brings us to the most important conclusion that
the CEX removal capacity could partially be demonstrated. Based
on this hypothesis the CEX observation has to be further investigated.
Ester Ruiz-Romeu, PhD and Tina Borg, PhD of OPEN Health Communications provided medical writing support, editorial support,
and formatting assistance, which was contracted and funded by
Boehringer Ingelheim. All authors collaborated on the writing of
the manuscript and made the decision to submit the manuscript
for publication.
Supplementary materials
Supplementary material associated with this article can be
found, in the online version, at doi:10.1016/j.chroma.2022.462995.
References
[1] J. Reich, et al., Masking of endotoxin in surfactant samples: Effects on Limulus-based detection systems, Biologicals 44 (5) (2016) 417–422.
[2] D. Petsch, F.B. Anspach, Endotoxin removal from protein solutions, J. Biotechnol. 76 (2–3) (20 0 0) 97–119.
[3] C.R.H. Raetz, Biochemistry of endotoxins, Ann. Rev. Biochem. 59 (1) (1990)
129–170.
[4] M. Schneier, et al., Current technologies to endotoxin detection and removal
for biopharmaceutical purification, Biotechnol. Bioeng. (2020).
[5] W. Su, X. Ding, Methods of endotoxin detection, J. Lab. Autom. 20 (4) (2015)
354–364.
[6] M. Kinoshita, et al., Immune mechanisms underlying susceptibility to endotoxin shock in aged hosts: Implication in age-augmented generalized shwartzman reaction, Int. J. Mol. Sci. 20 (13) (2019).
[7] D. Gadre, et al., Endotoxin reduction in protein solutions using octyl
β -D-1-thioglucopyranoside wash on chromatography media, J. Chromatogr. A
1575 (2018) 49–58.
[8] U. Mamat, et al., Detoxifying Escherichia coli for endotoxin-free production of
recombinant proteins, Microb. Cell Fact. 14 (2015) 57.
[9] K.L. Williams, Endotoxins: Pyrogens, LAL Testing and Depyrogenation, Taylor &
Francis, 2007.
[10] Council of Europe, in: Guidelines for Using the Test for Bacterial Endotoxins,
Chapter 5.1.10. In European Pharmacopoeia (Ph. Eur.), Suppl 8.8, Council of Europe, Strasbourg, France, 2016, pp. 5931–5934.
[11] A.A. Shukla, et al., Evolving trends in mAb production processes, Bioeng. Transl.
Med. 2 (1) (2017) 58–69.
[12] P. Gronemeyer, R. Ditz, J. Strube, Trends in upstream and downstream process
development for antibody manufacturing, Bioengineering (Basel) 1 (4) (2014)
188–212.
[13] A. Serdakowski London, et al., Endotoxin removal and prevention for pre-clinical biologics production, Biotechnol. J. 7 (12) (2012) 1509–1516.
[14] H. Schwarz, et al., Biological activity of masked endotoxin, Sci. Rep. 7 (2017)
44750.
[15] J.S. Bolden, et al., Endotoxin recovery using limulus amebocyte lysate (LAL) assay, Biologicals 44 (5) (2016) 434–440.
[16] J. Reich, et al., Investigation of the kinetics and mechanism of low endotoxin recovery in a matrix for biopharmaceutical drug products, Biologicals 53
(2018) 1–9.
[17] E. Franco, et al., Endotoxins from a pharmacopoeial point of view, Toxins
(Basel) 10 (8) (2018).
[18] W. Richter, et al., Morphology, size distribution, and aggregate structure of
lipopolysaccharide and lipid A dispersions from enterobacterial origin, Innate
Immun. 17 (5) (2011) 427–438.
[19] H. Jang, et al., Effects of protein concentration and detergent on endotoxin reduction by ultrafiltration, BMB Rep 42 (7) (2009) 462–466.
[20] N.S. Sheraba, et al., An efficient method for endotoxin removal from snake antivenoms, Chromatographia 83 (6) (2020) 779–787.
[21] Parentaral Drug Association (PDA), Technical Report No 82, Low Endotoxin Recovery, 2019 ISBN Number: 9781945584077.
Declaration of Competing Interest
None
CRediT authorship contribution statement
Martina Wespel: Conceptualization, Methodology, Validation,
Formal analysis, Writing – original draft, Visualization. Melanie
Geiss: Resources. Matthias Nägele: Resources. Stephanie Combé:
Methodology, Writing – review & editing. Johannes Reich: Writing – review & editing. Joey Studts: Writing – review & editing,
Project administration, Funding acquisition. Jessica Stolzenberger:
Conceptualization, Methodology, Investigation, Writing – review &
editing, Visualization, Supervision, Project administration.
Acknowledgements
This study was funded and executed by Boehringer Ingelheim.
10