Báo cáo khoa học: " It was provocative.” Learning the meaning of scalar adjectives" potx
Bạn đang xem bản rút gọn của tài liệu. Xem và tải ngay bản đầy đủ của tài liệu tại đây (1.34 MB, 10 trang )
Proceedings of the 48th Annual Meeting of the Association for Computational Linguistics, pages 167–176,
Uppsala, Sweden, 11-16 July 2010.
c
2010 Association for Computational Linguistics
“Was it good? It was provocative.”
Learning the meaning of scalar adjectives
Marie-Catherine de Marneffe, Christopher D. Manning and Christopher Potts
Linguistics Department
Stanford University
Stanford, CA 94305
{mcdm,manning,cgpotts}@stanford.edu
Abstract
Texts and dialogues often express infor-
mation indirectly. For instance, speak-
ers’ answers to yes/no questions do not
always straightforwardly convey a ‘yes’
or ‘no’ answer. The intended reply is
clear in some cases (Was it good? It was
great!) but uncertain in others (Was it
acceptable? It was unprecedented.). In
this paper, we present methods for inter-
preting the answers to questions like these
which involve scalar modifiers. We show
how to ground scalar modifier meaning
based on data collected from the Web. We
learn scales between modifiers and infer
the extent to which a given answer conveys
‘yes’ or ‘no’. To evaluate the methods,
we collected examples of question–answer
pairs involving scalar modifiers from CNN
transcripts and the Dialog Act corpus and
use response distributions from Mechani-
cal Turk workers to assess the degree to
which each answer conveys ‘yes’ or ‘no’.
Our experimental results closely match the
Turkers’ response data, demonstrating that
meanings can be learned from Web data
and that such meanings can drive prag-
matic inference.
1 Introduction
An important challenge for natural language pro-
cessing is how to learn not only basic linguistic
meanings but also how those meanings are system-
atically enriched when expressed in context. For
instance, answers to polar (yes/no) questions do
not always explicitly contain a ‘yes’ or ‘no’, but
rather give information that the hearer can use to
infer such an answer in a context with some degree
of certainty. Hockey et al. (1997) find that 27% of
answers to polar questions do not contain a direct
‘yes’ or ‘no’ word, 44% of which they regard as
failing to convey a clear ‘yes’ or ‘no’ response. In
some cases, interpreting the answer is straightfor-
ward (Was it bad? It was terrible.), but in others,
what to infer from the answer is unclear (Was it
good? It was provocative.). It is even common
for the speaker to explicitly convey his own uncer-
tainty with such answers.
In this paper, we focus on the interpretation
of answers to a particular class of polar ques-
tions: ones in which the main predication in-
volves a gradable modifier (e.g., highly unusual,
not good, little) and the answer either involves an-
other gradable modifier or a numerical expression
(e.g., seven years old, twenty acres of land). Inter-
preting such question–answer pairs requires deal-
ing with modifier meanings, specifically, learning
context-dependent scales of expressions (Horn,
1972; Fauconnier, 1975) that determine how, and
to what extent, the answer as a whole resolves the
issue raised by the question.
We propose two methods for learning the
knowledge necessary for interpreting indirect an-
swers to questions involving gradable adjectives,
depending on the type of predications in the ques-
tion and the answer. The first technique deals
with pairs of modifiers: we hypothesized that on-
line, informal review corpora in which people’s
comments have associated ratings would provide
a general-purpose database for mining scales be-
tween modifiers. We thus use a large collection of
online reviews to learn orderings between adjec-
tives based on contextual entailment (good < ex-
cellent), and employ this scalar relationship to in-
fer a yes/no answer (subject to negation and other
qualifiers). The second strategy targets numeri-
cal answers. Since it is unclear what kind of cor-
pora would contain the relevant information, we
turn to the Web in general: we use distributional
information retrieved via Web searches to assess
whether the numerical measure counts as a posi-
167
tive or negative instance of the adjective in ques-
tion. Both techniques exploit the same approach:
using texts (the Web) to learn meanings that can
drive pragmatic inference in dialogue. This paper
demonstrates to some extent that meaning can be
grounded from text in this way.
2 Related work
Indirect speech acts are studied by Clark (1979),
Perrault and Allen (1980), Allen and Perrault
(1980) and Asher and Lascarides (2003), who
identify a wide range of factors that govern how
speakers convey their intended messages and how
hearers seek to uncover those messages from
uncertain and conflicting signals. In the com-
putational literature, Green and Carberry (1994,
1999) provide an extensive model that interprets
and generates indirect answers to polar questions.
They propose a logical inference model which
makes use of discourse plans and coherence rela-
tions to infer categorical answers. However, to ad-
equately interpret indirect answers, the uncertainty
inherent in some answers needs to be captured (de
Marneffe et al., 2009). While a straightforward
‘yes’ or ‘no’ response is clear in some indirect an-
swers, such as in (1), the intended answer is less
certain in other cases (2):
1
(1) A: Do you think that’s a good idea, that we
just begin to ignore these numbers?
B: I think it’s an excellent idea.
(2) A: Is he qualified?
B: I think he’s young.
In (2), it might be that the answerer does not
know about qualifications or does not want to talk
about these directly, and therefore shifts the topic
slightly. As proposed by Zeevat (1994) in his work
on partial answers, the speaker’s indirect answer
might indicate that he is deliberately leaving the
original question only partially addressed, while
giving a fully resolving answer to another one.
The hearer must then interpret the answer to work
out the other question. In (2) in context, we get a
sense that the speaker would resolve the issue to
‘no’, but that he is definitely not committed to that
in any strong sense. Uncertainty can thus reside
both on the speaker and the hearer sides, and the
four following scenarios are attested in conversa-
tion:
1
Here and throughout, the examples come from the corpus
described in section 3.
a. The speaker is certain of ‘yes’ or ‘no’ and
conveys that directly and successfully to the
hearer.
b. The speaker is certain of ‘yes’ or ‘no’ but
conveys this only partially to the hearer.
c. The speaker is uncertain of ‘yes’ or ‘no’ and
conveys this uncertainty to the hearer.
d. The speaker is uncertain of ‘yes’ or ‘no’,
but the hearer infers one of those with con-
fidence.
The uncertainty is especially pressing for pred-
ications built around scalar modifiers, which are
inherently vague and highly context-dependent
(Kamp and Partee, 1995; Kennedy and McNally,
2005; Kennedy, 2007). For example, even if we
fix the basic sense for little to mean ‘young for a
human’, there is a substantial amount of gray area
between the clear instances (babies) and the clear
non-instances (adults). This is the source of un-
certainty in (3), in which B’s children fall into the
gray area.
(3) A: Are your kids little?
B: I have a seven year-old and a ten
year-old.
3 Corpus description
Since indirect answers are likely to arise in in-
terviews, to gather instances of question–answer
pairs involving gradable modifiers (which will
serve to evaluate the learning techniques), we use
online CNN interview transcripts from five dif-
ferent shows aired between 2000 and 2008 (An-
derson Cooper, Larry King Live, Late Edition,
Lou Dobbs Tonight, The Situation Room). We
also searched the Switchboard Dialog Act corpus
(Jurafsky et al., 1997). We used regular expres-
sions and manual filtering to find examples of two-
utterance dialogues in which the question and the
reply contain some kind of gradable modifier.
3.1 Types of question–answer pairs
In total, we ended up with 224 question–answer
pairs involving gradable adjectives. However
our collection contains different types of answers,
which naturally fall into two categories: (I) in
205 dialogues, both the question and the answer
contain a gradable modifier; (II) in 19 dialogues,
the reply contains a numerical measure (as in (3)
above and (4)).
168
Modification in answer Example Count
I Other adjective (1), (2) 125
Adverb - same adjective (5) 55
Negation - same adjective (6), (7) 21
Omitted adjective (8) 4
II Numerical measure (3), (4) 19
Table 1: Types of question–answer pairs, and
counts in the corpus.
I Modification in answer Mean SD
Other adjective 1.1 0.6
Adverb - same adjective 0.8 0.6
Negation - same adjective 1.0 0.5
Omitted adjective 1.1 0.2
II Numerical measure 1.5 0.2
Table 2: Mean entropy values and standard devi-
ation obtained in the Mechanical Turk experiment
for each question–answer pair category.
(4) A: Have you been living there very long?
B: I’m in here right now about twelve and
a half years.
Category I, which consists of pairs of modifiers,
can be further divided. In most dialogues, the an-
swer contains another adjective than the one used
in the question, such as in (1). In others, the an-
swer contains the same adjective as in the ques-
tion, but modified by an adverb (e.g., very, basi-
cally, quite) as in (5) or a negation as in (6).
(5) A: That seems to be the biggest sign of
progress there. Is that accurate?
B: That’s absolutely accurate.
(6) A: Are you bitter?
B: I’m not bitter because I’m a soldier.
The negation can be present in the main clause
when the adjectival predication is embedded, as in
example (7).
(7) A: [. . . ] Is that fair?
B: I don’t think that’s a fair statement.
In a few cases, when the question contains an ad-
jective modifying a noun, the adjective is omitted
in the answer:
(8) A: Is that a huge gap in the system?
B: It is a gap.
Table 1 gives the distribution of the types ap-
pearing in the corpus.
3.2 Answer assignment
To assess the degree to which each answer con-
veys ‘yes’ or ‘no’ in context, we use response dis-
tributions from Mechanical Turk workers. Given a
written dialogue between speakers A and B, Turk-
ers were asked to judge what B’s answer conveys:
‘definite yes’, ‘probable yes’, ‘uncertain’, ‘proba-
ble no’, ‘definite no’. Within each of the two ‘yes’
and ‘no’ pairs, there is a scalar relationship, but
the pairs themselves are not in a scalar relationship
with each other, and ‘uncertain’ is arguably a sep-
arate judgment. Figure 1 shows the exact formu-
lation used in the experiment. For each dialogue,
we got answers from 30 Turkers, and we took the
dominant response as the correct one though we
make extensive use of the full response distribu-
tions in evaluating our approach.
2
We also com-
puted entropy values for the distribution of an-
swers for each item. Overall, the agreement was
good: 21 items have total agreement (entropy of
0.0 — 11 in the “adjective” category, 9 in the
“adverb-adjective” category and 1 in the “nega-
tion” category), and 80 items are such that a single
response got chosen 20 or more times (entropy <
0.9). The dialogues in (1) and (9) are examples of
total agreement. In contrast, (10) has response en-
tropy of 1.1, and item (11) has the highest entropy
of 2.2.
(9) A: Advertisements can be good or bad.
Was it a good ad?
B: It was a great ad.
(10) A: Am I clear?
B: I wish you were a little more forthright.
(11) A: 91 percent of the American people still
express confidence in the long-term
prospect of the U.S. economy; only 8
percent are not confident. Are they
overly optimistic, in your professional
assessment?
2
120 Turkers were involved (the median number of items
done was 28 and the mean 56.5). The Fleiss’ Kappa score for
the five response categories is 0.46, though these categories
are partially ordered. For the three-category response system
used in section 5, which arguably has no scalar ordering, the
Fleiss’ Kappa is 0.63. Despite variant individual judgments,
aggregate annotations done with Mechanical Turk have been
shown to be reliable (Snow et al., 2008; Sheng et al., 2008;
Munro et al., 2010). Here, the relatively low Kappa scores
also reflect the uncertainty inherent in many of our examples,
uncertainty that we seek to characterize and come to grips
with computationally.
169
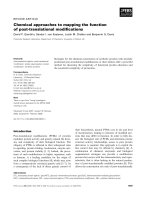
Indirect Answers to Yes/No Questions
In the following dialogue, speaker A asks a simple Yes/No
question, but speaker B answers with something more in-
direct and complicated.
dialogue here
Which of the following best captures what speaker B
meant here:
• B definitely meant to convey “Yes”.
• B probably meant to convey “Yes”.
• B definitely meant to convey “No”.
• B probably meant to convey “No”.
• (I really can’t tell whether B meant to convey “Yes”
or “No”.)
Figure 1: Design of the Mechanical Turk experi-
ment.
B: I think it shows how wise the American
people are.
Table 2 shows the mean entropy values for the
different categories identified in the corpus. Inter-
estingly, the pairs involving an adverbial modifi-
cation in the answer all received a positive answer
(‘yes’ or ‘probable yes’) as dominant response.
All 19 dialogues involving a numerical measure
had either ‘probable yes’ or ‘uncertain’ as domi-
nant response. There is thus a significant bias for
positive answers: 70% of the category I items and
74% of the category II items have a positive an-
swer as dominant response. Examining a subset
of the Dialog Act corpus, we found that 38% of
the yes/no questions receive a direct positive an-
swers, whereas 21% have a direct negative answer.
This bias probably stems from the fact that people
are more likely to use an overt denial expression
where they need to disagree, whether or not they
are responding indirectly.
4 Methods
In this section, we present the methods we propose
for grounding the meanings of scalar modifiers.
4.1 Learning modifier scales and inferring
yes/no answers
The first technique targets items such as the ones
in category I of our corpus. Our central hypothesis
is that, in polar question dialogues, the semantic
relationship between the main predication P
Q
in
the question and the main predication P
A
in the an-
swer is the primary factor in determining whether,
and to what extent, ‘yes’ or ‘no’ was intended. If
P
A
is at least as strong as P
Q
, the intended answer
is ‘yes’; if P
A
is weaker than P
Q
, the intended an-
swer is ‘no’; and, where no reliable entailment re-
lationship exists between P
A
and P
Q
, the result is
uncertainty.
For example, good is weaker (lower on the rel-
evant scale) than excellent, and thus speakers in-
fer that the reply in example (1) above is meant to
convey ‘yes’. In contrast, if we reverse the order
of the modifiers — roughly, Is it a great idea?;
It’s a good idea — then speakers infer that the
answer conveys ‘no’. Had B replied with It’s a
complicated idea in (1), then uncertainty would
likely have resulted, since good and complicated
are not in a reliable scalar relationship. Negation
reverses scales (Horn, 1972; Levinson, 2000), so it
flips ‘yes’ and ‘no’ in these cases, leaving ‘uncer-
tain’ unchanged. When both the question and the
answer contain a modifier (such as in (9–11)), the
yes/no response should correlate with the extent to
which the pair of modifiers can be put into a scale
based on contextual entailment.
To ground such scales from text, we collected a
large corpus of online reviews from IMDB. Each
of the reviews in this collection has an associated
star rating: one star (most negative) to ten stars
(most positive). Table 3 summarizes the distribu-
tion of reviews as well as the number of words and
vocabulary across the ten rating categories.
As is evident from table 3, there is a signif-
icant bias for ten-star reviews. This is a com-
mon feature of such corpora of informal, user-
provided reviews (Chevalier and Mayzlin, 2006;
Hu et al., 2006; Pang and Lee, 2008). However,
since we do not want to incorporate the linguis-
tically uninteresting fact that people tend to write
a lot of ten-star reviews, we assume uniform pri-
ors for the rating categories. Let count(w, r) be
the number of tokens of word w in reviews in rat-
ing category r, and let count(r) be the total word
count for all words in rating category r. The prob-
ability of w given a rating category r is simply
Pr(w|r) = count(w, r)/ count(r). Then under the
assumption of uniform priors, we get Pr(r|w) =
Pr(w|r)/
r
∈R
Pr(w|r
).
In reasoning about our dialogues, we rescale
the rating categories by subtracting 5.5 from each,
to center them at 0. This yields the scale R =
170
Rating Reviews Words Vocabulary Average words per review
1 124,587 25,389,211 192,348 203.79
2 51,390 11,750,820 133,283 228.66
3 58,051 13,990,519 148,530 241.00
4 59,781 14,958,477 156,564 250.22
5 80,487 20,382,805 188,461 253.24
6 106,145 27,408,662 225,165 258.22
7 157,005 40,176,069 282,530 255.89
8 195,378 48,706,843 313,046 249.30
9 170,531 40,264,174 273,266 236.11
10 358,441 73,929,298 381,508 206.25
Total 1,361,796 316,956,878 1,160,072 206.25
Table 3: Numbers of reviews, words and vocabulary size per rating category in the IMDB review corpus,
as well as the average number of words per review.
enjoyable
0.0 0.1 0.2 0.3 0.4
-4.5
-3.5
-2.5
-1.5
-0.5
0.5
1.5
2.5
3.5
4.5
ER = 0.74
best
0.0 0.1 0.2 0.3 0.4
-4.5
-3.5
-2.5
-1.5
-0.5
0.5
1.5
2.5
3.5
4.5
ER = 1.08
great
0.0 0.1 0.2 0.3 0.4
-4.5
-3.5
-2.5
-1.5
-0.5
0.5
1.5
2.5
3.5
4.5
ER = 1.1
superb
0.0 0.1 0.2 0.3 0.4
-4.5
-3.5
-2.5
-1.5
-0.5
0.5
1.5
2.5
3.5
4.5
ER = 2.18
disappointing
0.0 0.1 0.2 0.3 0.4
-4.5
-3.5
-2.5
-1.5
-0.5
0.5
1.5
2.5
3.5
4.5
ER = -1.1
bad
0.0 0.1 0.2 0.3 0.4
-4.5
-3.5
-2.5
-1.5
-0.5
0.5
1.5
2.5
3.5
4.5
ER = -1.47
awful
0.0 0.1 0.2 0.3 0.4
-4.5
-3.5
-2.5
-1.5
-0.5
0.5
1.5
2.5
3.5
4.5
ER = -2.5
worst
0.0 0.1 0.2 0.3 0.4
-4.5
-3.5
-2.5
-1.5
-0.5
0.5
1.5
2.5
3.5
4.5
ER = -2.56
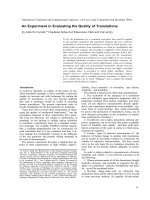
Pr(Rating|Word)
Rating (centered at 0)
Figure 2: The distribution of some scalar modifiers across the ten rating categories. The vertical lines
mark the expected ratings, defined as a weighted sum of the probability values (black dots).
−4.5, −3.5, −2.5, −1.5, −0.5, 0.5, 1.5, 2.5, 3.5, 4.5.
Our rationale for this is that modifiers at the neg-
ative end of the scale (bad, awful, terrible) are
not linguistically comparable to those at the
positive end of the scale (good, excellent, superb).
Each group forms its own qualitatively different
scale (Kennedy and McNally, 2005). Rescaling
allows us to make a basic positive vs. negative
distinction. Once we have done that, an increase
in absolute value is an increase in strength. In
our experiments, we use expected rating values
to characterize the polarity and strength of mod-
ifiers. The expected rating value for a word w
is ER(w) =
r∈R
r Pr(r|w). Figure 2 plots these
values for a number of scalar terms, both positive
and negative, across the rescaled ratings, with
the vertical lines marking their ER values. The
weak scalar modifiers all the way on the left are
most common near the middle of the scale, with
a slight positive bias in the top row and a slight
negative bias in the bottom row. As we move
from left to right, the bias for one end of the scale
grows more extreme, until the words in question
are almost never used outside of the most extreme
rating category. The resulting scales correspond
well with linguistic intuitions and thus provide
an initial indication that the rating categories
are a reliable guide to strength and polarity for
scalar modifiers. We put this information to use
in our dialogue corpus via the decision procedure
171
Let D be a dialogue consisting of (i) a polar question
whose main predication is based on scalar predicate P
Q
and (ii) an indirect answer whose main predication is
based on scalar predicate P
A
. Then:
1. if P
A
or P
Q
is missing from our data, infer ‘Uncer-
tain’;
2. else if ER(P
Q
) and ER(P
A
) have different signs, in-
fer ‘No’;
3. else if abs(ER(P
Q
)) abs(ER(P
A
)), infer ‘Yes’;
4. else infer ‘No’.
5. In the presence of negation, map ‘Yes’ to ‘No’, ‘No’
to ‘Yes’, and ‘Uncertain’ to ‘Uncertain’.
Figure 3: Decision procedure for using the word
frequencies across rating categories in the review
corpus to decide what a given answer conveys.
described in figure 3.
4.2 Interpreting numerical answers
The second technique aims at determining
whether a numerical answer counts as a positive
or negative instance of the adjective in the ques-
tion (category II in our corpus).
Adjectives that can receive a conventional unit
of measure, such as little or long, inherently pos-
sess a degree of vagueness (Kamp and Partee,
1995; Kennedy, 2007): while in the extreme cases,
judgments are strong (e.g., a six foot tall woman
can clearly be called “a tall woman” whereas a
five foot tall woman cannot), there are borderline
cases for which it is difficult to say whether the
adjectival predication can truthfully be ascribed
to them. A logistic regression model can capture
these facts. To build this model, we gather distri-
butional information from the Web.
For instance, in the case of (3), we can retrieve
from the Web positive and negative examples of
age in relation to the adjective and the modified en-
tity “little kids”. The question contains the adjec-
tive and the modified entity. The reply contains the
unit of measure (here “year-old”) and the numer-
ical answer. Specifically we query the Web using
Yahoo! BOSS (Academic) for “little kids” year-
old (positive instances) as well as for “not little
kids” year-old (negative instances). Yahoo! BOSS
is an open search services platform that provides a
query API for Yahoo! Web search. We then ex-
tract ages from the positive and negative snippets
obtained, and we fit a logistic regression to these
data. To remove noise, we discard low counts
(positive and negative instances for a given unit
< 5). Also, for some adjectives, such as little or
young, there is an inherent ambiguity between ab-
solute and relative uses. Ideally, a word sense dis-
ambiguation system would be used to filter these
cases. For now, we extract the largest contiguous
range for which the data counts are over the noise
threshold.
3
When not enough data is retrieved for
the negative examples, we expand the query by
moving the negation outside the search phrase. We
also replace the negation and the adjective by the
antonyms given in WordNet (using the first sense).
The logistic regression thus has only one fac-
tor — the unit of measure (age in the case of lit-
tle kids). For a given answer, the model assigns a
probability indicating the extent to which the ad-
jectival property applies to that answer. If the fac-
tor is a significant predictor, we can use the prob-
abilities from the model to decide whether the an-
swer qualifies as a positive or negative instance of
the adjective in the question, and thus interpret the
indirect response as a ‘yes’ or a ‘no’. The prob-
abilistic nature of this technique adheres perfectly
to the fact that indirect answers are intimately tied
up with uncertainty.
5 Evaluation and results
Our primary goal is to evaluate how well we can
learn the relevant scalar and entailment relation-
ships from the Web. In the evaluation, we thus ap-
plied our techniques to a manually coded corpus
version. For the adjectival scales, we annotated
each example for its main predication (modifier, or
adverb–modifier bigram), including whether that
predication was negated. For the numerical cases,
we manually constructed the initial queries: we
identified the adjective and the modified entity in
the question, and the unit of measure in the answer.
However, we believe that identifying the requisite
predications and recognizing the presence of nega-
tion or embedding could be done automatically us-
ing dependency graphs.
4
3
Otherwise, our model is ruined by references to “young
80-year olds”, using the relative sense of young, which are
moderately frequent on the Web.
4
As a test, we transformed our corpus into the Stanford
dependency representation (de Marneffe et al., 2006), using
the Stanford parser (Klein and Manning, 2003) and were able
to automatically retrieve all negated modifier predications,
except one (We had a view of it, not a particularly good one),
172
Modification in answer Precision Recall
I Other adjective 60 60
Adverb - same adjective 95 95
Negation - same adjective 100 100
Omitted adjective 100 100
II Numerical 89 40
Total 75 71
Table 4: Summary of precision and recall (%) by
type.
Response Precision Recall F1
I Yes 87 76 81
No 57 71 63
II Yes 100 36 53
Uncertain 67 40 50
Table 5: Precision, recall, and F1 (%) per response
category. In the case of the scalar modifiers exper-
iment, there were just two examples whose dom-
inant response from the Turkers was ‘Uncertain’,
so we have left that category out of the results. In
the case of the numerical experiment, there were
not any ‘No’ answers.
To evaluate the techniques, we pool the Me-
chanical Turk ‘definite yes’ and ‘probable yes’
categories into a single category ‘Yes’, and we
do the same for ‘definite no’ and ‘probable no’.
Together with ‘uncertain’, this makes for three-
response categories. We count an inference as
successful if it matches the dominant Turker re-
sponse category. To use the three-response scheme
in the numerical experiment, we simply catego-
rize the probabilities as follows: 0–0.33 = ‘No’,
0.33–0.66 = ‘Uncertain’, 0.66–1.00 = ‘Yes’.
Table 4 gives a breakdown of our system’s per-
formance on the various category subtypes. The
overall accuracy level is 71% (159 out of 224 in-
ferences correct). Table 5 summarizes the results
per response category, for the examples in which
both the question and answer contain a gradable
modifier (category I), and for the numerical cases
(category II).
6 Analysis and discussion
Performance is extremely good on the “Adverb –
same adjective” and “Negation – same adjective”
cases because the ‘Yes’ answer is fairly direct for
them (though adverbs like basically introduce an
interesting level of uncertainty). The results are
because of a parse error which led to wrong dependencies.
Response Precision Recall F1
WordNet-based Yes 82 83 82.5
(items I) No 60 56 58
Table 6: Precision, recall, and F1 (%) per response
category for the WordNet-based approach.
somewhat mixed for the “Other adjective” cate-
gory.
Inferring the relation between scalar adjectives
has some connection with work in sentiment de-
tection. Even though most of the research in that
domain focuses on the orientation of one term us-
ing seed sets, techniques which provide the ori-
entation strength could be used to infer a scalar
relation between adjectives. For instance, Blair-
Goldensohn et al. (2008) use WordNet to develop
sentiment lexicons in which each word has a posi-
tive or negative value associated with it, represent-
ing its strength. The algorithm begins with seed
sets of positive, negative, and neutral terms, and
then uses the synonym and antonym structure of
WordNet to expand those initial sets and refine
the relative strength values. Using our own seed
sets, we built a lexicon using Blair-Goldensohn
et al. (2008)’s method and applied it as in figure
3 (changing the ER values to sentiment scores).
Both approaches achieve similar results: for the
“Other adjective” category, the WordNet-based
approach yields 56% accuracy, which is not signif-
icantly different from our performance (60%); for
the other types in category I, there is no difference
in results between the two methods. Table 6 sum-
marizes the results per response category for the
WordNet-based approach (which can thus be com-
pared to the category I results in table 5). However
in contrast to the WordNet-based approach, we re-
quire no hand-built resources: the synonym and
antonym structures, as well as the strength values,
are learned from Web data alone. In addition, the
WordNet-based approach must be supplemented
with a separate method for the numerical cases.
In the “Other adjective” category, 31 items
involve oppositional terms: canonical antonyms
(e.g., right/wrong, good/bad) as well as terms
that are “statistically oppositional” (e.g., ready/
premature, true/preposterous, confident/nervous).
“Statistically oppositional” terms are not opposi-
tional by definition, but as a matter of contingent
fact. Our technique accurately deals with most
173
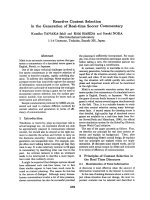
0 10 20 30 40 50 60
0.0 0.2 0.4 0.6 0.8
little kids
Age
Probability of being "little"
0 10 20 30 40 50 60
0.2 0.4 0.6 0.8
young kids
Age
Probability of being "young"
0 20 40 60 80 100 120
0.3 0.4 0.5 0.6 0.7 0.8
warm weather
Degree
Probability of being "warm"
Figure 4: Probabilities of being appropriately described as “little”, “young” or “warm”, fitted on data
retrieved when querying the Web for “little kids”, “young kids” and “warm weather”.
of the canonical antonyms, and also finds some
contingent oppositions (qualified/young, wise/
neurotic) that are lacking in antonymy resources or
automatically generated antonymy lists (Moham-
mad et al., 2008). Out of these 31 items, our tech-
nique correctly marks 18, whereas Mohammad et
al.’s list of antonyms only contains 5 and Blair-
Goldensohn et al. (2008)’s technique finds 11. Our
technique is solely based on unigrams, and could
be improved by adding context: making use of de-
pendency information, as well as moving beyond
unigrams.
In the numerical cases, precision is high but re-
call is low. For roughly half of the items, not
enough negative instances can be gathered from
the Web and the model lacks predictive power (as
for items (4) or (12)).
(12) A: Do you happen to be working for a
large firm?
B: It’s about three hundred and fifty
people.
Looking at the negative hits for item (12), one
sees that few give an indication about the num-
ber of people in the firm, but rather qualifications
about colleagues or employees (great people, peo-
ple’s productivity), or the hits are less relevant:
“Most of the people I talked to were actually pretty
optimistic. They were rosy on the job market
and many had jobs, although most were not large
firm jobs”. The lack of data comes from the fact
that the queries are very specific, since the adjec-
tive depends on the product (e.g., “expensive ex-
ercise bike”, “deep pond”). However when we
do get a predictive model, the probabilities corre-
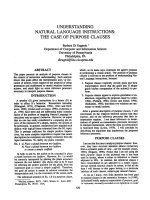
Entropy of response distribution
Probability of correct inference by our system
0.0 0.5 1.0 1.5
0 0.1 0.2 0.3 0.4 0.5 0.6 0.7 0.8 0.9 1
Figure 5: Correlation between agreement among
Turkers and whether the system gets the correct
answer. For each dialogue, we plot a circle at
Turker response entropy and either 1 = correct
inference or 0 = incorrect inference, except the
points are jittered a little vertically to show where
the mass of data lies. As the entropy rises (i.e., as
agreement levels fall), the system’s inferences be-
come less accurate. The fitted logistic regression
model (black line) has a statistically significant co-
efficient for response entropy (p < 0.001).
174
late almost perfectly with the Turkers’ responses.
This happens for 8 items: “expensive to call (50
cents a minute)”, “little kids (7 and 10 year-old)”,
“long growing season (3 months)”, “lot of land
(80 acres)”, “warm weather (80 degrees)”, “young
kids (5 and 2 year-old)”, “young person (31 year-
old)” and “large house (2450 square feet)”. In
the latter case only, the system output (uncer-
tain) doesn’t correlate with the Turkers’ judgment
(where the dominant answer is ‘probable yes’ with
15 responses, and 11 answers are ‘uncertain’).
The logistic curves in figure 4 capture nicely the
intuitions that people have about the relation be-
tween age and “little kids” or “young kids”, as
well as between Fahrenheit degrees and “warm
weather”. For “little kids”, the probabilities of be-
ing little or not are clear-cut for ages below 7 and
above 15, but there is a region of vagueness in be-
tween. In the case of “young kids”, the probabil-
ities drop less quickly with age increasing (an 18
year-old can indeed still be qualified as a “young
kid”). In sum, when the data is available, this
method delivers models which fit humans’ intu-
itions about the relation between numerical mea-
sure and adjective, and can handle pragmatic in-
ference.
If we restrict attention to the 66 examples on
which the Turkers completely agreed about which
of these three categories was intended (again pool-
ing ‘probable’ and ‘definite’), then the percent-
age of correct inferences rises to 89% (59 cor-
rect inferences). Figure 5 plots the relation-
ship between the response entropy and the accu-
racy of our decision procedure, along with a fit-
ted logistic regression model using response en-
tropy to predict whether our system’s inference
was correct. The handful of empirical points in
the lower left of the figure show cases of high
agreement between Turkers but incorrect infer-
ence from the system. The few points in the up-
per right indicate low agreement between Turk-
ers and correct inference from the system. Three
of the high-agreement/incorrect-inference cases
involve the adjectives right–correct. For low-
agreement/correct-inference, the disparity could
trace to context dependency: the ordering is clear
in the context of product reviews, but unclear in
a television interview. The analysis suggests that
overall agreement is positively correlated with our
system’s chances of making a correct inference:
our system’s accuracy drops as human agreement
levels drop.
7 Conclusion
We set out to find techniques for grounding ba-
sic meanings from text and enriching those mean-
ings based on information from the immediate lin-
guistic context. We focus on gradable modifiers,
seeking to learn scalar relationships between their
meanings and to obtain an empirically grounded,
probabilistic understanding of the clear and fuzzy
cases that they often give rise to (Kamp and Partee,
1995). We show that it is possible to learn the req-
uisite scales between modifiers using review cor-
pora, and to use that knowledge to drive inference
in indirect responses. When the relation in ques-
tion is not too specific, we show that it is also pos-
sible to learn the strength of the relation between
an adjective and a numerical measure.
Acknowledgments
This paper is based on work funded in part by
ONR award N00014-10-1-0109 and ARO MURI
award 548106, as well as by the Air Force Re-
search Laboratory (AFRL) under prime contract
no. FA8750-09-C-0181. Any opinions, findings,
and conclusion or recommendations expressed in
this material are those of the authors and do not
necessarily reflect the view of the Air Force Re-
search Laboratory (AFRL), ARO or ONR.
References
James F. Allen and C. Raymond Perrault. 1980. Ana-
lyzing intention in utterances. Artificial Intelligence,
15:143–178.
Nicholas Asher and Alex Lascarides. 2003. Logics of
Conversation. Cambridge University Press, Cam-
bridge.
Sasha Blair-Goldensohn, Kerry Hannan, Ryan McDon-
ald, Tyler Neylon, George A. Reis, and Jeff Reynar.
2008. Building a sentiment summarizer for local
service reviews. In WWW Workshop on NLP in the
Information Explosion Era (NLPIX).
Judith A. Chevalier and Dina Mayzlin. 2006. The
effect of word of mouth on sales: Online book re-
views. Journal of Marketing Research, 43(3):345–
354.
Herbert H. Clark. 1979. Responding to indirect speech
acts. Cognitive Psychology, 11:430–477.
Marie-Catherine de Marneffe, Bill MacCartney, and
Christopher D. Manning. 2006. Generating typed
175
dependency parses from phrase structure parses. In
Proceedings of the 5th International Conference on
Language Resources and Evaluation (LREC-2006).
Marie-Catherine de Marneffe, Scott Grimm, and
Christopher Potts. 2009. Not a simple ‘yes’ or
‘no’: Uncertainty in indirect answers. In Proceed-
ings of the 10th Annual SIGDIAL Meeting on Dis-
course and Dialogue.
Gilles Fauconnier. 1975. Pragmatic scales and logical
structure. Linguistic Inquiry, 6(3):353–375.
Nancy Green and Sandra Carberry. 1994. A hybrid
reasoning model for indirect answers. In Proceed-
ings of the 32nd Annual Meeting of the Association
for Computational Linguistics, pages 58–65.
Nancy Green and Sandra Carberry. 1999. Interpret-
ing and generating indirect answers. Computational
Linguistics, 25(3):389–435.
Beth Ann Hockey, Deborah Rossen-Knill, Beverly
Spejewski, Matthew Stone, and Stephen Isard.
1997. Can you predict answers to Y/N questions?
Yes, No and Stuff. In Proceedings of Eurospeech
1997, pages 2267–2270.
Laurence R Horn. 1972. On the Semantic Properties of
Logical Operators in English. Ph.D. thesis, UCLA,
Los Angeles.
Nan Hu, Paul A. Pavlou, and Jennifer Zhang. 2006.
Can online reviews reveal a product’s true quality?:
Empirical findings and analytical modeling of online
word-of-mouth communication. In Proceedings of
Electronic Commerce (EC), pages 324–330.
Daniel Jurafsky, Elizabeth Shriberg, and Debra Bi-
asca. 1997. Switchboard SWBD-DAMSL shallow-
discourse-function annotation coders manual, draft
13. Technical Report 97-02, University of Colorado,
Boulder Institute of Cognitive Science.
Hans Kamp and Barbara H. Partee. 1995. Prototype
theory and compositionality. Cognition, 57(2):129–
191.
Christopher Kennedy and Louise McNally. 2005.
Scale structure and the semantic typology of grad-
able predicates. Language, 81(2):345–381.
Christopher Kennedy. 2007. Vagueness and grammar:
The semantics of relative and absolute gradable ad-
jectives. Linguistics and Philosophy, 30(1):1–45.
Dan Klein and Christopher D. Manning. 2003. Ac-
curate unlexicalized parsing. In Proceedings of the
41st Meeting of the Association of Computational
Linguistics.
Stephen C. Levinson. 2000. Presumptive Meanings:
The Theory of Generalized Conversational Implica-
ture. MIT Press, Cambridge, MA.
Saif Mohammad, Bonnie Dorr, and Graeme Hirst.
2008. Computing word-pair antonymy. In Proceed-
ings of the Conference on Empirical Methods in Nat-
ural Language Processing and Computational Nat-
ural Language Learning (EMNLP-2008).
Robert Munro, Steven Bethard, Victor Kuperman,
Vicky Tzuyin Lai, Robin Melnick, Christopher
Potts, Tyler Schnoebelen, and Harry Tily. 2010.
Crowdsourcing and language studies: The new gen-
eration of linguistic data. In NAACL 2010 Workshop
on Creating Speech and Language Data With Ama-
zon’s Mechanical Turk.
Bo Pang and Lillian Lee. 2008. Opinion mining and
sentiment analysis. Foundations and Trends in In-
formation Retrieval, 2(1):1–135.
C. Raymond Perrault and James F. Allen. 1980. A
plan-based analysis of indirect speech acts. Amer-
ican Journal of Computational Linguistics, 6(3-
4):167–182.
Victor S. Sheng, Foster Provost, and Panagiotis G.
Ipeirotis. 2008. Get another label? improving data
quality and data mining using multiple, noisy label-
ers. In Proceedings of KDD-2008.
Rion Snow, Brendan O’Connor, Daniel Jurafsky, and
Andrew Y. Ng. 2008. Cheap and fast – but is it
good? evaluating non-expert annotations for natural
language tasks. In Proceedings of the Conference on
Empirical Methods in Natural Language Process-
ing and Computational Natural Language Learning
(EMNLP-2008).
Henk Zeevat. 1994. Questions and exhaustivity in up-
date semantics. In Harry Bunt, Reinhard Muskens,
and Gerrit Rentier, editors, Proceedings of the In-
ternational Workshop on Computational Semantics,
pages 211–221.
176