Báo cáo khoa học: Detergent-resistant membrane fractions contribute to the total 1 H NMR-visible lipid signal in cell potx
Bạn đang xem bản rút gọn của tài liệu. Xem và tải ngay bản đầy đủ của tài liệu tại đây (339.36 KB, 10 trang )
Detergent-resistant membrane fractions contribute to the total
1
H NMR-visible lipid signal in cells
Lesley C. Wright
1
, Julianne T. Djordjevic
2
, Stephen D. Schibeci
2
, Uwe Himmelreich
5
, Nick Muljadi
3,4
,
Peter Williamson
2
and Garry W. Lynch
3,4
1
Centre for Infectious Diseases and Microbiology, Institute of Clinical Pathology & Medical Research;
2
Institute of Immunology &
Allergy Research;
3
Centre for Virus Research, Westmead Millennium Institute, the Cellular and Molecular Pathology Research Unit,
Department of Oral Pathology and Oral Medicine, Westmead Hospital Dental School and
4
National Centre for HIV Virology
Research, University of Sydney, Westmead Hospital, NSW, Australia;
5
Institute for Magnetic Resonance Research,
Westmead Royal North Shore Hospital, St. Leonards, NSW, Australia
Leukocytes and other cells show an enhanced intensity of
mobile lipid in their
1
H NMR spectra under a variety of
conditions. Such conditions include stimulation, which has
recently been shown to involve detergent-resistant, plasma
membrane domains (DRMs) often called lipid rafts. As there
is much speculation surrounding the origin of cellular NMR-
visible lipid, we analysed subcellular fractions, including
DRMs, by NMR spectroscopy. We demonstrated that
DRMs isolated by density gradient centrifugation from
lymphoid (CEM-T4, stimulated Jurkat cells), and mono-
cytoid (THP-1) cells produced NMR-visible, lipid signals.
Large scale subfractionation of THP-1 cells determined that
while cytoplasmic lipid droplets constituted much of the total
NMR-visible lipid, the contribution of DRMs was signifi-
cant. Qualitative and quantitative lipid analyses revealed that
DRMs and lipid droplets differed in their lipid composition.
DRMs were enriched in cholesterol and ganglioside GM1,
and contained relatively unsaturated fatty acids compared
with the lipid droplets. Both lipid droplets and DRMs con-
tained neutral lipids (triacylgycerols, cholesterol ester, fatty
acids in THP-1 cells) that could, in addition to phospho-
lipids, contribute to the NMR-visible lipid. The lipid droplets
also exhibited different protein profiles and contained 500-
fold less protein than DRMs, confirming that DRMs and
droplets were fractionated as separate entities. The NMR-
visible lipid in DRMs is therefore unlikely to be a contami-
nant from lipid droplets. We propose a micropartitioning of
the NMR-visible mobile lipid of whole cells between intra-
cellular lipid droplets, where most of this lipid resides, and
detergent-resistant plasma membrane domains.
Keywords: lipid; membrane; domain; NMR; Triton X-100.
The origin of prominent
1
H NMR signals from lipids in
spectra from many different cell types has been the subject
of controversy for almost two decades. Currently, two
sources for the
1
H NMR-visible lipid have been suggested;
these are the mobile acyl chains of triacylglycerol and/or
cholesterol ester) localized to either membranes, or to
EM-visible intracellular lipid droplets [1]. Ferretti et al. [2]
concluded that these NMR signals originate from both
cytoplasmic lipid droplets and intramembrane amorphous
lipid vesicles.
Highly intense lipid resonances have been associated with
activation or proliferation of lymphocytes, macrophages
and neutrophils [3–5], as well as T cell lines, many cancer
cells, and cancer tissue both ex vivo and in vivo [6]. Other
cellular conditions linked with the appearance of NMR-
visible lipid include the antiproliferative effects of tetra-
phenylphosphonium chloride on a transformed breast cell
line [7], unstimulated human neutrophils in the presence
of high levels of free fatty acids [8], treatment of thymic
lymphocytes with anti-CD3 antibody [4], and the induction
of apoptosis or activation in Jurkat T-lymphoblasts [9]. The
conclusion to be drawn from these and many other studies
is that no single event is linked with the appearance of
NMR-visible lipid.
Recently, much evidence has accumulated for the pres-
ence of neutral lipid-containing plasma membrane domains
that are resistant to solubilization with nonionic detergents
at low temperatures and have a low buoyant density when
subjected to density gradient centrifugation. Such domains
have been given the term DRMs (detergent-resistant
membranes), DIGS (detergent-insoluble glycolipid-enriched
domains), GEMS (glycolipid-enriched membrane domains),
rafts, or caveolae when the protein, caveolin, is present [10].
In this article, we refer to these membrane domains as
DRMs and rule out the use of the term caveolae as caveolins
are not expressed in hematopoietic cells such as the ones
used in this study [10]. In comparison to the rest of the
plasma membrane which is in the liquid-crystalline (lc)
Correspondence to L. C. Wright, Centre for Infectious Diseases and
Microbiology, Institute of Clinical Pathology & Medical Research,
Westmead Hospital, Westmead NSW 2145, Australia.
Fax: + 61 2 98915317, Tel.: + 61 2 98457367,
E-mail:
Abbreviations: DRM, detergent-resistant membrane; DSM, detergent
soluble membrane; CT-B, cholera toxin biotin; PABA, p-aminoben-
zoic acid; PE, phycoerythrin; NaCl/P
i
(–), phosphate-buffered saline
without calcium and magnesium; STR-HRP, streptavidin-conjugated
horseradish peroxidase; PtdCho, phosphatidylcholine.
(Received 17 December 2002, revised 03 March 2003,
accepted 19 March 2003)
Eur. J. Biochem. 270, 2091–2100 (2003) Ó FEBS 2003 doi:10.1046/j.1432-1033.2003.03586.x
phase, DRM structure is more ordered giving it character-
istics of being in the liquid-ordered (lo) phase [10]. DRMs
are rich in cholesterol and sphingolipids (including GM1
and GM3) and selectively retain a number of proteins
including CD4, GPI-anchored proteins such as CD48
[11,12], and proteins associated with T cell receptor (TCR)
signalling such as the src-family tyrosine kinase Lck, and
LAT [10]. In addition, TCR engagement with antigen or by
anti-CD3 antibody crosslinking leads to an increased
partitioning of TCR subunits and their associated signalling
molecules into DRMs implicating their central role as a
focal point for T cell activation. Interestingly, DRM-
associated proteins, such as caveolins and GPI-anchored
proteins, have been identified in the surface monolayer of
lipid droplets [13], indicating a possible link between lipid
droplets and DRMs [14].
ThesizeofDRMshasbeensuggestedbysometo
be > 100 nm [15], and by others to be around 26 nm
[16]. The smaller domain size coincides with that suggested
for NMR-visible microdomains [6]. In addition, parallels
can be drawn between the diversity of functions associated
with DRMs and the appearance of NMR-visible lipid in
cells. These factors, as well as the presence in lipid droplets
of known components of rafts and caveoli, such as
cholesterol and caveolin, prompted us to investigate
whether DRMs contain NMR-visible lipid. In this study
we show that DRMs containing NMR-visible lipid can be
isolated from several cell lines under conditions where
mobile lipid is evident in the
1
H NMR spectra of the
intact cells. Based on their distinctive protein and lipid
composition, these detergent-insoluble domains differ
from lipid droplets, and can be separated from them
on the basis of different buoyant densities on sucrose
gradients.
Materials and methods
Antibodies and reagents
Phycoerythrin (PE)-conjugated anti-CD69/anti-CD25 and
biotin-conjugated cholera toxin (CT-B) were purchased
from Becton Dickinson (San Jose, CA, USA) and Sigma
Aldrich (St. Louis, MO, USA), respectively. Monoclonal
anti-Lck and horseradish peroxidase (HRP)-conjugated
antimouse Ig/streptavidin (STR-HRP) were obtained from
Santa Cruz and Amersham Pharmacia Biotech Inc.,
respectively. Antibodies against Hck, protein disulphide
isomerase and tubulin were purchased from Transduction
Laboratories, Stressgen and Sigma Aldrich, respectively.
Monoclonal anti-CD48 was provided by T. Henniker
(Westmead Hospital, Sydney, Australia) and polyclonal
anti-CD4 (T4-5) was a gift from R. Sweet (Smith-Kline
Beecham, King of Prussia, PA, USA).
Cell lines
The CEM-T4 human T lymphoblastoid cell line was
obtained from the NIH AIDS Research and Reference
Reagent Program (Rockville, MD, USA). The human
monocytic leukemic THP-1 and the Jurkat T-cell lines
(J32.2) were obtained from the American Type Culture
Collection (ATCC; Rockville, MD, USA).
Cell culture and stimulation
All cell lines were maintained in RPMI/10% fetal bovine
serum. For Jurkat cell stimulation, cells were seeded into
serum-free RPMI/0.1% BSA (10
6
ÆmL
)1
) and incubated for
24 h (viability > 80%). Harvested cells were then seeded
into RPMI/10% fetal bovine serum and were either left
unstimulated or were stimulated with PMA (30 ngÆmL
)1
)
and ionomycin (300 ngÆmL
)1
) for 24 h.
Preparation and fractionation of plasma membranes
Jurkat and CEM-T4 cell membranes and cytosol, prepared
from 1 and 5 · 10
8
cells, respectively, were solubilized with
1% Triton X-100 (v/v) and fractionated by 5–40% sucrose
gradient centrifugation as described previously [17]. THP-1
cells were used for quantitative NMR and lipid analytical
work. Membranes from THP-1 cells (1.56 · 10
9
)were
separated from the cytosol by ultracentrifugation at
105 000 g for 60 min. The membrane-containing pellet
was then solubilized with 1% Triton X-100 and fractionated
by sucrose gradient centrifugation. Thirteen fractions of
equal volume were collected from the top to the bottom of
each gradient.
Cholera toxin dot-blotting and SDS/PAGE
immunoblotting
Sucrose gradient fractions were examined for GM1 ganglio-
side and protein content by cholera toxin dot-blotting and
immunoblotting of SDS/PAGE-separated proteins, respect-
ively. For Western blotting, proteins were recovered from
cell extracts with Strataclean resin (Stratagene, La Jolla, CA,
USA), eluted by boiling in Laemmli sample buffer, subjected
to SDS/PAGE (10% or 4–16%) and electrotransferred to
nitrocellulose membranes. Membranes were probed with
primary antibody to Lck, Hck, CD48, protein disulphide
isomerase, tubulin or CD4 followed by HRP-conjugated
anti-rabbit/mouse Ig. For cholera toxin dot-blotting, 1 lLof
each fraction was spotted directly onto nitrocellulose prior
to incubation with CT-B followed by STR-HRP. Chemi-
luminescent bands and spots were detected on X-ray film.
Flow cytometry
Cells (2 · 10
5
) were incubated with anti-CD69 or anti-
CD25 for 30 min on ice, washed with NaCl/P
i
and then
fixed with 1% paraformaldehyde prior to FACScan ana-
lysis (Becton Dickinson). Data were analysed using
CELL
QUEST
software (Becton Dickinson).
1
H NMR analysis of whole cells, cell fractions
and sucrose gradient fractions
Sample Preparation. Cells (5 · 10
7
) were washed three
times in NaCl/P
i
(–) containing 0.1 mgÆmL
)1
BSA, then
washed and resuspended in 400 lLNaCl/P
i
(–) made up in
2
H
2
O. Homogenates, supernatants, floating lipid droplets
and gradient fractions were dialyzed against NaCl/P
i
(–), and
NaCl/P
i
(–)
2
H
2
O added to a final concentration of 10%.
Membrane pellets were washed three times in NaCl/P
i
(–) and
resuspended in NaCl/P
i
(–)
2
H
2
O. For quantitation of lipid
2092 L. C. Wright et al.(Eur. J. Biochem. 270) Ó FEBS 2003
signals, a known volume (usually 20 lL) of 10 m
M
p-aminobenzoic acid (PABA) was added to all fractions
isolated from the cells. Integrals of phase and baseline
corrected NMR spectra were determined using
XWINNMR
2.6
(Bruker Biospin, Rheinstetten, Germany). The integrals were
normalized to the PABA resonances at 6.83 p.p.m and
7.83 p.p.m. The CH
2
resonance at 1.3 p.p.m. was utilized to
quantify the fatty acid residues. This resonance contains
contributions mainly from the protons on CH
2
groups that
are adjacent to other CH
2
groups, rather than those adjacent
to double bonds or the carbonyl group of the acyl chains [7].
From the biochemical fatty acid analysis it was estimated that
the average number of such CH
2
groups per fatty acid residue
was 9.1. This was used for calculation of the fatty acid residue
concentrations based on the NMR integrals. For most
fractions, only trace amounts of valine, leucine, threonine
and isoleucine contributed also to the 1.3 p.p.m. resonance.
However, for the THP-1 supernatant fraction, a substantial
contribution from these amino acid residues was noted,
resulting in overestimation of the fatty acid concentration by
up to twofold. Some contribution from amino acids was also
noted in the membrane and DSM fractions from THP-1 cells.
NMR spectroscopy. For both cells and gradient fractions,
NMR spectra were acquired at 37 °C with the sample
spinning at 20 Hz, using a Bruker Avance 360 MHz
spectrometer; parameters for NMR spectroscopy of the
cells were essentially as in [8]. 1D
1
HNMR spectra of
gradient fractions were run using a selective excitation field
gradient method of water suppression [18], a spectral width
of 4000 Hz, 256 accumulations, and total acquisition time
per transient of 3.14 s. 2D NMR spectroscopy of sucrose
gradient fractions was carried out by acquiring
1
H,
1
H
COSY NMR spectra in magnitude mode. Remaining water
was suppressed by selective excitation. A total of 2000 data
points were collected in the t
2
timedomainwithaspectral
width of 10 p.p.m. The evolution time (t
1
) was incremented
to obtain 200 free induction decays, each with 32 scans for
cells, and for the rafts 160 free induction decays, each with
256 scans. The total relaxation delay per scan was 1.6 s.
Sine–bell window functions were applied in the t
1
dimension,
and Gaussian–Lorentzian window functions were applied
in the t
2
dimension according to [7]. Zero filling was used
to expand the data matrix to 1K in the t
1
dimension.
Lipid extraction and thin layer chromatography (TLC)
Gradient fractions were extracted in chloroform and
methanol, partitioned against water, and the lipid species
in the organic phase separated by TLC as previously
described [5,8]. The solvent system for neutral lipids was
petroleum ether (BP 60–80 °C)/diethyl ether/acetic acid
(90 : 15 : 1 v/v/v) and for polar lipids was CHCl
3
/meth-
anol/water (65 : 25 : 4 v/v/v). The lipids were visualized
with iodine vapour and also stained with sterol spray
reagent and Coomassie Blue [8]. Their identities were
confirmed by comparison with authentic standards.
Lipid analyses
Cholesterol and triacylgycerol estimations were performed
using the Roche Modular Analytical System with CHOD-
PAP methodology for cholesterol and GPO/PAP metho-
dology for triacylgycerols (Roche). Fatty acid analyses were
conducted on saponified lipid extracts converted to fatty
acid methyl esters by acid methanolysis. These were
separated on an HP Series II 5890 gas chromatograph with
an Agilent Ultra 2 capillary column 19091B-102, using the
method of MIDI Inc. (Delaware, USA). Results are
expressed as percentages of the sum of the areas of all
peaks identified.
Results
Examination of stimulated Jurkat cells by NMR
spectroscopy
Stimulation of Jurkat T cells with PMA/ionomycin was
assessed using flow cytometry as shown in Fig. 1A.
Augmentation of the fluorescence levels attributable to
surface expression of the T-cell activation markers, IL-2
receptor alpha chain (CD25) and CD69, was observed
following stimulation.
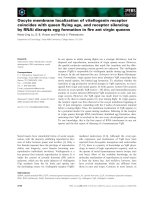
Fig. 1. Examination of stimulated Jurkat T cells by flow cytometry and
1
H NMR spectroscopy. PMA and ionomycin-stimulated and non-
stimulated Jurkat cells were incubated with anti-IgG
1
(isotype control),
anti-CD25 or anti-CD69 (all PE–conjugated) and fluorescence
was assessed by flow cytometry (A). The shaded peaks represent
the stimulated phenotype in each case. 1D
1
H NMR spectra of sti-
mulated and nonstimulated Jurkat cells are shown in B, confirming the
presence of more NMR-visible CH
2
resonances at 1.3 p.p.m. in the
stimulated cells. Sample preparation and
1
H NMR spectroscopy for
this and subsequent figures were carried out as in the Materials and
methods.
Ó FEBS 2003
1
H NMR of cells/Triton-insoluble membrane fractions (Eur. J. Biochem. 270) 2093
Stimulated and nonstimulated Jurkat cells were examined
for mobile lipid content using
1
H NMR. As shown in
Fig. 1B, there was a marked increase in NMR-visible,
mobile lipid on stimulation with PMA plus ionomycin.
Protons from the methylene groups of the lipid acyl chains
are at 1.3 p.p.m., and other resonances have previously been
assigned to protons from methyl groups (0.9 p.p.m) and
choline-containing residues (3.2 p.p.m) [4]. The CH
2
/CH
3
ratio increased from 1.44 to 3.02 after stimulation, with a
concomitant increase in the CH
2
/choline peak height ratio
from 0.44 to 2.82, due to a decrease in choline. These trends
have also been observed previously [4,9].
Examination of plasma membrane fractions
from stimulated Jurkat cells by NMR spectroscopy
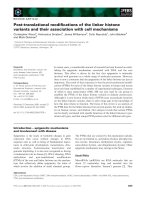
Next we examined the plasma membrane distribution of
mobile lipids by fractionating plasma membranes on the
basis of Triton X-100 solubility and buoyant density using
sucrose gradient ultracentrifugation. The separation of lipid
domains to the lighter, detergent-insoluble gradient frac-
tions (DRMs, 3–6) was indicated indirectly by detecting the
DRM-resident proteins Lck and CD48, and directly by
detecting the glycosphingolipid GM1 with cholera toxin
(Fig. 2A–C). The DRM protein markers were also detected
in the high density fractions (9–10) which contain cytosolic
material and Triton-soluble membrane (DSM) components.
Lck and CD48 were, however, preferentially associated with
DRMs, which contained less than 2% of the total protein
found within the DSM fractions (determined by densito-
metric scanning of Coomassie Blue-stained gels).
When the DRM and DSM fractions were analysed for
mobile lipid content by
1
H NMR, lipid CH
2
and CH
3
resonances at 1.3 and 0.9 p.p.m. were present in the DRM
fractions of stimulated cells (mean CH
2
/CH
3
ratio of
1.9 ± 0.2 SEM, n ¼ 3), but lipid was below the level of
detection, or present at a reduced level (mean CH
2
/CH
3
ratio of 1.4 ± 0.06 SEM, n ¼ 3), in similar fractions from
the same number of nonstimulated cells (Fig. 2D). Lipid
resonances were not detected in the DSM fractions from
either cell type (not shown). Carbohydrate/polyol residues
(CHOH, 3.4–4 p.p.m. region), but not choline, were visible
in both the DRM and DSM fractions, but these were found
to be artefacts from residual sucrose and/or dialysis cassette
materials (see later).
Identification of mobile lipid in other cell types and
membrane fractions by
1
H NMR spectroscopy
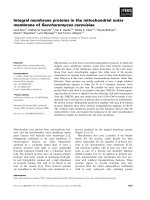
CEM-T4 cells and membranes. NMR spectra of CEM-T4
lymphoblasts displayed less mobile lipid than the stimulated
Jurkat cells (CH
2
/CH
3
ratio of 2.78), but the choline
resonance was much more prominent (Fig. 3A). No
increase in mobile lipid was observed upon stimulation
(data not shown). NMR-visible lipid and carbohydrate (but
not choline) were again present in the DRM fractions (4–5)
isolated from these cells (Fig. 3A), but this lipid was not
observed in the DSM fractions (not shown). The distribution
of CD4 protein is shown in Fig. 3B and demonstrates that a
portion of CD4 is present in the DRM fractions containing
the NMR-visible lipid. The DRM fractions contained about
2% of the total membrane protein content.
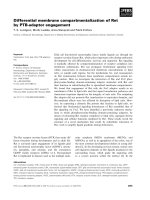
THP-1 cells and membranes. NMR spectra of intact cells
of the human monocytoid cell line THP-1, were clearly
dominated by protons arising from lipid (Fig. 4A). The
CH
2
/CH
3
peak height ratio was calculated to be 5.2, which
was much higher than the equivalent signal observed in
stimulated Jurkat cells. In contrast, the intensity of the
choline resonance was very low, compared with the
unstimulated Jurkat or CEM-T4 cells. The THP-1 cells
did not increase their NMR-visible lipid when stimulated
(data not shown).
As with CEM-T4 DRM fractions, THP-1 DRM fractions
4–6, which contain less than 2% of the total membrane pro-
tein, were found to localize specifically the DRM-associating
proteins CD4 and Hck, without contamination by either of
the abundant endoplasmic reticulum (protein disulphide
isomerase) [19] or cytoskeletal (tubulin) representative
protein markers (Fig. 4B). All proteins colocalized with the
DSM fractions 10–12.
Notably, the spectra arising from these DRM fractions
were similar to the whole cell spectra in that they were again
dominated by lipid (CH
2
/CH
3
ratio of 5.0; Fig. 5A). A
small peak from choline-containing compounds was visible
at 3.2 p.p.m. As with the Jurkat and CEM T-4 gradients,
carbohydrate/polylol resonances were distinguished in both
the DRM and DSM fractions (Fig. 5A,C). These resonan-
ces, and one at 5.4 p.p.m., were also found in spectra from
dialysed blank sucrose gradient fractions (Fig. 5B) which
were prepared under the same conditions as the membrane-
containing gradients, and were therefore not cell-derived. In
comparison, virtually no NMR-visible lipid was detected in
the DSM fractions (Fig. 5C), which did, however, contain
most of the extracted membrane proteins. Blank gradient
fractions isolated from the same part of the gradient
produced spectra that were identical to that in Fig. 5B
(results not shown). An NMR spectrum of Triton X-100 is
shown in Fig. 5D. Resonances from Triton were not found
in DRM, DRM control or DSM fractions (Fig. 5A–C), or
in DSM control fractions (not shown).
Two-dimensional
1
H,
1
H correlation spectroscopy
(COSY) confirmed that the resonance at 1.3 p.p.m. was
indeed derived mainly from lipid (Fig. 6). The crosspeaks
labelled A–G¢ in Fig. 6 indicate spin-spin coupling between
protons on adjacent carbon atoms. Crosspeaks A–F have
previously been assigned to resonances from acyl chain
protons found in triacylglycerol and/or cholesterol esters
[20,21]. These could also arise from phospholipids. G¢
is derived from the glycerol backbone of triacylglycerol
[20]. The intensities of crosspeaks C and D (– CH
2
-CH
2
-
CH¼CH- and ¼CH-CH
2
-CH¼CH-, respectively) indicate
that relatively large amounts of unsaturated fatty acid
residues are present. The absence of resonances from
lactate, threonine, valine, leucine and isoleucine was
confirmed by COSY and spin-echo experiments
(TE ¼ 135 ms, data not shown).
Distinguishing the NMR-visible lipids of DRMs
and cytosolic lipid droplets
Most of the cytosolic lipid droplets floated as a visible, milky
layer on the top of the supernatant formed when the plasma
membrane fraction was sedimented from the cellular
homogenate. The remainder of the lipid droplets were
2094 L. C. Wright et al.(Eur. J. Biochem. 270) Ó FEBS 2003
observed floating on top of fraction 1 of the sucrose gradient
used for separation of DRMs from DSMs. The lipid
droplets isolated from THP-1 cells displayed an NMR
spectrum (Fig. 7A) which resembled that of the DRM
fraction shown in Fig. 5A, except that the CH
2
/CH
3
ratio
was only 2 (compared with 5 for DRMs) and a resonance at
3 p.p.m. was more prominent than the choline peak at
3.2 p.p.m. Comparison of NMR spectra from THP-1 cells
(Fig. 4A) and their sedimented plasma membranes
(Fig. 7B) shows a marked reduction in NMR-visible lipid
in the membranes, indicating removal of cytoplasmic lipid
droplets. The relative reduction in the intensity of the
choline resonance at 3.2 p.p.m. confirmed previous obser-
vations that most of the choline signal visible in whole cells
derives from intracellular metabolites such as free choline,
choline phosphate and glycerophosphocholine [4,7].
A large-scale fractionation of THP-1 cells was carried out
to quantify the contribution of the lipid droplets and DRMs
to the total cellular NMR-visible lipid. Relative concentra-
tions of the NMR-visible lipid in all subcellular fractions
were calculated by comparing the integrals of the lipid
methylene resonances at 1.3 p.p.m. to those of a known
concentration of the internal standard, PABA (Table 1).
The only fraction not included was the hard pellet at
the bottom of the gradients, which presumably contains
aggregated proteins and cytoskeletal elements, as it is
Triton-insoluble, but does not float on a density gradient.
We calculated that approximately 12.4% of the total
Fig. 2. Identification and examination of Jurkat DRMs by
1
HNMR
spectroscopy. Proteins in sucrose gradient fractions from nonstimu-
lated Jurkat cells were fractionated by SDS/PAGE, electrotransferred
to nitrocellulose and immunoblotted with antibodies to DRM protein
markerssuchasLck(A)orCD48(B)(1lgÆmL
)1
) followed by ECL
detection as in the Materials and methods. Sucrose gradient fractions
were also spotted onto nitrocellulose and probed with CT-B
(2 lgÆmL
)1
) followed by ECL detection of GM1, a DRM lipid marker
(C). The
1
H NMR spectra of dialysed DRMs from 10
8
stimulated and
nonstimulated Jurkat cells are compared in D, indicating the presence
of NMR-visible CH
2
resonances at 1.3 p.p.m. in the former, and low
amounts of these resonances (sometimes below the limits of detection,
as shown here) in the latter.
Fig. 3. Examination of CEM-T4 cells and DRMs by
1
HNMR
spectroscopy. The
1
H NMR spectra of CEM-T4 cells and dialysed
DRM fractions obtained from 5 · 10
8
cells are shown in A. The
presence of CH
2
resonances at 1.3 p.p.m. can be seen in both cells and
DRMs. The sucrose gradient distribution of the DRM marker, CD4,
is shown by immunoblotting with anti-CD4 (1 lgÆmL
)1
)followedby
ECL detection in B.
Ó FEBS 2003
1
H NMR of cells/Triton-insoluble membrane fractions (Eur. J. Biochem. 270) 2095
cellular NMR-visible lipid signal was derived from the
DRM fractions, about 2.1% from DSM fractions, and
about 62.5% from lipid droplets. The latter figure was
calculated as the sum of the signal from the supernatant
(assumed to be contaminated with lipid droplets) plus that
from the isolated cytoplasmic lipid droplet fraction. The rest
of the signal was found in the membranes and low speed
pellet (which includes unbroken cells and organelles). The
contribution of the insoluble membrane pellet, including
the cytoskeleton, was not calculated, as the pellet could not
be resuspended uniformly.
Lipid composition of DRMs and lipid droplets
The THP-1 cells contained high levels of cholesterol and
triacylglycerol. The DRM and lipid droplet fractions
differed considerably in their content of these two neutral
lipids (Table 1). As expected, the DRM fractions were
enriched in total cholesterol relative to triacylglycerol
(cholesterol/triacylglycerol ratio of 3.0) when compared
with the plasma membrane fraction from which they were
derived (ratio of 1.5), and the DSM fractions (ratio 1.0). The
DRM fraction contained about 35% of the total cellular
cholesterol and 23% of the total cellular triacylglycerol.
Conversely, the lipid droplet fraction was enriched in
triacylglycerol (cholesterol/triacylglycerol ratio 0.6), as was
the lipid droplet fraction floating on the top of the sucrose
gradient (ratio 0.5, not shown). The lipid droplet fraction
contained 15.4% of the total cellular triacylglycerol, and this
fraction plus the supernatant fraction (which presumably
also contains lipid droplets) contained 40.3% of the cellular
triacylgycerols.
The major neutral and polar lipid components of DRM
and DSM fractions from CEM-T4, THP-1 and Jurkat cells
were examined qualitatively by TLC. The dominant neutral
lipid in the Jurkat DRM fractions (from both stimulated
and nonstimulated cells) was free cholesterol, with a small
amount of triacylglycerol and free fatty acid. CEM-T4
DRM fractions contained mainly free cholesterol and
cholesterol ester, whereas THP-1 DRMs, by contrast,
contained predominantly free cholesterol, triacylglycerol,
Fig. 5. Examination of THP-1 gradient fractions by
1
HNMRspectro-
scopy. Spectra of dialysed DRM fractions (4–6) isolated from
1.56 · 10
9
cells, and the corresponding dialysed fractions from a blank
(control) sucrose gradient are shown in A and B, respectively. The
spectrum of the DRMs is dominated by CH
2
resonances at 1.3 p.p.m.,
which are absent in the control, and present at a much reduced level
in the dialysed DSM fractions shown in C. DSM control fractions
resembled those in B (not shown). The absence of detergent contami-
nation in A, B and C can be confirmed by comparison with the
spectrum of Triton X-100 [1% (v/v) in NaCl/P
i
(–)
2
H
2
O], shown
in D. PABA (20 lL of a 10-m
M
solution) was added as an internal
standard in A, B and C.
Fig. 4. Examination of THP-1 cells by
1
H NMR spectroscopy and the
distribution of proteins following sucrose gradient centrifugation. The 1D
1
H NMR spectrum of intact THP-1 cells, dominated by CH
2
reso-
nances at 1.3 p.p.m., is shown in A. After fractionation of THP-1
membranes, proteins in each sucrose gradient fraction were subjected
to SDS/PAGE, electrotransferred to nitrocellulose and immunoblot-
tedwithantibodiestoDRMmarkers,CD4andHck,andantibodiesto
protein disulphide isomerase (PDI, endoplasmic reticulum) and tub-
ulin (cytoskeleton), followed by ECL detection, shown in B. Lysates
were also loaded as controls.
2096 L. C. Wright et al.(Eur. J. Biochem. 270) Ó FEBS 2003
and small amounts of cholesterol ester, ether-linked triacyl-
glycerol and free fatty acids. Phosphatidylcholine (PtdCho),
sphingomyelin and other phospholipids were present in the
polar lipid component of all DRMs.
DSM fractions from CEM-T4 cells contained mainly free
cholesterol and PtdCho, and those from THP-1 cells
contained mainly cholesterol ester, triacylglycerol and
PtdCho. Small amounts of other phospholipids were
detected also. Apart from GM1, the glycolipid content of
DRM and DSM fractions was not determined.
The fatty acid composition of the total lipids extracted
from the various fractions of the THP-1 cells is shown in
Table 2. Surprisingly, the DRM fractions were not enriched
in saturated fatty acids, relative to the cell homogenate and
the total membrane fraction, except for a very small increase
in myristic acid (14:0). Rather there was a small increase in
palmitoleic acid (16:1), 18:2 + 18:3, and arachidonic acid
(20:4) at the expense of palmitic, stearic and oleic acids (16:0,
18:0, 18:1, respectively). The DSM fractions contained
higher levels of 18:0, 18:2 + 18:3 and 18:1 at the expense of
16:0, 14:0 and 16:1, whereas there was a marked increase in
the amount of 16:0 and a decrease in the amount of 16:1 and
17:1 in the lipid droplet fraction (Table 2). The fatty acid
analyses of fractions taken from blank gradients revealed no
contamination from Triton X-100.
We next compared the levels of the sphingolipid, GM1, in
THP-1 DRMs and lipid droplets by dot-blot analysis using
biotinylated cholera toxin (Fig. 8A). After accounting for
fraction volumes, the enrichment of GM1 in DRMs relative
to lipid droplets was found to be greater than 250-fold.
Fig. 6. The 2D COSY spectrum of the THP-1 DRM fraction. The 1D
spectrum is shown on top. Crosspeaks identified previously as arising
from protons associated with lipid [20] are indicated by A–G¢,indi-
cating that the DRM spectrum is dominated by resonances arising
from lipid. Lys, lysine; CHOH, polyol and/or carbohydrate residues.
Fig. 7.
1
H NMR spectra of THP-1 cytoplasmic lipid droplets and
plasma membranes. Lipid droplets (A) were isolated by high speed
centrifugation (105 000 g) of cellular, organelle-depleted homogenates
and represented the milky layer at the top of the supernatant. This
layer was dialysed against NaCl/P
i
(–) and NaCl/P
i
(–)
2
H
2
O was added
to a final concentration of 10%. Intense CH
2
resonances were visible at
1.3 p.p.m. in the lipid droplets, but were obviously less prominent in
the membrane-containing pellet (B) obtained after removal of the lipid
droplets and supernatant and resuspended in NaCl/P
i
(–)
2
H
2
O. PABA
(20 lLofa10-m
M
solution) was added as internal standard to both
samples.
Table 1. Cholesterol, triglyceride and NMR-visible lipid content of
THP-1 cell fractions. Results are expressed as lmol of CH
2
equivalents
(NMR-visible lipid) or lipid species (cholesterol and triacylglycerols)
per 1.56 · 10
9
cells. The total cellular content is the sum of the top four
fractions. Percentage compositions are shown in brackets. The method
for calculation of the amount of NMR-visible lipid is described in the
Materials and methods section.
Fraction
NMR-visible
lipid Cholesterol Triacylgycerols
Low speed pellet 2.47(13.7) 0.90(10.4) 0.42(9.7)
Membranes 4.30(23.8) 3.41(39.4) 2.17(50.0)
Supernatant 8.46(46.8) 3.93(45.5) 1.08(24.9)
Lipid droplets 2.84(15.7) 0.40(4.6) 0.67(15.4)
Total cellular content 18.07 8.64 4.34
DRM fractions 2.24(12.4) 3.00(34.7) 1.00(23.0)
DSM fractions 0.38(2.1) 0.31(3.6) 0.31(7.1)
Ó FEBS 2003
1
H NMR of cells/Triton-insoluble membrane fractions (Eur. J. Biochem. 270) 2097
Protein content of DRMs and lipid droplets
The protein profiles of DRMs and lipid droplets were
compared by SDS/PAGE (Fig. 8B). Prior to analysis, lipid
droplets were subjected to sucrose density gradient centri-
fugation to remove potentially contaminating cytoplasmic
proteins, and the resulting milky layer at the top of fraction 1
was collected. We confirmed that these droplets also do not
stain positive for GM1 (results not shown). Proteins were
visualized by Coomassie Blue staining, and densitometric
scanning revealed that the DRM fraction contained 500
times more protein than the lipid droplet fraction. This was
calculated after taking into account that protein from 30%
and 1.25% of the total lipid droplet and DRM fractions,
respectively, was loaded onto the gel. Although there were
protein bands of similar size in both fractions between 45 and
55 kDa, there were clearly bands unique to each fraction (see
arrows). This finding, together with the relatively low level of
the GM1 glycolipid in lipid droplets, and the differences in
fatty acid and neutral lipid content, is further evidence that
lipid droplets and DRMs are distinct subcellular fractions.
Discussion
Microscopically, detergent-resistant plasma membrane
domains have proved difficult to detect [15]. However, we
can now visualize by 1D and 2D
1
H NMR spectroscopy the
mobile lipid component of such domains, which we have
found to have a protein and lipid composition characteristic
of DRMs or rafts, as described by others. While the
membrane fractionation procedure may have altered the
physical state of the lipids from that in the whole cells,
the resonances appearing in DRM spectra are probably
derived from the lipid acyl chains of triacylgycerols and
cholesterol esters, as well as small amounts of free fatty
acids. Some contribution could also come from the acyl
chains of PtdCho or sphingomyelin; however, neither the
choline headgroups of PtdCho and sphingomyelin (except
for a small peak in THP-1) nor the sphingosine chain of
sphingomyelin were visible in the NMR spectra of DRMs.
In bilayer environments, the choline headgroups are relat-
ively immobile and therefore of low visibility in NMR
spectra [7]. This suggests that headgroup mobility might
also be restricted in DRMs from some cells.
Although DRMs from three different cell types produced
NMR spectra dominated by resonances from lipid acyl
chains, we found differences in the composition of the
Fig. 8. Analysis of THP-1 DRMs and lipid droplets for GM1 and total
protein. (A) THP-1 DRMs were isolated from total membranes by
sucrose gradient fractionation as described in Materials and methods.
Lipid droplets, prepared as in the legend to Fig. 7, were subjected to
sucrose density gradient fractionation to remove any cytoplasmic
proteins and were collected from the top layer (fraction 1). Pooled
DRMs (fractions 4–8) and lipid droplets (0.5 lL of each) were spotted
onto a nitrocellulose membrane which was subsequently probed with
CT-B (2 lgÆmL
)1
). GM1 was detected by ECL. (B) Proteins from
1.25% and 30% of the total DRM and lipid droplet fractions,
respectively, were captured with Strataclean resin and separated by
SDS/PAGE. Proteins were visualized by Coomassie Blue staining.
Molecular mass markers are shown in the left lane, and bands unique
to each fraction are indicated by arrows.
Table 2. The fatty acid composition of THP-1 cell fractions. Results are
expressed as percentages of the total area under all peaks measured.
Low concentration components with <1% of the area have been
omitted from the calculations.
Fatty acid Homogenate Membranes DRM DSM
Lipid
droplets
14:0 6.08 5.68 7.19 3.29 6.88
16:0 32.28 29.39 28.23 25.59 44.76
16:1x7c 18.27 18.75 22.07 14.88 12.06
17:1 5.57 5.64 6.62 7.06 1.88
18:2 + 18:3 1.57 1.59 2.63 2.91 1.79
18:1x9c 17.66 17.85 15.01 20.83 18.44
18:1x7c 7.78 7.86 6.36 8.99 8.84
18:0 6.59 9.05 5.45 11.06 6.05
20:4 4.19 4.18 6.41 5.37 2.29
2098 L. C. Wright et al.(Eur. J. Biochem. 270) Ó FEBS 2003
neutral lipids, which could potentially contribute to these
spectra. Notably, the DRMs extracted from the monocytoid
cell line, THP-1, contained high levels of triacylgycerols,
whereas those from both of the lymphoid cells, CEM-T4 and
Jurkat, were comprised mainly of cholesterol ester and free
cholesterol/triacylgycerols, respectively. This indicates that
just as there are cell-specific differences in the proteins found
in DRMs, with cell-specific functions, there is cell-specific
variability in the neutral lipid content of DRMs. While no
quantitation was performed on the DRM lipids from
stimulated and nonstimulated Jurkat cells, it appeared that
the same components were present, therefore either an
increase in the amount of DRMs present, or in the amount of
lipid in the DRMs from the stimulated cells may explain their
more intense lipid spectra. The fact that DRMs were difficult
to detect in both stimulated and nonstimulated Jurkat cells
may be due to the qualitatitive observation that little neutral
lipid was present in this cell line and its DRMs, and also the
use of much smaller cell numbers used to prepare gradients
(10
8
), compared with the THP-1 cells (1.56 · 10
9
). While
some neutral lipids, as well as phospholipids, were present in
DSM fractions, their high protein to lipid ratio may account
for the observation of very little NMR-visible lipid.
Although triacylgycerols and cholesterol esters have been
observed in intact cells and pure plasma membrane fractions
by
1
H NMR spectroscopy and chemical analysis [5,8,20,21],
triacylgycerols, as described for the THP-1 membrane
fractions, have not previously been identified as a compo-
nent of DRMs. The authenticity of our DRM fractions was
confirmed not only by the presence of typical DRM protein
markers, but also by the presence of other DRM lipid
components described in the literature, e.g. free cholesterol,
sphingomyelin and gangliosides. There is precedence for
intercalation of triacylgycerols and cholesterol esters, at
least temporarily, into bilayers of some cell types. They form
the cores of lipoproteins, which must be translocated
through membranes for secretion [22]. Phospholipid bilay-
ers can accommodate about 3% triacylgycerol and 5%
sterol ester on a molar basis [23,24] before the neutral lipids
phase-separate to form spherical domains sandwiched
between the bilayer leaflets [25]. Such a mechanism has
been invoked for the formation of lipid droplets in the
endoplasmic reticulum [26] and in the secretion of milk [27].
Intracellular lipid droplets are surrounded by a mono-
layer of amphipathic phospholipids, glycolipids and/or
sterols that encircles the hydrophobic core of neutral lipids,
such as triacylgycerols, diacylglycerols or sterol esters
[13,14,25]. In THP-1 cells we have shown that lipid droplets
have similar NMR spectra to DRMs (compare Figs. 5A
and 7A), but contain different proportions of cholesterol
and triacylgycerols, and almost no GM1. Lipid droplets
were also enriched in saturated fatty acids, whereas DRM
lipids were more unsaturated. We now propose that the
mobile lipid visible in the NMR spectra of intact cells is
derived from at least two pools – a large, intracellular, lipid
droplet pool, and a smaller pool, specifically localized to
detergent-insoluble, plasma membrane domains.
The figure given for the contribution of acyl chains from
DRM lipids (12.4%) to the THP-1 cell spectrum is a
minimum percentage. Although no nonlipid contribution to
the lipid signal at 1.3 p.p.m. could be detected in the low
speed pellet, lipid droplets and DRM fractions, there was
(as expected) a large contribution from nonlipid compo-
nents in the supernatant fraction (see Materials and
methods). The supernatant contains only 25% of the
cellular triacylgycerol, but contributes 46.8% towards the
mobile ÔlipidÕ signal (Table 1), therefore this latter figure
would be a considerable overestimate, leading to an
overestimation of the total cellular lipid signal. Because in
THP-1 cells much of the lipid signal would derive from
triacylgycerol, a better estimate may be obtained from the
triacylgycerol content of the DRMs, namely 23% of the
total, and for the supernatant plus lipid droplet fraction a
figure of 40% might be more accurate (Table 1). Thus we
would estimate the contribution of the DRMs to the cellular
NMR-visible lipid in the range of 12–23%, with lipid
droplet contribution at around 40%. Interestingly, the
contribution of the total membrane fraction to the NMR-
visible lipid is around 24%, and as the amount of
triacylgycerol in this fraction is 50% of the total, almost
all of the NMR-visible triacylgycerol in membranes must
reside in the DRM fraction.
It could be argued that the NMR signal detected in
DRMs is merely contamination from cytoplasmic lipid
droplets. This is unlikely, for the following reasons. Firstly,
during method development, a lipid droplet preparation
from THP-1 cells (rich in NMR-visible lipid) was incubated
with membranes from CEM-T4 cells (poor in NMR-visible
lipid). After washing, no increase in membrane lipid signal
was observed, indicating that contamination by adherence
of cytoplasmic lipid droplets to membrane components
during preparation is unlikely (the small amount of droplets
remaining are floated to the top of the sucrose gradients
during fractionation). Secondly, the protein, lipid and fatty
acid composition of droplets and DRMs are quite different,
indicating that they are physically separate entities. If
contamination with droplets did occur, it would have to be
highly selective for the Triton-insoluble fraction of the
membranes, because the Triton-soluble fraction (Fig. 5C)
contains little NMR-visible lipid. Thirdly, the contamin-
ation of the DRMs would also need to be very large, since
the triacylgycerol content of DRMs is 23% of the total and
the isolated lipid droplet fraction contains only 15.4% of the
total.
The relationship between the two lipid pools (DRMs and
lipid droplets) is unclear at present. While the differences we
have shown in lipid and protein content of lipid droplets and
rafts from THP-1 cells suggest unrelated functions, both are
believed to originate in the endoplasmic reticulum/Golgi
apparatus, allowing the possibility of some physical inter-
action between them. In addition, it has been suggested that
free cholesterol may be channelled from triacylgycerol-
containing lipid droplets in the endoplasmic reticulum to
areas of tight contact between the droplet surface and the
plasma membrane, where the free cholesterol could then be
incorporated into the bilayer [14]. Both metabolic and
spatial relationships between neutral lipids (triacylgycerols
and sterol esters) and membrane phospholipids have been
found, with growing evidence of direct physical continuities
between lipid droplets and bilayer membranes [25,27]. This
deserves further investigation, especially the possibility of
translocation of lipid from droplets to DRM domains
during stimulation of some cells (e.g. Jurkats), with
subsequent effects on cell function.
Ó FEBS 2003
1
H NMR of cells/Triton-insoluble membrane fractions (Eur. J. Biochem. 270) 2099
Acknowledgements
We would like to thank Ms Leanne Hicks, Department of Infectious
Diseases, for the fatty acid analyses, and the Department of
Biochemistry (Core Pathology), Westmead Hospital for the neutral
lipid analyses. At the time of re-submission of this manuscript, we
discovered that A. Ferretti et al. have quite independently and
simultaneously come to similar conclusions, namely that NMR-visible
lipid is present in DRMs. Their work is now available in the European
Biophysical Journal online, DOI 10.1007/s00249–002-0273-8 as of
January 2003.
References
1. Hakuma
¨
ki, J.M. & Kauppinen, R.A. (2000)
1
HNMRvisible
lipids in the life and death of cells. TIBS 25, 357–362.
2. Ferretti,A.,Knijn,A.,Iorio,E.,Pulciani,S.,Giambenedetti,M.,
Molinari, A., Meshini, S., Stringaro, A., Calcabrini, A., Freitas, I.,
Strom, R., Arancia, G. & Podo, F. (1999) Biophysical and
structural characterization of
1
H-NMR-detectable mobile lipid
domains in NIH-3T3 fibroblasts. Biochim. Biophys. Acta 1438,
329–348.
3. King, N.J.C., Delikatny, E.J. & Holmes, K.T. (1994)
1
H Magnetic
resonance spectroscopy of primary human and murine cells of the
myeloid lineage. Immunomethods 4, 188–198.
4. Veale, M.F., Roberts, N.J., King, G.F. & King, N.J.C. (1997) The
generation of
1
H-NMR-detectable mobile lipid in stimulated
lymphocytes: relationship to cellular activation, the cell cycle, and
phosphatidylcholine-specific phospholipase C. Biochem. Biophys.
Res. Commun. 239, 868–874.
5.May,G.L.,Wright,L.C.,GrootObbink,K.,Byleveld,P.M.,
Garg, M.L., Ahmad, Z.I. & Sorrell, T.C. (1997) Increased satu-
rated triacylglycerol levels in plasma membranes of human
neutrophils stimulated by lipopolysaccharide. J. Lipid Res. 38,
1562–1570.
6. Mountford, C.E. & Wright, L.C. (1988) Organization of lipids in
the plasma membranes of malignant and stimulated cells: a new
model. TIBS 13, 172–177.
7. Roman,S.K.,Jeitner,T.M.,Hancock,R.,Cooper,W.A.,Ride-
out, D.C. & Delikatny, E.J. (1997) Induction of magnetic
resonance-visible lipid in a transformed human breast cell line
by tetraphenylphosphonium chloride. Int. J. Cancer 73, 570–579.
8.Wright,L.C.,GrootObbink,K.,Delikatny,E.J.,Santangelo,
R.T. & Sorrell, T.C. (2000) The origin of
1
H NMR-visible tri-
acylglycerol in human neutrophils. High fatty acid environments
result in preferential sequestration of palmitic acid into plasma
membrane triacylglycerol. Eur. J. Biochem. 267, 68–78.
9. Di Vito, M., Lenti, L., Knijn, A., Iorio, E., D’Agostino, F.,
Molinari, A., Calcabrini, A., Stringaro, A., Meschini, S., Arancia,
G.,Bozzi,A.,Strom,R.&Podo,F.(2001)
1
H NMR-visible
mobile lipid domains correlate with cytoplasmic lipid bodies in
apoptotic T-lymphoblastoid cells. Biochim. Biophys. Acta 1530,
47–66.
10. Brown, D.A. & London, E. (1998) Functions of lipid rafts in
biological membranes. Ann. Rev. Cell Dev. Biol. 14, 111–136.
11. Parolini,I.,Topa,S.,Sorice,M.,Pace,A.,Ceddia,P.,Montesoro,
E., Pavan, A., Lisanti, M.P., Peschle, C. & Sargiacomo, M. (1999)
Phorbol ester-induced disruption of the CD4-Lck complex occurs
within a detergent-resistant microdomain of the plasma mem-
brane. Involvement of the translocation of activated protein
kinase C isoforms. J. Biol. Chem. 274, 14176–14187.
12. Stefanova,I.,Horejsi,V.,Ansotegui,I.J.,Knapp,W.&Stock-
inger, H. (1991) GPI-anchored cell-surface molecules complexed
to protein tyrosine kinases. Science 254, 1016–1091.
13. Pol,A.,Luetterforst,R.,Lindsay,M.,Heino,S.,Ikonen,E.&
Parton, R.G. (2001) A caveolin dominant negative mutant
associates with lipid bodies and induces intracellular cholesterol
imbalance. J. Cell Biol. 152, 1057–1070.
14. Prattes, S., Ho
¨
rl, G., Hammer, A., Blaschitz, A., Graier, W.,
Sattler, W., Zechner, R. & Steyrer, E. (2000) Intracellular dis-
tribution and mobilization of unesterified cholesterol in adipo-
cytes: triglyceride droplets are surrounded by cholesterol-rich
ER-like surface layer structures. J. Cell Sci. 113, 2977–2989.
15. Brown, D.A. & London, E. (2000) Structure and function of
sphingolipid- and cholesterol-rich membrane rafts. J. Biol. Chem.
275, 17221–17224.
16. Pralle,A.,Keller,P.,Florin,E L.,Simons,K.&Ho
¨
rber, J.K.H.
(2000) Sphingolipid-cholesterol rafts diffuse as small entities in the
plasma membrane of mammalian cells. J. Cell Biol. 148, 997–1007.
17. Montixi,C.,Langlet,C.,Bernard,A M.,Thimonier,J.,Dubois,
C.,Wurbel,M A.,Chauvin,J P.,Pierres,M.&He,H T.(1998)
Engagement of T cell receptor triggers its recruitmen to low-den-
sity detergent-insoluble membrane domains. EMBO J. 17, 5334–
5348.
18. Braun, S., Kalinowski, H O. & Berger, S. (1998) In: 150 and More
Basic NMR Experiments,p.473.Wiley-VCH,NY.,NY.
19. Ellgaard, L. & Helenius, A. (2001) ER quality control: towards an
understanding at the molecular level. Curr. Opin. Cell Biol. 13,
431–437.
20. May,G.L.,Wright,L.C.,Holmes,K.T.,Williams,P.G.,Smith,
I.C.P.,Wright,P.E.,Fox,R.M.&Mountford,C.E.(1986)
Assignment of methylene proton resonances in NMR spectra of
embryonic and transformed cells to plasma membrane trigly-
ceride. J. Biol. Chem. 261, 3048–3053.
21. MacKinnon, W.B., May, G.L. & Mountford, C.E. (1992) Esteri-
fied cholesterol and triglyceride are present in plasma membranes
of Chinese hamster ovary cells. Eur. J. Biochem. 205, 827–839.
22. Davis, R.A. (1991) Lipoprotein structure and secretion. In:
Biochemistry of Lipids, Lipoproteins and Membranes (Vance, D.E.
& Vance, J., eds), Vol. 20 p. 419. Elsevier, Amsterdam.
23. Hamilton, J.A. (1989) Interactions of triglycerides with phos-
pholipids: incorporation into the bilayer structure and formation
of emulsions. Biochemistry 28, 2514–2520.
24. Gorrissen, H., Tulloch, A.P. & Cushley, R.J. (1982) Deuterium
magnetic resonance of triacylglycerols in phospholipid bilayers.
Chem. Phys. Lipids 31, 245–255.
25. Murphy, D.J. (2001) The biogenesis and functions of lipid bodies
in animals, plants and microorganisms. Prog. Lipid Res. 40, 325–
438.
26. Ostermeyer,A.G.,Paci,J.M.,Zeng,Y.,Lublin,D.M.,Munro,S.
& Brown, D.A. (2001) Accumulation of caveolin in the
endoplasmic reticulum redirects the protein to lipid storage drop-
lets. J. Cell Biol. 152, 1071–1078.
27. Murphy, D.J. & Vance, J. (1999) Mechanisms of lipid-body for-
mation. TIBS 24, 109–115.
2100 L. C. Wright et al.(Eur. J. Biochem. 270) Ó FEBS 2003