Báo cáo khoa học: P NMR studies of energy metabolism in xanthosine5¢-monophosphate overproducing Corynebacterium ammoniagenes pot
Bạn đang xem bản rút gọn của tài liệu. Xem và tải ngay bản đầy đủ của tài liệu tại đây (282.23 KB, 5 trang )
31
P NMR studies of energy metabolism in xanthosine-
5¢-monophosphate overproducing
Corynebacterium ammoniagenes
Yasushi Noguchi
1
, Nobuhisa Shimba
2
, Yoshio Kawahara
1
, Ei-ichiro Suzuki
2
and Shinichi Sugimoto
1
1
Fermentation & Biotechnology Laboratories and
2
Central Research Laboratories, Ajinomoto Co., Inc., Kawasaki-ku,
Kawasaki, Kanagawa, Japan
Corynebacterium ammoniagenes is an overproducer of
xanthosine-5¢-monophosphate (XMP) by consuming either
glcose (glc) or glutamic acid (glu). Its energy metabolism was
studied in vivo using
31
P NMR spectroscopy coupled with a
circulating fermentation system (CFS). CFS enabled us to
validate directly the cellular dependency on carbon sources
and changes in biomolecules produced according to altera-
tions in the cellular energetic status. For the most efficient
XMP production, the glutamic acid and glcose molar ratios
(glu/glc) in the medium were adjusted to a molar ratio of
0.31. The
31
P NMR illustrated the two distinct phases of the
cellular energetic status due to the availability of the sub-
strates from the medium. In the earlier phase, both glc
and glu were utilized, resulting in average ATP and ADP
concentrations in cells of 0.50 ± 0.17 lmolÆg
)1
of dry cell
weight (DCW) and an undetermined level
1
, respectively. The
ADP concentration in the later phase increased to
2.15 ± 1.30 lmolÆg
)1
of DCW, while the ATP concentra-
tion decreased to an undetectable level in association with a
remarkable decrease in XMP production. This decrease in
the XMP-producing ability was associated with an increase
in production of the by-product hypoxanthine. Because glu
was found to be consumed completely during the earlier
phase, glc was the only available substrate in the later phases
2
.
These findings by in vivo NMR indicate that changes in the
carbon metabolism profoundly affect XMP production by
C. ammoniagenes.
Keywords: xanthosine-5¢-monophosphate; in vivo NMR;
energy metabolism; Corynebacterium ammoniagenes.
In order to understand the microbial production of purine
and other nucleotides, evaluation of the cellular energy
metabolism is extremely important because the nucleotide
biosynthesis requires high levels of ATP [1,2]. Difficulties in
obtaining the energy metabolism profile from living cells
are details of the regulatory process of nucleotide biosyn-
thesis which remain to be studied. NMR spectroscopy has
allowed in vivo measurement of metabolite concentrations,
thereby permitting assessment of the dynamic changes in
metabolic pathways and cellular regulatory mechanisms
[3,4]. The circulating fermentation system (CFS) that we
have previously developed [5] enables us to prolong an
NMR spectroscopic measurement period under various
culture conditions.
Corynebacterium ammoniagenes is a Gram-positive,
coryneform bacterium important to the industrial pro-
duction of flavor-enhancing purine nucleotides such as
inosine-5¢-monophosphate and xanthosine-5¢-monophos-
phate [6–8]. Several studies have reported adenine
and guanine auxotrophic mutants of C. ammoniagenes
ATCC6872 that excessively secrete purine nucleotides into
their cultures [6–8]. In these studies, the balance between the
oxidative pentose phosphate (PP) cycle for supplementation
of the carbon skeleton and the tricarboxylic acid (TCA)
cycle for maximization of ATP production was discussed.
However, direct estimation of contribution of these two
metabolic pathways in the nucleotide production was not
available.
In the present study, we investigate the cellular energy
metabolism in XMP-overproducing C. ammoniagenes,
monitor phosphate-containing metabolites by using
31
P
NMR spectroscopy, and discuss cellular energetics in
nucleotide production.
Experimental procedures
Chemicals
MDP (methylene diphosphonic acid) was purchased from
Sigma Chemical Co. (St. Louis, MO, USA). All other
chemicals were commercially available and of the highest
grade.
Bacterial strain and cultivation conditions
XMP-overproducing C. ammoniagenes is an adenine and
guanine auxotrophic mutant isolated from the wild-type
strain C. ammoniagenes ATCC6872. For in vivo NMR
studies, the inoculum was prepared on 50 plates of the
modified LB medium, which was composed of 10 gÆL
)1
Correspondence to Y. Noguchi, Fermentation & Biotechnology
Laboratories, Ajinomoto Co., Inc., Suzuki-cho 1-1, Kawasaki-ku,
Kawasaki, Kanagawa 210-8681, Japan.
Fax: + 81 44 2117609, Tel.: + 81 44 2105898,
E-mail:
Abbreviations: CFS, circulating fermentation system; DCW, dry cell
weight; MDP, methylene diphosphonic acid; PP, pentose phosphate;
TCA, tricarboxylic acid cycle; XMP, xanthosine-5¢-monophosphate.
(Received 15 November 2002, revised 23 February 2003,
accepted 25 April 2003)
Eur. J. Biochem. 270, 2622–2626 (2003) Ó FEBS 2003 doi:10.1046/j.1432-1033.2003.03635.x
tryptone, 5 gÆL
)1
yeast extract, 5 gÆL
)1
NaCl, and 20 gÆL
)1
bacto-agar plus 0.01 gÆL
)1
adenine and 0.01 gÆL
)1
guanine.
For in vivo NMR experiments, fermentations were carried
out in a fermentor with an initial culture volume of 700 mL
at 30 °C and pH 6.5. XMP-overproducing strains had
been allowed to grow in the above medium supplemented
with 100 gÆL
)1
glc, 5 gÆL
)1
K
2
HPO
4
,5gÆL
)1
KH
2
PO
4
,
0.05 gÆL
)1
adenine, 0.05 gÆL
)1
guanine, 1 gÆL
)1
yeast
extract, 0.5 gÆL
)1
NaCl, 0.25 gÆL
)1
CaCl
2
,1gÆL
)1
MgSO
4
Æ4H
2
O,and0.05mgL
)1
FeSO
4
Æ7H
2
O. To optimize
medium glu/glc ratio to gain maximum XMP production,
0, 12.5, 25, 37.5 and 50 gÆL
)1
glu, respectively, were added
to the above medium. The C. ammoniagenes wild type and
Escherichia coli W3110 were cultured under the same
culture conditions.
Fermentation system
For the in vivo NMR measurements, a previously construc-
ted CFS was used [5]. In our system, the agitation speed of
the fermentor was automatically regulated to maintain the
dissolved oxygen tension (DOT) values in the fermentation
vessel. Oxygen and carbon dioxide consumption rates were
measured using an exhaust gas analyzer system (Able Co.,
Tokyo, Japan). The temperature of the whole system was
kept at 30 °C using a circulating water bath, and acidifica-
tion was corrected by automated additions of 10%
NH
4
OH.
NMR operation
Using cells at high density (> 5 g of DCWÆL
)1
),
31
PNMR
signals were recorded at 161 MHz with a Bruker DSX
400 WB spectrometer, where 4-k data points were recorded
with 1280 transients and a spectral width of 16 kHz. The
spectra were typically acquired with the following param-
eters: pulse width, 34 ls(90° flip angle); repetition time,
1.5 s. To enhance the resolution, the free induction decay
was multiplied by an exponential window function prior to
Fourier transformation. To quantify the intracellular
metabolites, MDP was used as a concentration standard
in the NMR. Partially relaxed MDP was used to estimate
metabolite concentrations following reported methods [5,9].
Analysis
The DCW was determined
3
by measurement of attenuance
(D) at 660 nm using a Shimadzu UV260 spectroscope
and comparison with an optical density vs. dry weight
calibration curve (the coefficient ¼ 2.5). The concentrations
of glc and glu were determined enzymatically using a
biotech-analyzer (Asahi Kasei Co., Tokyo, Japan). The
concentrations of XMP and hypoxanthine in the culture
were assayed by the HPLC (high-performance liquid
chromatography) method as described previously [10,11].
Results and discussion
XMP production by
C. ammoniagenes
To validate the performance of C. ammoniagenes,anXMP-
overproducing strain, cells were batch-cultured as described
in the Experimental procedures, where both glc and glu
were used as carbon sources. Both concentrations in the
growing medium were optimized to gain maximum XMP
production (Table 1). As shown in Table 1, an increase in
the glu/glc ratio (glu/glc) induced a significant increase in
XMP production, and this increase in XMP production was
coupled with a reduction in production of the by-product,
hypoxanthine. XMP production attained nearly plateau
levels at a glu/glc molar ratio of 0.31. Further increases in
glu/glc ratio to 0.61 lowered the XMP level (Table 1).
Thus, a 0.31 molar ratio of the glu/glc was standardized
for the in vivo
31
P NMR measurements to validate the
effect of glu on XMP production. Changes in D
4
together
with glc, glu, XMP, and hypoxanthine concentrations in
this culture condition are shown in Fig. 1. Under this
experimental condition, 68.9 m
M
XMP and 28.9 m
M
hypoxanthine were obtained at the end of cultivation
(Fig. 1B). A rapid increase in the specific XMP produc-
tion rate in parallel with the cell growth was observed
until 25 h of the culturing period, but the specific XMP
production rate then drastically decreased when glu in
the growing medium was thoroughly consumed (Fig. 1C).
Contrary to XMP, hypoxanthine was not accumulated
during the glu-consuming phase (phase I), but much
accumulated during the glu-deficient phase (phase II),
suggesting that hypoxanthine production was induced
through a switch in the carbon flux. In Table 1, glu
increased the XMP/Hyp ratio, being dependent on the
increased level of glu/glc ratio up to 0.46, which mainly
resulted from the extension of the length of phase I.
Additionally, a noticeable reduction in either O
2
con-
sumption or CO
2
production rates occurred during
phase II, which coincided with the onset of hypoxanthine
5
production (Fig. 1D). Cumulatively, it can be concluded
that glu availability determines the efficiency of energy
production or TCA cycle fluxes, which may specify
Table 1. Effect of glutamic acid on XMP and hypoxanthine (Hyp) production in C. ammoniagenes XMP overproducer.
6
XMP and hypoxanthine
concentrations were assayed as described in Experimental procedures. The dry cell weight (DCW) was determined by comparison with a D vs. dry
weight calibration curve.
7
Glu
(mol)
Glc
(mol)
Glu/glc
(mol/mol)
XMP
(mM)
Hyp
(m
M
) XMP/Hyp
DCW
(gÆL
)1
)
0.000 0.555 0.00 45.0 40.2 1.12 36.1
0.085 0.555 0.15 60.7 37.5 1.62 34.2
0.170 0.555 0.31 68.9 28.7 2.41 32.1
0.255 0.555 0.46 70.8 26.7 2.65 30.5
0.340 0.555 0.61 64.2 38.2 1.68 28.9
Ó FEBS 2003
31
P NMR studies in XMP producing C. ammoniagenes (Eur. J. Biochem. 270) 2623
whether primarily XMP or hypoxanthine production
takes place.
Energetic status during the XMP production phase
To understand further the regulatory mechanism of
nucleotide production, dependency of the cellular ener-
getic on the carbon source was investigated by measuring
cellular ATP and ADP by the CFS system coupled with
31
P NMR. In Fig. 2, typical NMR spectra during the
phase of XMP production (phase I) are illustrated with
peak assignments based on the previously published data
[12,13]. Under our experimental condition, sugar phos-
phate and intracellular inorganic phosphate (P
in
i
) signals
at approximately )5–0 p.p.m. were not distinct from the
accumulated XMP and inorganic phosphate added as
K
2
HPO
4
and KH
2
PO
4
for essential substrates for XMP
production.
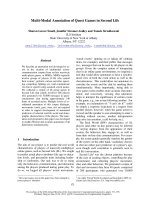
During phase I, ATPb and ATPc plus ADPb signals were
maintained at very low intensity levels. During phase II
(hypoxanthine producing phase), ATPb signals were unde-
tectable, but the ATPc plus ADPb intensity increased
fivefold in contrast to those during phase I. Chronological
changes XMP producers, i.e. cellular ATP, ADP and
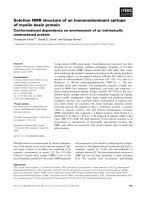
Fig. 1. Changes in growth, substrates, and products of C. ammoniagenes in the XMP-production phase. (A) Growth (j), residual glc (s), and residual
glu (h). (B) XMP (j) and hypoxanthine (m)production.(C)Glc(s)andglu(h) consumption, and XMP production rates (j). (D) Oxygen
consumption (d)andCO
2
production (s) rates. In phase I (P-I), the bacterium consumed glu in parallel with glc, and in phase II (P-II), the
bacterium consumed glc as a sole substrate. Cultivation was performed as described in the Experimental procedures.
Fig. 2. Representative
31
PNMRspectraof
metabolites from the XMP overproducer in
phase I (A) and II (B). In spectra A and B, cell
density during NMR observations were
approximately 8 gÆL
)1
and 23 gÆL
)1
, respect-
ively. Abbreviations for resonances are:
methylene diphosphonic acid (MDP), uridine
diphosphate glc (UDP-glc), b and c phosphate
of adenine nucleotide phosphates (ATPb,and
ADPb plus ATPc, respectively). The spectrum
consisted of 1280 scans and was acquired at
161 MHz with a spectral width of 16 kHz, a
90° pulse angle, and a recycling time of 1.5 s.
Chemical shifts are given in p.p.m. from
85% H
3
PO
4
.
2624 Y. Noguchi et al. (Eur. J. Biochem. 270) Ó FEBS 2003
NADP concentrations during the production phase are
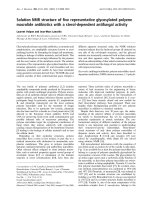
shown in Fig. 3. In phase I, ATP concentration was low but
above the detectable level, but ADP concentration was
undetectable. ADP concentration increased in phase II,
while the ATP concentration, in turn, became undetectable.
Cellular NADP as shown in Fig. 3B was kept at similar
levels throughout the cultivation period. Thus, substrate
availability seemed not to change NADP levels.
By introducing C. ammoniagenes wild-type strain
(ATCC6872) and E. coli W3110, intracellular ATP and
ADP concentrations were measured to confirm whether the
low energetic status observed in this XMP producer could
be reproduced in these two wild-type strains under the
same culture condition. Comparisons are made in Table 2.
Between the two wild-type strains, cellular ATP plus ADP
levels and ATP/ADP ratios were not significantly different
each other through phases I and II. Contrary, in the XMP
producer during phase I, the average ATP plus ADP
concentration, as well as ATP/ADP ratios, were much
lower than those in the two wild-type strains (Table 2). ATP
plus ADP concentration in the XMP producer, the mutant
C. ammoniagenes corresponded to 14% of that in the wild
type (Table 2). During phase II, the average ATP plus ADP
concentration raised 58% of that in the wild-type strain, but
ATP concentration further decreased to an undetectable
level (Table 2). Thus, low ATP levels or ATP plus ADP
concentrations continuously observed in the XMP-produ-
cing phase is specific to this strain and this low energetic
status will not be attributable to the unavailability of
substrates, but to the specific metabolic characteristic of
XMP production itself.
A prominent enlargement in the ATP and ADP pool size
from phase I to II in the XMP producer was associated with
a shift from ATP to ADP production. This shift may be
explained by an effect of glu deficiency on the central carbon
flux, which specifically occurs during XMP production. In
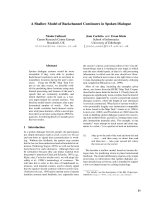
fact, an increase in ATP concentration and ATP/ADP ratio
could be induced during phase I by increasing glu concen-
tration in the culture medium (Fig. 4). Dauner et al.[14]
have simulated a maximization of the flux in riboflavin
production in Bacillus subtilis, and proposed the importance
of energy supplementation on which activities of the TCA
cycle and the respiratory chain depend. Several reports also
Fig. 3. Changes in cellular ATP, ADP and ATP/ADP of the XMP
overproducer in the production phase. (A) Cellular ATP (s)andADP
(d) concentrations are shown. (B) Cellular NADP (j)isshown.To
quantify the intracellular metabolites, MDP was used as a concen-
trationstandardintheNMR.AlldatawerenormalizedbyDCWas
described in Experimental procedures.
Table 2. Comparison of cellular metabolites between the XMP-overproducing and wild-type strains. Cultivation conditions are summarized in the
Experimental procedures. To quantify the intracellular metabolites, NADP was used as a concentration standard in the NMR. Partially relaxed
MDP
8,9
was used to estimate metabolite concentrations. ND, not determined. Values are the mean ± SD.
8,9
Strain
Average concentrations (pmolÆg
)1
of DCW)
Phase ATP ADP ATP+ADP ATP/ADP
C. ammoniagenes ATCC6872 I 3.25 ± 0.11 0.50 ± 0.21 3.70 ± 0.46 (1.00) 6.90 (1.00)
II 3.22 ± 0.21 0.54 ± 0.21 3.75 ± 0.56 (1.01) 6.83 (0.99)
E. coli W3110 I 2.85 ± 0.72 0.45 ± 0.23 3.30 ± 0.71 (0.89) 7.31 (1.06)
II 2.73 ± 0.52 0.47 ± 0.23 3.17 ± 0.62 (0.86) 7.21 (1.04)
C. ammoniagenes
XMP overproducer
10
I 0.50 ± 0. 17 ND 0.51 ± 0.18 (0.14) ND (0)
II ND 2.15 ± 1.30 2.18 ± 1.28 (0.58) ND (0)
Fig. 4. Effect of glu on intracellular ATP and ADP concentrations in the
phase I. Intracellular ATP and ADP concentrations in phase I were
estimated based on
31
P NMR data. The data shown are the mean ±
SD.
Ó FEBS 2003
31
P NMR studies in XMP producing C. ammoniagenes (Eur. J. Biochem. 270) 2625
proposed the importance of the balance between TCA and
the oxidative PP cycles in nucleotide production [14–16].
These reports suggested that an enhancement of the net flux
of the oxidative PP cycle that supplied carbon skeletons led
to a reduction of ATP production due to a reduced TCA
cycle flux in nucleotide production [14–16]. In our experi-
ment, XMP production decreased sharply during phase II,
simultaneous with an increased production of hypoxan-
thine, an XMP by-product (Fig. 1). In association with this
reduction of XMP production, glc utilization was also
reduced, indicating that the reduced XMP flux through the
PP cycle affects glc oxidation. This will result in reduction of
NADH generation rate from TCA cycle and a decrease in
ATP pool. The reduced ATP availability seems to enhance
the production of the by-product, hypoxanthine. This
cause–result corresponds well with in vivo NMR results in
this study, as well as previous reports [15–17]. A consider-
able increase in ADP synthesis was observed during phase
II; the true reason for this increase remains to be elucidated
and whether biosynthesis of adenine nucleotides is speci-
fically enhanced or oxidative phosphorylation is specifically
reduced.
This study represents the first trial of in vivo NMR
observation of bacterial nucleotide production. Our results
demonstrate that the control of energy metabolism is crucial
for bacterial nucleotide production as, for instance, main-
tenance of efficient ATP production is able to enhance
XMP production.
Acknowledgements
We are grateful to K. Sato and T. Kazarimoto for their helpful input.
References
1. Sauer, U. & Bailey, J.E. (1999) Estimation of P-to-O ratio in
Bacillus subtilis and its influence on maximum riboflavin yield.
Biotechnol. Bioeng. 64, 750–754.
2. Dauner, M. & Sauer, U. (2001) Stoichiometric growth model
for riboflavin-producing Bacillus subtilis. Biotechnol. Bioeng. 76,
132–143.
3. Barrow, K.D., Collins, J.G., Norton, R.S., Rogers, P.L. & Smith,
G.M. (1984)
31
P nuclear magnetic resonance studies of the fer-
mentation of glcose to ethanol by Zymomonas mobilis. J. Biol.
Chem. 259, 5711–5716.
4. Castro,C.D.,Koretsky,A.P.&Domach,M.M.(1999)Perfor-
mance trade-offs in in vivo chemostat NMR. Biotechnol. Prog. 15,
185–195.
5. Noguchi, Y., Shimba, N., Toyosaki, H., Ebisawa, K., Kawahara,
Y.&Suzuki,Ei.&Sugimoto,S.(2002)In vivo NMR system
for evaluating oxygen-dependent metabolic status in microbial
culture. J. Microbiol. Methods 51, 73–82.
6. Dulyaninova, N.G., Podlepa, E.M., Toulokhonova1, L.V. &
Bykhovsky, V.Y. (2000) Salvage pathway for NAD biosynthesis
in Brevibacterium ammoniagenes: regulatory properties of triphos-
phate-dependent nicotinate phosphoribosyltransferase. Biochim.
Biophys. Acta 1478, 211–220.
7. Han, J.K., Chung, S.O., Lee, J.H. & Byun, S.M. (1997)
6¢-Mercaptoguanosine-resistance is related with purF gene
encoding 5¢-phosphoribosyl-1¢-pyrophosphate amidotransferase
in inosine-5¢-monophosphate overproducing Brevibacteirum
ammoniagenes. Biotechnol. Lett. 19, 79–83.
8. Usuda, Y., Kawasaki, H. & Utagawa, T. (2001) Characterization
of the cell surface protein gene of Corynebacterium ammoniagenes.
Biochim. Biophys. Acta 1522, 138–141.
9. Neves, A.R., Ramos, A., Nunes, M.C., Kleerebezem, M., Huge-
nholtz, J., de Vos, W.M., Almeida, J. & Santos, H. (1999) In vivo
nuclear magnetic resonance studies of glycolytic kinetics in
Lactococcus lactis. Biotechnol. Bioeng. 64, 200–212.
10. Crosse, A.M., Greenway, D.L. & England, R.R. (2000) Accu-
mulation of ppGpp and ppGp in Staphylococcus aureus 8325–4
following nutrient starvation. Lett. Appl. Microbiol. 31, 332–337.
11. Meyer, S., Noisommit-Rizzi, N., Reuss, M. & Neubauer, P. (1999)
Optimized analysis of intracellular adenosine and guanosine
phosphates in Escherichia coli. Anal. Biochem. 271, 43–52.
12. Lundberg, P., Harmsen, E., Ho, C. & Vogel, H.J. (1990) Nuclear
magnetic resonance studies of cellular metabolism. Anal. Biochem.
191, 193–222.
13. Greiner, J.V., Kopp, S.J. & Glonek, T. (1985) Phosphorus nuclear
magnetic resonance and ocular metabolism. Surv. Ophthalmol. 30,
189–202.
14. Dauner, M., Bailey, J.E. & Sauer, U. (2001) Metabolic flux ana-
lysis with a comprehensive isotopomer model in Bacillus subtilis.
Biotechnol. Bioeng. 76, 144–156.
15. Sauer, U., Hatzimanikatis, V., Hohmann, H.P., Manneberg, M.,
van Loon, A.P. & Bailey, J.E. (1996) Physiology and metabolic
fluxes of wild-type and riboflavin-producing Bacillus subtilis. Appl.
Environ. Microbiol. 62, 3687–3696.
16. Dauner, M., Sonderegger, M., Hochuli, M., Szyperski, T.,
Wuthrich, K., Hohmann, H.P., Sauer, U. & Bailey, J.E. (2002)
Intracellular carbon fluxes in riboflavin-producing Bacillus subtilis
during growth on two-carbon substrate mixtures. Appl. Environ.
Microbiol. 68, 1760–1771.
17. Kovarova-Kovar,K.,Gehlen,S.,Kunze,A.,Keller,T.,Daniken,
R.V., Kolb, M. & van Loon, A.P. (2000) Application of model-
predictive control based on artificial neural networks to optimize
the fed-batch process for riboflavin production. J. Biotechnol. 79,
39–52.
2626 Y. Noguchi et al. (Eur. J. Biochem. 270) Ó FEBS 2003