Báo cáo khoa học: "A Simple, Similarity-based Model for Selectional Preferences" pdf
Bạn đang xem bản rút gọn của tài liệu. Xem và tải ngay bản đầy đủ của tài liệu tại đây (215.57 KB, 8 trang )
Proceedings of the 45th Annual Meeting of the Association of Computational Linguistics, pages 216–223,
Prague, Czech Republic, June 2007.
c
2007 Association for Computational Linguistics
A Simple, Similarity-based Model for Selectional Preferences
Katrin Erk
University of Texas at Austin
Abstract
We propose a new, simple model for the auto-
matic induction of selectional preferences, using
corpus-based semantic similarity metrics. Fo-
cusing on the task of semantic role labeling,
we compute selectional preferences for seman-
tic roles. In evaluations the similarity-based
model shows lower error rates than both Resnik’s
WordNet-based model and the EM-based clus-
tering model, but has coverage problems.
1 Introduction
Selectional preferences, which characterize typ-
ical arguments of predicates, are a very use-
ful and versatile knowledge source. They have
been used for example for syntactic disambigua-
tion (Hindle and Rooth, 1993), word sense dis-
ambiguation (WSD) (McCarthy and Carroll,
2003) and semantic role labeling (SRL) (Gildea
and Jurafsky, 2002).
The corpus-based induction of selectional
preferences was first proposed by Resnik (1996).
All later approaches have followed the same two-
step procedure, first collecting argument head-
words from a corpus, then generalizing to other,
similar words. Some approaches have used
WordNet for the generalization step (Resnik,
1996; Clark and Weir, 2001; Abe and Li, 1993),
others EM-based clustering (Rooth et al., 1999).
In this paper we propose a new, simple model
for selectional preference induction that uses
corpus-based semantic similarity metrics, such
as Cosine or Lin’s (1998) mutual information-
based metric, for the generalization step. This
model does not require any manually created
lexical resources. In addition, the corpus for
computing the similarity metrics can be freely
chosen, allowing greater variation in the domain
of generalization than a fixed lexical resource.
We focus on one application of selectional
preferences: semantic role labeling. The ar-
gument positions for which we compute selec-
tional preferences will be semantic roles in the
FrameNet (Baker et al., 1998) paradigm, and
the predicates we consider will be semantic
classes of words rather than individual words
(which means that different preferences will be
learned for different senses of a predicate word).
In SRL, the two most pressing issues today are
(1) the development of strong semantic features
to complement the current mostly syntactically-
based systems, and (2) the problem of the do-
main dependence (Carreras and Marquez, 2005).
In the CoNLL-05 shared task, participating sys-
tems showed about 10 points F-score difference
between in-domain and out-of-domain test data.
Concerning (1), we focus on selectional prefer-
ences as the strongest candidate for informative
semantic features. Concerning (2), the corpus-
based similarity metrics that we use for selec-
tional preference induction open up interesting
possibilities of mixing domains.
We evaluate the similarity-based model
against Resnik’s WordNet-based model as well
as the EM-based clustering approach. In the
evaluation, the similarity-model shows lower er-
ror rates than both Resnik’s WordNet-based
model and the EM-based clustering model.
However, the EM-based clustering model has
higher coverage than both other paradigms.
Plan of the paper. After discussing previ-
216
ous approaches to selectional preference induc-
tion in Section 2, we introduce the similarity-
based model in Section 3. Section 4 describes
the data used for the experiments reported in
Section 5, and Section 6 concludes.
2 Related Work
Selectional restrictions and selectional prefer-
ences that predicates impose on their arguments
have long been used in semantic theories, (see
e.g. (Katz and Fo dor, 1963; Wilks, 1975)). The
induction of selectional preferences from corpus
data was pioneered by Resnik (1996). All sub-
sequent approaches have followed the same two-
step procedure, first collecting argument head-
words from a corpus, then generalizing over the
seen headwords to similar words. Resnik uses
the WordNet noun hierarchy for generalization.
His information-theoretic approach models the
selectional preference strength of an argument
position
1
r
p
of a predicate p as
S(r
p
) =
c
P (c|r
p
) log
P (c|r
p
)
P (c)
where the c are WordNet synsets. The prefer-
ence that r
p
has for a given synset c
0
, the selec-
tional association between the two, is then de-
fined as the contribution of c
0
to r
p
’s selectional
preference strength:
A(r
p
, c
0
) =
P (c
0
|r
p
) log
P (c
0
|r
p
)
P (c
0
)
S(r
p
)
Further WordNet-based approaches to selec-
tional preference induction include Clark and
Weir (2001), and Abe and Li (1993). Brock-
mann and Lapata (2003) perform a comparison
of WordNet-based models.
Rooth et al. (1999) generalize over seen head-
words using EM-based clustering rather than
WordNet. They model the probability of a word
w occurring as the argument r
p
of a predicate p
as being independently conditioned on a set of
classes C:
P (r
p
, w) =
c∈C
P (c, r
p
, w) =
c∈C
P (c)P (r
p
|c)P (w|c)
1
We write r
p
to indicate predicate-specific roles, like
“the direct object of catch”, rather than just “obj”.
The parameters P (c), P(r
p
|c) and P (w|c) are
estimated using the EM algorithm.
While there have been no isolated compar-
isons of the two generalization paradigms that
we are aware of, Gildea and Jurafsky’s (2002)
task-based evaluation has found clustering-
based approaches to have better coverage than
WordNet generalization, that is, for a given role
there are more words for which they can state a
preference.
3 Model
The approach we are proposing makes use of
two corpora, a primary corpus and a gener-
alization corpus (which may, but need not, be
identical). The primary corpus is used to extract
tuples (p, r
p
, w) of a predicate, an argument
position and a seen headword. The general-
ization corpus is used to compute a corpus-based
semantic similarity metric.
Let Seen(r
p
) be the set of seen headwords for
an argument r
p
of a predicate p. Then we model
the selectional preference S of r
p
for a possible
headword w
0
as a weighted sum of the similari-
ties between w
0
and the seen headwords:
S
r
p
(w
0
) =
w∈Seen(r
p
)
sim(w
0
, w) · wt
r
p
(w)
sim(w
0
, w) is the similarity between the seen
and the potential headword, and wt
r
p
(w) is the
weight of seen headword w.
Similarity sim(w
0
, w) will be computed on
the generalization corpus, again on the ba-
sis of extracted tuples (p, r
p
, w). We will
be using the similarity metrics shown in Ta-
ble 1: Cosine, the Dice and Jaccard coefficients,
and Hindle’s (1990) and Lin’s (1998) mutual
information-based metrics. We write f for fre-
quency, I for mutual information, and R(w) for
the set of arguments r
p
for which w occurs as a
headword.
In this paper we only study corpus-based met-
rics. The sim function can equally well be in-
stantiated with a WordNet-based metric (for
an overview see Budanitsky and Hirst (2006)),
but we restrict our experiments to corpus-based
metrics (a) in the interest of greatest possible
217
sim
cosine
(w, w
) =
P
r
p
f(w,r
p
)·f(w
,r
p
)
q
P
r
p
f(w,r
p
)
2
·
q
P
r
p
f(w
,r
p
)
2
sim
Dice
(w, w
) =
2·|R(w)∩R(w
)|
|R(w)|+|R(w
)|
sim
Lin
(w, w
) =
P
r
p
∈R(w)∩R(w
)
I(w,r,p)I(w
,r,p)
P
r
p
∈R(w)
I(w,r,p)
P
r
p
∈R(w)
I(w
,r,p)
sim
Jaccard
(w, w
) =
|R(w)∩R(w
)|
|R(w)∪R(w
)|
sim
Hindle
(w, w
) =
r
p
sim
Hindle
(w, w
, r
p
) where
sim
Hindle
(w, w
, r
p
) =
min(I(w,r
p
),I(w
,r
p
) if I(w, r
p
) > 0 and I(w
, r
p
) > 0
abs(max(I(w,r
p
),I(w
,r
p
))) if I(w, r
p
) < 0 and I(w
, r
p
) < 0
0 else
Table 1: Similarity measures used
resource-independence and (b) in order to be
able to shape the similarity metric by the choice
of generalization corpus.
For the headword weights wt
r
p
(w), the sim-
plest possibility is to assume a uniform weight
distribution, i.e. wt
r
p
(w) = 1. In addition, we
test a frequency-based weight, i.e. wt
r
p
(w) =
f(w, r
p
), and inverse document frequency, which
weighs a word according to its discriminativity:
wt
r
p
(w) = log
num. words
num. words to whose context w belongs
.
This similarity-based model of selectional
preferences is a straightforward implementa-
tion of the idea of generalization from seen
headwords to other, similar words. Like the
clustering-based model, it is not tied to the
availability of WordNet or any other manually
created res ource. The model uses two corpora,
a primary corpus for the extraction of seen head-
words and a generalization corpus for the com-
putation of semantic similarity metrics. This
gives the model flexibility to influence the simi-
larity metric through the choice of text domain
of the generalization corpus.
Instantiation used in this paper. Our aim
is to compute selectional preferences for seman-
tic roles. So we choose a particular instantia-
tion of the similarity-based model that makes
use of the fact that the two-corpora approach
allows us to use different notions of “predicate”
and “argument” in the primary and general-
ization corpus. Our primary c orpus will con-
sist of m anually semantically annotated data,
and we will use semantic verb classes as pred-
icates and semantic roles as arguments. Ex-
amples of extracted (p, r
p
, w) tuples are (Moral-
ity evaluation, Evaluee, gamblers) and (Placing,
Goal, briefcase). Semantic similarity, on the
other hand, will be computed on automatically
syntactically parsed corpus, where the predi-
cates are words and the arguments are syntac-
tic dependents. Examples of extracted (p, r
p
, w)
tuples from the generalization corpus include
(catch, obj, frogs) and (intervene, in, deal).
2
This instantiation of the similarity-based
model allows us to compute word sense specific
selectional preferences, generalizing over manu-
ally semantically annotated data using automat-
ically syntactically annotated data.
4 Data
We use FrameNet (Baker et al., 1998), a se-
mantic lexicon for English that groups words
in semantic classes called frames and lists se-
mantic roles for each frame. The FrameNet
1.3 annotated data com prises 139,439 sentences
from the British National Corpus (BNC). For
our experiments, we chose 100 frame-specific se-
mantic roles at random, 20 each from five fre-
quency bands: 50-100 annotated occurrences
of the role, 100-200 occurrences, 200-500, 500-
1000, and more than 1000 occurrences. The
annotated data for these 100 roles comprised
59,608 sentences, our primary corpus. To deter-
mine headwords of the semantic roles, the cor-
pus was parsed using the Collins (1997) parser.
Our generalization c orpus is the BNC. It was
parsed using Minipar (Lin, 1993), which is con-
siderably faster than the Collins parser but
failed to parse about a third of all sentences.
2
For details about the syntactic and semantic analyses
used, see Section 4.
218
Accordingly, the arguments r extracted from
the generalization corpus are Minipar depen-
dencies, except that paths through preposition
nodes were collapsed, using the preposition as
the dependency relation. We obtained parses for
5,941,811 sentences of the generalization corpus.
The EM-based clustering model was com-
puted with all of the FrameNet 1.3 data (139,439
sentences) as input. Resnik’s model was trained
on the primary corpus (59,608 sentences).
5 Experiments
In this section we describe experiments com-
paring the similarity-based model for selectional
preferences to Resnik’s WordNet-based model
and to an EM-based clustering model
3
. For the
similarity-based model we test the five similar-
ity metrics and three weighting schemes listed
in section 3.
Experimental design
Like Rooth et al. (1999) we evaluate selectional
preference induction approaches in a pseudo-
disambiguation task. In a test set of pairs
(r
p
, w), each headword w is paired with a con-
founder w
chosen randomly from the BNC ac-
cording to its frequency
4
. Noun headwords are
paired with noun confounders in order not to
disadvantage Resnik’s model, which only works
with nouns. The headword/confounder pairs
are only computed once and reused in all cross-
validation runs. The task is to choose the more
likely role headword from the pair (w, w
).
In the main part of the expe riment, we count
a pair as covered if both w and w
are assigned
some level of preference by a model (“full cover-
age”). We contrast this with another condition,
where we count a pair as covered if at least one
of the two words w, w
is as signed a level of pref-
erence by a model (“half coverage”). If only one
is assigned a preference, that word is counted as
chosen.
To test the performance difference between
models for significance, we use Dietterich’s
3
We are grateful to Carsten Brockmann and Detlef
Prescher for the use of their software.
4
We exclude potential confounders that occur less
than 30 or more than 3,000 times.
Error Rate Coverage
Cosine 0.2667 0.3284
Dice 0.1951 0.3506
Hindle 0.2059 0.3530
Jaccard 0.1858 0.3506
Lin 0.1635 0.2214
EM 30/20 0.3115 0.5460
EM 40/20 0.3470 0.9846
Resnik 0.3953 0.3084
Table 2: Error rate and coverage (micro-
average), similarity-based models with uniform
weights.
5x2cv (Dietterich, 1998). The test involves
five 2-fold cross-validation runs. Let d
i,j
(i ∈
{1, 2}, j ∈ {1, . . . , 5}) be the difference in error
rates between the two models when using split
i of cross-validation run j as training data. Let
s
2
j
= (d
1,j
−
¯
d
j
)
2
+(d
2,j
−
¯
d
j
)
2
be the variance for
cross-validation run j, with
¯
d
j
=
d
1,j
+d
2,j
2
. Then
the 5x2cv
˜
t statistic is defined as
˜
t =
d
1,1
1
5
5
j=1
s
2
j
Under the null hypothesis, the
˜
t statistic has
approximately a t distribution with 5 degrees of
freedom.
5
Results and discussion
Error rates. Table 2 shows error rates and
coverage for the different selectional prefer-
ence induction methods. The first five mod-
els are similarity-based, computed with uniform
weights. The name in the first column is the
name of the similarity metric used. Next come
EM-based clustering models, using 30 (40) clus-
ters and 20 re-estimation steps
6
, and the last
row lists the results for Resnik’s WordNet-based
method. Results are micro-averaged.
The table shows very low error rates for the
similarity-based models, up to 15 points lower
than the EM-based models. The error rates
5
Since the 5x2cv test fails when the error rates vary
wildly, we excluded cases where error rates differ by 0.8
or more across the 10 runs, using the threshold recom-
mended by Dietterich.
6
The EM-based clustering software determines good
values for these two parameters through pseudo-
disambiguation tests on the training data.
219
Cos Dic Hin Jac Lin EM 40/20 Resnik
Cos -16 (73) -12 (73) -18 (74) -22 (57) 11 (67) 11 (74)
Dic 16 (73) 2 (74) -8 (85) -10 (64) 39 (47) 27 (62)
Hin 12 (73) -2 (74) -8 (75) -11 (63) 33 (57) 16 (67)
Jac 18 (74) 8 (85) 8 (75) -7 (68) 42 (45) 30 (62)
Lin 22 (57) 10 (64) 11 (63) 7 ( 68) 29 (41) 28 (51)
EM 40/20 -11 ( 67 ) -39 ( 47 ) -33 ( 57 ) -42 ( 45 ) -29 ( 41 ) 3 ( 72 )
Resnik -11 (74) -27 (62) -16 (67) -30 (62) -28 (51) -3 (72)
Table 3: Comparing similarity measures: number of wins minus losses (in brackets non-significant
cases) using Dietterich’s 5x2cv; uniform weights; condition (1): both members of a pair must be
covered
0
0.05
0.1
0.15
0.2
0.25
0.3
0.35
0.4
0 100 200 300 400 500
error_rate
numhw
Learning curve: num. headwords, sim_based-Jaccard-Plain, error_rate, all
Mon Apr 09 02:30:47 2007
1000-
100-200
500-1000
200-500
50-100
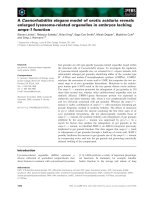
Figure 1: Le arning curve: seen headwords ver-
sus error rate by frequency band, Jaccard, uni-
form weights
50-100 100-200 200-500 500-1000 1000-
Cos 0.3167 0.3203 0.2700 0.2534 0.2606
Jac 0.1802 0.2040 0.1761 0.1706 0.1927
Table 4: Error rates for similarity-based mod-
els, by semantic role frequency band. Micro-
averages, uniform weights
of Resnik’s model are considerably higher than
both the EM-based and the similarity-based
models, which is unexpected. While EM-based
models have be en shown to work better in SRL
tasks (Gildea and Jurafsky, 2002), this has been
attributed to the difference in coverage.
In addition to the full coverage condition, we
also computed error rate and coverage for the
half coverage case. In this condition, the error
rates of the EM-based models are unchanged,
while the error rates for all similarity-based
models as well as Resnik’s model rise to values
between 0.4 and 0.6. So the EM-based model
tends to have preferences only for the “right”
words. Why this is so is not clear. It may be a
genuine property, or an artifact of the FrameNet
data, which only contains chosen, illustrative
sentences for each frame. It is possible that
these sentences have fewer occurrences of highly
frequent but semantically less informative role
headwords like “it” or “that” exactly because of
their illustrative purpose.
Table 3 inspects differences between error
rates using Die tterich’s 5x2cv, basically c onfirm-
ing Table 2. Each cell shows the wins minus
losses for the method listed in the row when
compared against the method in the column.
The number of cases that did not reach signifi-
cance is given in brackets.
Coverage. The coverage rates of the
similarity-based models, while comparable
to Resnik’s model, are considerably lower than
for EM-based clustering, which achieves good
coverage with 30 and almost perfect coverage
with 40 clusters (Table 2). While peculiarities
of the FrameNet data may have influenced the
results in the EM-based model’s favor (see the
discussion of the half coverage condition above),
the low coverage of the similarity-based models
is still surprising. After all, the generalization
corpus of the similarity-based models is far
larger than the corpus used for clustering.
Given the learning curve in Figure 1 it is
unlikely that the reason for the lower cover-
age is data sparseness. However, EM-based
clustering is a soft clustering method, which
relates every predicate and every headword to
every cluster, if only with a very low probabil-
220
ity. In similarity-based models, on the other
hand, two words that have never been seen in
the same argument slot in the generalization
corpus will have zero similarity. That is, a
similarity-based model can ass ign a level of
preference for an argument r
p
and word w
0
only
if R(w
0
) ∩ R(Seen(r
p
)) is nonempty. Since the
flexibility of similarity-based models exte nds to
the vector space for computing similarities, one
obvious remedy to the coverage problem would
be the use of a less sparse vector space. Given
the low error rates of similarity-based models,
it may even be advisable to use two vector
spaces, backing off to the denser one for words
not covered by the sparse but highly accurate
space used in this paper.
Parameters of similarity-based models.
Besides the similarity metric itself, which we dis-
cuss below, parameters of the similarity-based
models include the number of seen headwords,
the weighting scheme, and the number of similar
words for each headword.
Table 4 breaks down error rates by semantic
role frequency band for two of the similarity-
based models, micro-averaging over roles of the
same frequency band and over cross-validation
runs. As the table shows, there was some vari-
ation across frequency bands, but not as much
as between models.
The question of the number of seen headwords
necessary to compute selectional preferences is
further explored in Figure 1. The figure charts
the number of seen headwords against error rate
for a Jaccard similarity-based model (uniform
weights). As can be seen, error rates reach a
plateau at about 25 seen headwords for Jaccard.
For other similarity metrics the result is similar.
The weighting schemes wt
r
p
had surprisingly
little influence on results. For Jaccard similar-
ity, the model had an error rate of 0.1858 for
uniform weights, 0.1874 for frequency weight-
ing, and 0.1806 for discriminativity. For other
similarity metrics the results were similar.
A cutoff was used in the similarity-based
model: For each seen headword, only the 500
most similar words (according to a given sim-
ilarity measure) were included in the computa-
Cos Dic Hin Jac Lin
(a) Freq. sim. 1889 3167 2959 3167 860
(b) Freq. wins 65% 73% 79% 72% 58%
(c) Num. sim. 81 60 67 60 66
(d) Intersec. 7.3 2.3 7.2 2.1 0.5
Table 5: Comparing sim. metrics: (a) avg. freq.
of similar words; (b) % of times the more fre-
quent word won; (c) number of distinct similar
words per seen headword; (d) avg. size of inter-
section between roles
tion; for all others, a similarity of 0 was assumed.
Experiments testing a range of values for this
parameter show that error rates stay stable for
parameter values ≥ 200.
So similarity-based models seem not overly
sensitive to the weighting scheme used, the num-
ber of seen headwords, or the number of similar
words per s ee n headword. The difference be-
tween similarity me trics, however, is striking.
Differences between similarity metrics.
As Table 2 shows, Lin and Jaccard worked best
(though Lin has very low coverage), Dice and
Hindle not as good, and Cosine showed the worst
performance. To determine possible reasons for
the difference, Table 5 explores properties of the
five similarity measures.
Given a set S = Seen(r
p
) of seen headwords
for some role r
p
, each similarity metric produces
a set like(S) of words that have nonzero simi-
larity to S, that is, to at least one word in S.
Line (a) shows the average frequency of words
in like(S). The results confirm that the Lin
and Cosine metrics tend to propose less frequent
words as similar.
Line (b) pursues the question of the frequency
bias further, showing the percentage of head-
word/confounder pairs for which the more fre-
quent of the two words “won” in the pseudo-
disambiguation task (using uniform weights).
This it is an indirect estimate of the frequency
bias of a similarity metric. Note that the head-
word actually was more frequent than the con-
founder in only 36% of all pairs.
These first two tests do not yield any expla-
nation for the low performance of Cosine, as the
results they show do not separate Cosine from
221
Jaccard Cosine
Ride vehicle:Vehicle truck 0.05 boat 0.05
coach 0.04 van 0.04 ship 0.04 lorry 0.04 crea-
ture 0.04 flight 0.04 guy 0.04 carriage 0.04 he-
licopter 0.04 lad 0.04
Ingest substance:Substance loaf 0.04 ice
cream 0.03 you 0.03 some 0.03 that 0.03 er
0.03 photo 0.03 kind 0.03 he 0.03 type 0.03
thing 0.03 milk 0.03
Ride vehicle:Vehicle it 1.18 there 0.88 they
0.43 that 0.34 i 0.23 ship 0.19 second one 0.19
machine 0.19 e 0.19 other one 0.19 response
0.19 second 0.19
Ingest substance:Substance there 1.23
that 0.50 object 0.27 argument 0.27 theme
0.27 version 0.27 machine 0.26 result 0.26
response 0.25 item 0.25 concept 0.25 s 0.24
Table 6: Highest-ranked induced headwords (seen headwords omitted) for two semantic classes of
the verb “take”: similarity-based models, Jaccard and Cosine, uniform weights.
all other metrics. Lines (c) and (d), however, do
just that. Line (c) looks at the size of like(S).
Since we are using a cutoff of 500 similar words
computed per word in S, the size of like(S) can
only vary if the same word is suggested as similar
for several seen headwords in S. This way, the
size of like(S) functions as an indicator of the
degree of uniformity or similarity that a sim-
ilarity metric “perceives” among the membe rs
of S. To facilitate comparison across frequency
bands, line (c) normalizes by the size of S, show-
ing
|like(S)|
|S|
micro-averaged over all roles. Here
we see that Cosine s ee ms to “perceive” consid-
erably less similarity among the seen headwords
than any of the other metrics.
Line (d) looks at the sets s
25
(r) of the 25 most
preferred potential headwords of roles r, show-
ing the average size of the intersection s
25
(r) ∩
s
25
(r
) between two roles (preferences computed
with uniform weights). It indicates another pos-
sible reason for Cosine’s problem: Cosine seems
to keep proposing the same words as similar for
different roles. We will see this tendency also in
the sample results we discuss next.
Sample results. Table 6 shows samples of
headwords induced by the similarity-based
model for two FrameNet senses of the verb
“take”: Ride
vehicle (“take the bus”) and In-
gest substance (“take drugs”), a semantic class
that is exclusively about ingesting controlled
substances. The semantic role Vehicle of the
Ride vehicle frame and the role Substance of In-
gest substance are both typically realized as the
direct object of “take”. The table only shows
new induced headwords; seen headwords were
omitted from the list.
The particular implementation of the
similarity-based model we have chosen, using
frames and roles as predicates and arguments
in the primary corpus, should enable the model
to c ompute preferences specific to word senses.
The sample in Table 6 shows that this is indeed
the case: The preferences differ considerably
for the two senses (frames) of “take”, at least
for the Jaccard metric, which shows a clear
preference for vehicles for the Vehicle role. The
Substance role of Ingest substance is harder to
characterize, with very diverse seen headwords
such as “crack”, “lines”, “fluid”, “speed”.
While the highest-ranked induced words for
Jaccard do include three food items, there is
no word, with the possible exception of “ice
cream”, that could be construed as a controlled
substance. The induced headwords for the
Cosine metric are considerably less pertinent
for both roles and show the above-mentioned
tendency to repeat some high-frequency words.
The inspection of “take” anecdotally con-
firms that different selectional preferences are
learned for different senses. This point (which
comes down to the usability of selectional pref-
erences for WSD) should be verified in an em-
pirical evaluation, possibly in another pseudo-
disambiguation task, choosing as confounders
seen headwords for other senses of a predicate
word.
6 Conclusion
We have introduced the similarity-based model
for inducing selectional preferences. Comput-
ing selectional preference as a weighted sum of
similarities to seen headwords, it is a straight-
222
forward implementation of the idea of general-
ization from seen headwords to other, similar
words. The similarity-based model is particu-
larly simple and easy to compute, and seems not
very sensitive to parameters. Like the EM-based
clustering model, it is not dependent on lexical
resources. It is, however, more flexible in that it
induces similarities from a separate generaliza-
tion corpus, which allows us to control the simi-
larities we compute by the choice of text domain
for the generalization corpus. In this paper we
have used the model to compute sense-specific
selectional preferences for semantic roles.
In a pseudo-disambiguation task the simila-
rity-based model showed error rates down to
0.16, far lower than both EM-based clustering
and Resnik’s WordNet model. However its cov-
erage is considerably lower than that of EM-
based clustering, comparable to Resnik’s model.
The most probable reason for this is the spar-
sity of the underlying vector space. The choice
of similarity metric is critical in similarity-based
models, with Jaccard and Lin achieving the best
performance, and Cosine surprisingly bringing
up the rear.
Next steps will be to tes t the similarity-based
model “in vivo”, in an SRL task; to test the
model in a WSD task; to evaluate the model on
a primary corpus that is not semantically ana-
lyzed, for greater comparability to previous ap-
proaches; to explore other vector spaces to ad-
dress the coverage issue; and to experiment on
domain transfer, using an appropriate general-
ization corpus to induce selectional preferences
for a domain different from that of the primary
corpus. This is especially relevant in view of the
domain-dependence problem that SRL faces.
Acknowledgements Many thanks to Jason
Baldridge, Razvan Bunescu, Stefan Evert, Ray
Mooney, Ulrike and Sebastian Pad´o, and Sabine
Schulte im Walde for helpful discussions.
References
N. Abe and H. Li. 1993. Learning word association
norms using tree cut pair models. In Proceedings of
ICML 1993.
C. Baker, C. Fillmore, and J. Lowe. 1998. The Berkeley
FrameNet project. In Proceedings of COLING-ACL
1998, Montreal, Canada.
C. Brockmann and M. Lapata. 2003. Evaluating and
combining approaches to selectional preference acqui-
sition. In Proceedings of EACL 2003, Budapest.
A. Budanitsky and G. Hirst. 2006. Evaluating WordNet-
based measures of semantic distance. Computational
Linguistics, 32(1).
X. Carreras and L. Marquez. 2005. Introduction to the
CoNLL-2005 shared task: Sem antic role labeling. In
Proceedings of CoNLL-05, Ann Arbor, MI.
S. Clark and D. Weir. 2001. Class-based probability
estimation using a semantic hierarchy. In Proceedings
of NAACL 2001, Pittsburgh, PA.
M. Collins. 1997. Three generative, lexicalised models
for statistical parsing. In Proceedings of ACL 1997,
Madrid, Spain.
T. Dietterich. 1998. Approximate statistical tests
for comparing supervised classification learning algo-
rithms. Neural Computation, 10:1895–1923.
D. Gildea and D. Jurafsky. 2002. Automatic labeling of
semantic roles. Computational Linguistics, 28(3):245–
288.
D. Hindle and M. Rooth. 1993. Structural ambiguity and
lexical relations. Computational Linguistics, 19(1).
D. Hindle. 1990. Noun classification from predicate-
argument structures. In Proceedings of ACL 1990,
Pittsburg, Pennsylvania.
J. Katz and J. Fodor. 1963. T he structure of a semantic
theory. Language, 39(2).
D. Lin. 1993. Principle-based parsing without overgen-
eration. In Proceedings of ACL 1993, Columbus, OH.
D. Lin. 1998. Automatic retrieval and clustering of
similar words. In Proceedings of COLING-ACL 1998,
Montreal, Canada.
D. McCarthy and J. Carroll. 2003. Disambiguating
nouns, verbs and adjectives using automatically ac-
quired selectional preferences. Computatinal Linguis-
tics, 29(4).
P. Resnik. 1996. Selectional constraints: An
information-theoretic model and its computational re-
alization. Cognition, 61:127–159.
M. Rooth, S. Riezler, D. Prescher, G. Carroll, and F. Beil.
1999. Inducing an semantically annotated lexicon via
EM-based clustering. In Proceedings of ACL 1999,
Maryland.
Y. Wilks. 1975. Preference semantics. In E. Keenan,
editor, Formal Semantics of Natural Language. Cam-
bridge University Press.
223