Báo cáo khoa học: "Sentiment Polarity Identification in Financial News: A Cohesion-based Approach" pdf
Bạn đang xem bản rút gọn của tài liệu. Xem và tải ngay bản đầy đủ của tài liệu tại đây (123.58 KB, 8 trang )
Proceedings of the 45th Annual Meeting of the Association of Computational Linguistics, pages 984–991,
Prague, Czech Republic, June 2007.
c
2007 Association for Computational Linguistics
Sentiment Polarity Identification in Financial News:
A Cohesion-based Approach
Ann Devitt
School of Computer Science & Statistics,
Trinity College Dublin, Ireland
Khurshid Ahmad
School of Computer Science & Statistics,
Trinity College Dublin, Ireland
Abstract
Text is not unadulterated fact. A text can
make you laugh or cry but can it also make
you short sell your stocks in company A and
buy up options in company B? Research in
the domain of finance strongly suggests that
it can. Studies have shown that both the
informational and affective aspects of news
text affect the markets in profound ways, im-
pacting on volumes of trades, stock prices,
volatility and even future firm earnings. This
paper aims to explore a computable metric
of positive or negative polarity in financial
news text which is consistent with human
judgments and can be used in a quantita-
tive analysis of news sentiment impact on fi-
nancial markets. Results from a preliminary
evaluation are presented and discussed.
1 Introduction
Research in sentiment analysis has emerged to ad-
dress the research questions: what is affect in text?
what features of text serve to convey it? how can
these features be detected and measured automati-
cally. Sentence and phrase level sentiment analy-
sis involves a systematic examination of texts, such
as blogs, reviews and news reports, for positive,
negative or neutral emotions (Wilson et al., 2005;
Grefenstette et al., 2004). The term “sentiment
analysis” is used rather differently in financial eco-
nomics where it refers to the derivation of market
confidence indicators from proxies such as stock
prices and trading volumes. There is a tradition
going back to the Nobel Sveriges–Riksbank Laure-
ates Herbert Simon (1978 Prize) and Daniel Kah-
neman (2002 Prize), that shows that investors and
traders in such markets can behave irrationally and
that this bounded rationality is inspired by what the
traders and investors hear from others about the con-
ditions that may or may not prevail in the markets.
Robert Engle (2003 Prize) has given a mathematical
description of the asymmetric and affective impact
of news on prices: positive news is typically related
to large changes in prices but only for a short time;
conversely the effect of negative news on prices and
volumes of trading is longer lasting. The emergent
domain of sociology of finance examines financial
markets as social constructs and how communica-
tions, such as e-mails and news reports, may be
loaded with sentiment which could distort market
trading (MacKenzie, 2003).
It would appear that news affects the markets
in profound ways, impacting on volumes of trade,
stock returns, volatility of prices and even future
firm earnings. In the domain of news impact analy-
sis in finance, in recent years the focus has expanded
from informational to affective content of text in an
effort to explain the relationship between text and
the markets. All text, be it news, blogs, accounting
reports or poetry, has a non-factual dimension con-
veying opinion, invoking emotion, providing a nu-
anced perspective of the factual content of the text.
With the increase of computational power and lex-
ical and corpus resources it seems computationally
feasible to detect some of the affective content of
text automatically. The motivation for the work re-
ported here is to identify a metric for sentiment po-
984
larity which reliably replicates human evaluations
and which is readily derivable from free text. This
research is being carried out in the context of a study
of the impact of news and its attendant biases on
financial markets, formalizing earlier multi-lingual,
corpus-based empirical work that analysed change
in sentiment and volume of news in large financial
news corpora (Ahmad et al., 2006). A systematic
analysis of the impact of news bias or polarity on
market variables requires a numeric value for senti-
ment intensity, as well as a binary tag for sentiment
polarity, to identify trends in the sentiment indica-
tor as well as turning points. In this approach, the
contribution to an overall sentiment polarity and in-
tensity metric of individual lexical items which are
“affective” by definition is determined by their con-
nectivity and position within a representation of the
text as a whole based on the principles of lexical co-
hesion. The contribution of each element is there-
fore not purely additive but rather is mitigated by its
relevance and position relative to other elements.
Section 2 sets out related work in the sentiment
analysis domain both in computational linguistics
and in finance where these techniques have been
applied with some success. Section 3 outlines the
cohesion-based algorithm for sentiment polarity de-
tection, the resources used and the benefits of using
the graph-based text representation approach. This
approach was evaluated relative to a small corpus of
gold standard sentiment judgments. The derivation
of the gold standard and details of the evaluation are
outlined in section 4. The results are presented and
discussed in section 5 and section 6 concludes with
a look at future challenges for this research.
2 Related Work
2.1 Cognitive Theories of Emotion
In order to understand how emotion can be realised
in text, we must first have a notion of what emo-
tion is and how people experience it. Current cogni-
tive theories of what constitutes emotion are divided
between two primary approaches: categorical and
dimensional. The Darwinian categorical approach
posits a finite set of basic emotions which are expe-
rienced universally across cultures, (e.g. anger, fear,
sadness, surprise (Ekman and Friesen, 1971)). The
second approach delineates emotions according to
multiple dimensions rather than into discrete cate-
gories. The two primary dimensions in this account
are a good–bad axis, the dimension of valence or
evaluation, and a strong-weak axis, the dimension
of activation or intensity (Osgood et al., 1957). The
work reported here aims to conflate the evaluation
and activation dimensions into one metric with the
size of the value indicating strength of activation and
its sign, polarity on the evaluation axis.
2.2 Sentiment Analysis
Sentiment analysis in computational linguistics has
focused on examining what textual features (lexi-
cal, syntactic, punctuation, etc) contribute to affec-
tive content of text and how these features can be
detected automatically to derive a sentiment metric
for a word, sentence or whole text. Wiebe and col-
leagues have largely focused on identifying subjec-
tivity in texts, i.e. identifying those texts which are
affectively neutral and those which are not. This
work has been grounded in a strong human evalu-
ative component. The subjectivity identification re-
search has moved from initial work using syntactic
class, punctuation and sentence position features for
subjectivity classifiers to later work using more lex-
ical features like gradation of adjectives or word fre-
quency (Wiebe et al., 1999; Wiebe et al., 2005). Oth-
ers, such as Turney (2002), Pang and Vaithyanathan
(2002), have examined the positive or negative po-
larity, rather than presence or absence, of affective
content in text. Kim and Hovy (2004), among oth-
ers, have combined the two tasks, identifying sub-
jective text and detecting its sentiment polarity. The
indicators of affective content have been drawn from
lexical sources, corpora and the world wide web and
combined in a variety of ways, including factor anal-
ysis and machine learning techniques, to determine
when a text contains affective content and what is
the polarity of that content.
2.3 Sentiment and News Impact Analysis
Niederhoffer (1971), academic and hedge fund man-
ager, analysed 20 years of New York Times head-
lines classified into 19 semantic categories and on a
good-bad rating scale to evaluate how the markets
reacted to good and bed news: he found that mar-
kets do react to news with a tendency to overreact
to bad news. Somewhat prophetically, he suggests
985
that news should be analysed by computers to intro-
duce more objectivity in the analysis. Engle and Ng
(1993) proposed the news impact curve as a model
for how news impacts on volatility in the market
with bad news introducing more volatility than good
news. They used the market variable, stock returns,
as a proxy for news, an unexpected drop in returns
for bad news and an unexpected rise for good news.
Indeed, much early work used such market variables
or readily quantifiable aspects of news as a proxy for
the news itself: e.g. news arrival, type, provenance
and volumes (Cutler et al., 1989; Mitchell and Mul-
herin, 1994). More recent studies have proceeded
in a spirit of computer-aided objectivity which en-
tails determining linguistic features to be used to
automatically categorise text into positive or nega-
tive news. Davis et al (2006) investigate the effects
of optimistic or pessimistic language used in finan-
cial press releases on future firm performance. They
conclude that a) readers form expectations regard-
ing the habitual bias of writers and b) react more
strongly to reports which violate these expectations,
strongly suggesting that readers, and by extension
the markets, form expectations about and react to not
only content but also affective aspects of text. Tet-
lock (2007) also investigates how a pessimism fac-
tor, automatically generated from news text through
term classification and principal components analy-
sis, may forecast market activity, in particular stock
returns. He finds that high negativity in news pre-
dicts lower returns up to 4 weeks around story re-
lease. The studies establish a relationship between
affective bias in text and market activity that market
players and regulators may have to address.
3 Approach
3.1 Cohesion-based Text Representation
The approach employed here builds on a cohesion-
based text representation algorithm used in a news
story comparison application described in (Devitt,
2004). The algorithm builds a graph representa-
tion of text from part-of-speech tagged text without
disambiguation using WordNet (Fellbaum, 1998) as
a real world knowledge source to reduce informa-
tion loss in the transition from text to text-based
structure. The representation is designed within the
theoretical framework of lexical cohesion (Halliday
and Hasan, 1976). Aspects of the cohesive struc-
ture of a text are captured in a graph representation
which combines information derived from the text
and WordNet semantic content. The graph structure
is composed of nodes representing concepts in or de-
rived from the text connected by relations between
these concepts in WordNet, such as antonymy or hy-
pernymy, or derived from the text, such as adjacency
in the text. In addition, the approach provides the
facility to manipulate or control how the WordNet
semantic content information is interpreted through
the use of topological features of the knowledge
base. In order to evaluate the relative contribution
of WordNet concepts to the information content of a
text as a whole, a node specificity metric was derived
based on an empirical analysis of the distribution of
topological features of WordNet such as inheritance,
hierarchy depth, clustering coefficients and node de-
gree and how these features map onto human judg-
ments of concept specificity or informativity. This
metric addresses the issue of the uneven population
of most knowledge bases so that the local idiosyn-
cratic characteristics of WordNet can be mitigated
by some of its global features.
3.2 Sentiment Polarity Overlay
By exploiting existing lexical resources for senti-
ment analysis, an explicit affective dimension can
be overlaid on this basic text model. Our approach
to polarity measurement, like others, relies on a lex-
icon of tagged positive and negative sentiment terms
which are used to quantify positive/negative senti-
ment. In this first iteration of the work, SentiWN
(Esuli and Sebastiani, 2006) was used as it provides
a readily interpretable positive and negative polarity
value for a set of “affective” terms which conflates
Osgood’s (1957) evaluative and activation dimen-
sions. Furthermore, it is based on WordNet 2.0 and
can therefore be integrated into the existing text rep-
resentation algorithm, where some nodes in the co-
hesion graph carry a SentiWN sentiment value and
others do not. The contribution of individual polar-
ity nodes to the polarity metric of the text as a whole
is then determined with respect to the textual infor-
mation and WN semantic and topological features
encoded in the underlying graph representation of
the text. Three polarity metrics were implemented
to evaluate the effectiveness of exploiting different
986
aspects of the cohesion-based graph structure.
Basic Cohesion Metric is based solely on frequency
of sentiment-bearing nodes in or derived from the
source text, i.e. the sum of polarity values for all
nodes in the graph.
Relation Type Metric modifies the basic metric
with respect to the types of WordNet relations in the
text-derived graph. For each node in the graph, its
sentiment value is the product of its polarity value
and a relation weight for each relation this node en-
ters into in the graph structure. Unlike most lexical
chaining algorithms, not all WordNet relations are
treated as equal. In this sentiment overlay, the rela-
tions which are deemed most relevant are those that
potentially denote a relation of the affective dimen-
sion, like antonymy, and those which constitute key
organising principles of the database, such as hy-
pernymy. Potentially affect-effecting relations have
the strongest weighting while more amorphous rela-
tions, such as “also see”, have the lowest.
Node Specificity Metric modifies the basic metric
with respect to a measure of node specificity calcu-
lated on the basis of topographical features of Word-
Net. The intuition behind this measure is that highly
specific nodes or concepts may carry more informa-
tional and, by extension, affective content than less
specific ones. We have noted the difficulty of using
a knowledge base whose internal structure is not ho-
mogeneous and whose idiosyncrasies are not quanti-
fied. The specificity measure aims to factor out pop-
ulation sparseness or density in WordNet by evaluat-
ing the contribution of each node relative to its depth
in the hierarchy, its connectivity (branchingFactor)
and its siblings:
Spc =
(depth+ln(siblings)−ln(branchingF actor))
NormalizingF actor
(1)
The three metrics are further specialised according
to the following two boolean flags:
InText: the metric is calculated based on 1) only
those nodes representing terms in the source text, or
2) all nodes in the graph representation derived from
the text. In this way, the metrics can be calculated
using information derived from the graph represen-
tation, such as node specificity, without potentially
noisy contributions from nodes not in the source text
but related to them, via relations such as hypernymy.
Modifiers: the metric is calculated using all open
class parts of speech or modifiers alone. On a cur-
sory inspection of SentiWN, it seems that modifiers
have more reliable values than nouns or verbs. This
option was included to test for possible adverse ef-
fects of the lexicon.
In total for each metric there are four outcomes com-
bining inText true/false and modifiers true/false.
4 Evaluation
The goal of this research is to examine the relation-
ship between financial markets and financial news,
in particular the polarity of financial news. The do-
main of finance provides data and methods for solid
quantitative analysis of the impact of sentiment po-
larity in news. However, in order to engage with
this long tradition of analysis of the instruments and
related variables of the financial markets, the quan-
titative measure of polarity must be not only easy
to compute, it must be consistent with human judg-
ments of polarity in this domain. This evaluation is
a first step on the path to establishing reliability for
a sentiment measure of news. Unfortunately, the fo-
cus on news, as opposed to other text types, has its
difficulties. Much of the work in sentiment analy-
sis in the computational linguistics domain has fo-
cused either on short segments, such as sentences
(Wilson et al., 2005), or on longer documents with
an explicit polarity orientation like movie or prod-
uct reviews (Turney, 2002). Not all news items may
express overt sentiment. Therefore, in order to test
our hypothesis, we selected a news topic which was
considered a priori to have emotive content.
4.1 Corpus
Markets react strongest to information about firms
to which they have an emotional attachment (Mac-
Gregor et al., 2000). Furthermore, takeovers and
mergers are usually seen as highly emotive contexts.
To combine these two emotion-enhancing factors,
a corpus of news texts was compiled on the topic
of the aggressive takeover bid of a low-cost airline
(Ryanair) for the Irish flag-carrier airline (Aer Lin-
gus). Both airlines have a strong (positive and nega-
tive) emotional attachment for many in Ireland. Fur-
thermore, both airlines are highly visible within the
country and have vocal supporters and detractors
in the public arena. The corpus is drawn from the
987
national media and international news wire sources
and spans 4 months in 2006 from the flotation of
the flag carrier on the stock exchange in Septem-
ber 2006, through the “surprise” take-over bid an-
nouncement by Ryanair, to the withdrawal of the bid
by Ryanair in December 2006.
1
4.2 Gold Standard
A set of 30 texts selected from the corpus was anno-
tated by 3 people on a 7-point scale from very pos-
itive to very negative. Given that a takeover bid has
two players, the respondents were asked also to rate
the semantic orientation of the texts with respect to
the two players, Ryanair and Aer Lingus. Respon-
dents were all native English speakers, 2 female and
1 male. To ensure emotional engagement in the task,
they were first asked to rate their personal attitude to
the two airlines. The ratings in all three cases were
on the extreme ends of the 7 point scale, with very
positive attitudes towards the flag carrier and very
negative attitudes towards the low-cost airline. Re-
spondent attitudes may impact on their text evalu-
ations but, given the high agreement of attitudes in
this study, this impact should at least be consistent
across the individuals in the study. A larger study
should control explicitly for this variable.
As the respondents gave ratings on a ranked scale,
inter-respondent reliability was determined using
Krippendorf’s alpha, a modification of the Kappa
coefficient for ordinal data (Krippendorff, 1980). On
the general ranking scale, there was little agreement
(kappa = 0.1685), corroborating feedback from re-
spondents on the difficulty of providing a general
rating for text polarity distinct from a rating with re-
spect to one of the two companies. However, there
was an acceptable degree of agreement (Grove et al.,
1981) on the Ryanair and Aer Lingus polarity rat-
ings, kappa = 0.5795 and kappa = 0.5589 respec-
tively. Results report correlations with these ratings
which are consistent and, from the financial market
perspective, potentially more interesting.
2
1
A correlation analysis of human sentiment ratings with
Ryanair and Aer Lingus stock prices for the last quarter of 2006
was conducted. The findings suggest that stock prices were cor-
related with ratings with respect to Aer Lingus, suggesting that,
during this takeover period, investors may have been influenced
by sentiment expressed in news towards Aer Lingus. However,
the timeseries is too short to ensure statistical significance.
2
Results in this paper are reported with respect to the
4.3 Performance Metrics
The performance of the polarity algorithm was eval-
uated relative to a corpus of human-annotated news
texts, focusing on two separate dimensions of polar-
ity:
1. Polarity direction: the task of assigning a bi-
nary positive/negative value to a text
2. Polarity intensity: the task of assigning a value
to indicate the strength of the negative/positive
polarity in a text.
Performance on the former is reported using stan-
dard recall and precision metrics. The latter is re-
ported as a correlation with average human ratings.
4.4 Baseline
For the metrics in section 3, the baseline for compar-
ison sums the SentiWN polarity rating for only those
lexical items present in the text, not exploiting any
aspect of the graph representation of the text. This
baseline corresponds to the Basic Cohesion Metric,
with inT ext = true (only lexical items in the text)
and modifiers = f alse (all parts of speech).
5 Results and Discussion
5.1 Binary Polarity Assignment
The baseline results for positive ratings, negative rat-
ings and overall accuracy for the task of assigning a
polarity tag are reported in table 1. The results show
Type Precision Recall FScore
Positive 0.381 0.7273 0.5
Negative 0.667 0.3158 0.4286
Overall 0.4667 0.4667 0.4667
Table 1: Baseline results
that the baseline tends towards the positive end of
the rating spectrum, with high recall for positive rat-
ings but low precision. Conversely, negative ratings
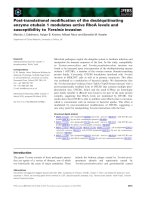
have high precision but low recall. Figures 1 to 3
illustrate the performance for positive, negative and
overall ratings of all metric–inText–Modifier combi-
nations, enumerated in table 2, relative to this base-
line, the horizontal. Those metrics which surpass
this line are deemed to outperform the baseline.
Ryanair ratings as they had the highest inter-rater agreement.
988
1 Cohesion 5 Relation 9 NodeSpec
2 CohesionTxt 6 RelationTxt 10 NodeSpecTxt
3 CohesionMod 7 RelationMod 11 NodeSpecMod
4 CohesionTxtMod 8 RelationTxtMod 12 NodeSpecTxtMod
Table 2: Metric types in Figures 1-3
Figure 1: F Score for Positive Ratings
All metrics have a bias towards positive ratings
with attendant high positive recall values and im-
proved f-score for positive polarity assignments.
The Basic Cohesion Metric marginally outperforms
the baseline overall indicating that exploiting the
graph structure gives some added benefit. For the
Relations and Specificity metrics, system perfor-
mance greatly improves on the baseline for the
modifiers = true options, whereas, when all parts
of speech are included (modifier = f alse), perfor-
mance drops significantly. This sensitivity to inclu-
sion of all word classes could suggest that modifiers
are better indicators of text polarity than other word
classes or that the metrics used are not appropriate
to non-modifier parts of speech. The former hypoth-
esis is not supported by the literature while the latter
is not supported by prior successful application of
these metrics in a text comparison task. In order to
investigate the source of this sensitivity, we intend to
examine the distribution of relation types and node
specificity values for sentiment-bearing terms to de-
termine how best to tailor these metrics to the senti-
ment identification task.
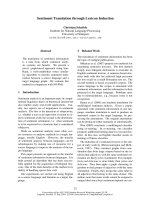
A further hypothesis is that the basic polarity val-
ues for non-modifiers are less reliable than for ad-
jectives and adverbs. On a cursory inspection of po-
larity values of nouns and adjectives in SentiWN, it
would appear that adjectives are somewhat more re-
liably labelled than nouns. For example, crime and
Figure 2: F Score for Negative Ratings
some of its hyponyms are labelled as neutral (e.g.
forgery) or even positive (e.g. assault) whereas crim-
inal is labelled as negative. This illustrates a key
weakness in a lexical approach such as this: over-
reliance on lexical resources. No lexical resource is
infallible. It is therefore vital to spread the associ-
ated risk by using more than one knowledge source,
e.g. multiple sentiment lexica or using corpus data.
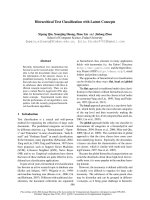
Figure 3: F Score for All Ratings
5.2 Polarity Intensity Values
The results on the polarity intensity task parallel the
results on polarity tag assignment. Table 3 sets out
the correlation coefficients for the metrics with re-
spect to the average human rating. Again, the best
performers are the relation type and node specificity
metrics using only modifiers, significant to the 0.05
level. Yet the correlation coefficients overall are not
very high. This would suggest that perhaps the re-
lationship between the human ranking scale and the
automatic one is not strictly linear. Although the hu-
man ratings map approximately onto the automati-
989
cally derived scale, there does not seem to be a clear
one to one mapping. The section that follows discuss
this and some of the other issues which this evalua-
tion process has brought to light.
Metric inText Modifier Correlation
Basic Cohesion No No 0.47**
Yes No 0.42*
No Yes 0.47**
Yes Yes 0.47**
Relation Type No No -0.1**
Yes No -0.13*
No Yes 0.5**
Yes Yes 0.38*
Node Specificity No No 0.00
Yes No -0.03
No Yes 0.48**
Yes Yes 0.38*
Table 3: Correlation Coefficients for human ratings.
**. Significant at the 0.01 level. *. Significant at the 0.05 level.
5.3 Issues
The Rating Scale and Thresholding
Overall the algorithm tends towards the positive end
of the spectrum in direct contrast to human raters
with 55-70% of all ratings being negative. Further-
more, the correlation of human to algorithm ratings
is significant but not strongly directional. It would
appear that there are more positive lexical items in
text, hence the algorithm’s positive bias. Yet much
of this positivity is not having a strong impact on
readers, hence the negative bias observed in these
evaluators. This raises questions about the scale of
human polarity judgments: are people more sensi-
tive to negativity in text? is there a positive baseline
in text that people find unremarkable and ignore?
To investigate this issue, we will conduct a compar-
ative corpus analysis of the distribution of positive
and negative lexical items in text and their perceived
strengths in text. The results of this analysis should
help to locate sentiment turning points or thresholds
and establish an elastic sentiment scale which allows
for baseline but disregarded positivity in text.
The Impact of the Lexicon
The algorithm described here is lexicon-based, fully
reliant on available lexical resources. However, we
have noted that an over-reliance on lexica has its
disadvantages, as any hand-coded or corpus-derived
lexicon will have some degree of error or inconsis-
tency. In order to address this issue, it is neces-
sary to spread the risk associated with a single lex-
ical resource by drawing on multiple sources, as in
(Kim and Hovy, 2005). The SentiWN lexicon used
in this implementation is derived from a seed word
set supplemented WordNet relations and as such it
has not been psychologically validated. For this rea-
son, it has good coverage but some inconsistency.
Whissel’s Dictionary of Affect (1989) on the other
hand is based entirely on human ratings of terms.
It’s coverage may be narrower but accuracy might
be more reliable. This dictionary also has the advan-
tage of separating out Osgood’s (1957) evaluative
and activation dimensions as well as an “imaging”
rating for each term to allow a multi-dimensional
analysis of affective content. The WN Affect lexi-
con (Valitutti et al., 2004) again provides somewhat
different rating types where terms are classified in
terms of denoting or evoking different physical or
mental affective reactions. Together, these resources
could offer not only more accurate base polarity val-
ues but also more nuanced metrics that may better
correspond to human notions of affect in text.
The Gold Standard
Sentiment rating evaluation is not a straight-forward
task. Wiebe et al (2005) note many of the difficul-
ties associated human sentiment ratings of text. As
noted above, it can be even more difficult when eval-
uating news where the text is intended to appear im-
partial. The attitude of the evaluator can be all im-
portant: their attitude to the individuals or organi-
sations in the text, their professional viewpoint as a
market player or an ordinary punter, their attitude to
uncertainty and risk which can be a key factor in the
world of finance. In order to address these issues for
the domain of news impact in financial markets, the
expertise of market professionals must be elicited to
determine what they look for in text and what view-
point they adopt when reading financial news. In
econometric analysis, stock price or trading volume
data constitute an alternative gold standard, repre-
senting a proxy for human reaction to news. For eco-
nomic significance, the data must span a time period
of several years and compilation of a text and stock
990
price corpus for a large scale analysis is underway.
6 Conclusions and Future Work
This paper presents a lexical cohesion based met-
ric of sentiment intensity and polarity in text and
an evaluation of this metric relative to human judg-
ments of polarity in financial news. We are con-
ducting further research on how best to capture a
psychologically plausible measure of affective con-
tent of text by exploiting available resources and a
broader evaluation of the measure relative to human
judgments and existing metrics. This research is ex-
pected to contribute to sentiment analysis in finance.
Given a reliable metric of sentiment in text, what
is the impact of changes in this value on market
variables? This involves a sociolinguistic dimension
to determine what publications or texts best charac-
terise or are most read and have the greatest influ-
ence in this domain and the economic dimension of
correlation with economic indicators.
References
Khurshid Ahmad, David Cheng, and Yousif Almas. 2006.
Multi–lingual sentiment analysis in financial news streams.
In Proc. of the 1st Intl. Conf. on Grid in Finance, Italy.
David M. Cutler, James M. Poterba, and Lawrence H. Sum-
mers. 1989. What moves stock prices. Journal of Portfolio
Management, 79:223–260.
Angela K. Davis, Jeremy M. Piger, and Lisa M. Sedor. 2006.
Beyond the numbers: An analysis of optimistic and pes-
simistic language in earnings press releases. Technical re-
port, Federal Reserve Bank of St Louis.
Ann Devitt. 2004. Methods for Meaningful Text Representation
and Comparison. Ph.D. thesis, Trinity College Dublin.
Paul Ekman and W. V. Friesen. 1971. Constants across cultures
in the face and emotion. Journal of Personality and Social
Psychology, 17:124–129.
Robert F. Engle and Victor K. Ng. 1993. Measuring and test-
ing the impact of news on volatility. Journal of Finance,
48(5):1749–1778.
Andrea Esuli and Fabrizio Sebastiani. 2006. Sentiwordnet: A
publicly available lexical resource for opinion mining. In
Proceedings of LREC 2006.
Christiane Fellbaum. 1998. WordNet,an electronic lexical
database. MIT Press.
Gregory Grefenstette, Yan Qu, James G. Shanahan, and
David A. Evans. 2004. Coupling niche browsers and affect
analysis for an opinion mining application. In Proceedings
of RIAO-04, pages 186–194.
William N. Grove, Nancy C. Andreasen, Patricia McDonald-
Scott, Martin B. Keller, and Robert W. Shapiro. 1981. Reli-
ability studies of psychiatric diagnosis. theory and practice.
Archives of General Psychiatry, 38:408–413.
Michael A. K. Halliday and Ruqaiya Hasan. 1976. Cohesion in
English. Longman.
Soo-Min Kim and Eduard Hovy. 2004. Determining the senti-
ment of opinions. In Proceedings of COLING 2004.
Soo-Min Kim and Eduard Hovy. 2005. Automatic detection of
opinion bearing words and sentences. In Proc. of IJCNLP-
05, Jeju Island, Korea.
Klaus Krippendorff. 1980. Content Analysis: an Introduction
to its Methodology. Sage Publications, Beverly Hills, CA.
Donald G. MacGregor, Paul Slovic, David Dreman, and
Michael Berry. 2000. Imagery, affect, and financial judg-
ment. The Journal of Psychology and Financial Markets,
1(2):104–110.
Donald MacKenzie. 2003. Long-term capital management and
the sociology of arbitrage. Economy and Society, 32:349–
380.
Mark L. Mitchell and J. Harold Mulherin. 1994. The impact of
public information on the stock market. Journal of Finance,
49(3):923–950.
Victor Niederhoffer. 1971. The analysis of world events and
stock prices. Journal of Business, 44(2):193–219.
Charles E. Osgood, George J. Suci, and Percy H. Tannenbaum.
1957. The Measurement of meaning. University of Illinois
Press, Chicago, Ill.
Bo Pang, Lillian Lee, and Shivakumar Vaithyanathan. 2002.
Thumbs up? Sentiment classification using machine learning
techniques. In Proc. of EMNLP-02, pages 79–86.
Paul C. Tetlock. 2007. Giving content to investor sentiment:
The role of media in the stock market. Journal of Finance.
forthcoming.
Peter D. Turney. 2002. Thumbs up or thumbs down? semantic
orientation applied to unsupervised classification of reviews.
In Proceedings of ACL’02, pages 417–424.
Alessandro Valitutti, Carlo Strapparava, and Oliviero Stock.
2004. Developing affective lexical resources. PsychNology
Journal, 2(1):61–83.
Cynthia Whissell. 1989. The dictionary of affect in language.
In R. Plutchik and H. Kellerman, editors, Emotion: theory
research and experience, volume 4. Acad. Press, London.
Janyce M. Wiebe, Rebecca F. Bruce, and Thomas P. O’Hara.
1999. Development and use of a gold-standard data set for
subjectivity classifications. In Proceedings of ACL-99.
Janyce Wiebe, Theresa Wilson, and Claire Cardie. 2005. An-
notating expressions of opinions and emotions in language.
Language Resources and Evaluation, 39:165–210.
Theresa Wilson, Janyce Wiebe, and Paul Hoffmann. 2005.
Recognizing contextual polarity in phrase-level sentiment
analysis. In Proc. of HLT/EMNLP-2005, pages 347–354.
991