Báo cáo khoa học: "Automatic Detection of Poor Speech Recognition at the Dialogue Level" potx
Bạn đang xem bản rút gọn của tài liệu. Xem và tải ngay bản đầy đủ của tài liệu tại đây (762.44 KB, 8 trang )
Automatic Detection of Poor Speech Recognition
at the Dialogue Level
Diane J.
Litman, Marilyn A. Walker and Michael S. Kearns
AT&T Labs Research
180 Park Ave, Bldg 103
Florham Park, N.J. 07932
{diane, walker, mkearns}@research, att. com
Abstract
The dialogue strategies used by a spoken dialogue
system strongly influence performance and user sat-
isfaction. An ideal system would not use a single
fixed strategy, but would adapt to the circumstances
at hand. To do so, a system must be able to identify
dialogue properties that suggest adaptation. This
paper focuses on identifying situations where the
speech recognizer is performing poorly. We adopt
a machine learning approach to learn rules from
a dialogue corpus for identifying these situations.
Our results show a significant improvement over the
baseline and illustrate that both lower-level acoustic
features and higher-level dialogue features can af-
fect the performance of the learning algorithm.
1 Introduction
Builders of spoken dialogue systems face a number
of fundamental design choices that strongly influ-
ence both performance and user satisfaction. Ex-
amples include choices between user, system, or
mixed initiative, and between explicit and implicit
confirmation of user commands. An ideal system
wouldn't make such choices a priori, but rather
would adapt to the circumstances at hand. For in-
stance, a system detecting that a user is repeatedly
uncertain about what to say might move from user to
system initiative, and a system detecting that speech
recognition performance is poor might switch to
a dialogUe strategy with more explicit prompting,
an explicit confirmation mode, or keyboard input
mode. Any of these adaptations might have been
appropriate in dialogue D1 from the Annie sys-
tem (Kamm et al., 1998), shown in Figure 1.
In order to improve performance through such
adaptation, a system must first be able to identify, in
real time, salient properties of an ongoing dialogue
that call for some useful change in system strategy.
In other words, adaptive systems should try to auto-
matically identify actionable properties of ongoing
dialogues.
Previous work has shown that speech recognition
performance is an important predictor of user satis-
faction, and that changes in dialogue behavior im-
pact speech recognition performance (Walker et al.,
1998b; Litman et al., 1998; Kamm et al., 1998).
Therefore, in this work, we focus on the task of au-
tomatically detecting poor speech recognition per-
formance in several spoken dialogue systems devel-
oped at AT&T Labs. Rather than hand-crafting rules
that classify speech recognition performance in an
ongoing dialogue, we take a machine learning ap-
proach. We begin with a collection of system logs
from actual dialogues that were labeled by humans
as having had "good" or "bad" speech recognition
(the training set). We then apply standard machine
learning algorithms to this training set in the hope
of discovering, in a principled manner, classifiers
that can automatically detect poor speech recogni-
tion during novel dialogues.
In order to train such classifiers, we must provide
them with a number of "features" of dialogues de-
rived from the system logs that might allow the sys-
tem to automatically identify poor recognition per-
formance. In addition to identifying features that
provide the best quantitative solutions, we are also
interested in comparing the performance of classi-
fiers derived solely from acoustic features or from
"high-level" dialogue features, and from combina-
tions of these and other feature types. Note that we
are free to invent as many features as we like, as
long as they can be computed in real time from the
raw system logs.
Since the dialogue systems we examine use au-
tomatic speech recognition (ASR), one obvious fea-
ture available in the system log is a per-utterance
score from the speech recognizer representing its
"confidence" in its interpretation of the user's utter-
ance (Zeljkovic, 1996). For dialogue D1, the recog-
nizer's output and the associated confidence scores
309
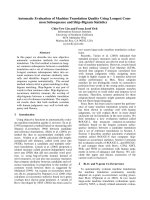
Actual Dialogue
AI: Annie here.
U1: Hello Annie, could you give me the information on a meeting I have tomorrow?
A2: What was that?
U2: I need to find out uh, a meeting time and place. Kim sent me a message on it.
A3: For all options say help me out.
U3: Help me out.
A4: Annie here.
U4: Help.
A5: Help. Say call or say send a message, followed by a label or a number.
Or say get my messages
U5: Get messages.
(user interrupts A5)
A6: Speech and Image Processing Lab.
U6: Help.
A7: Help. Say the first and last name
U7: Kim.
ASR Interpretation ASR Confidence
REJECT -4.84
REJECT -4.20
REJECT -6.35
help - 1.74
get me sips -3.33
help - 1.78
annie -3.81
Figure 1: Example dialogue excerpt D1 with Annie.
are in the last two columns of Figure 1. These con-
fidence measures are based on the recognizer's lan-
guage and acoustic models. The confidence scores
are typically used by the system to decide whether
it believes it has correctly understood the user's ut-
terance. When the confidence score falls below a
threshold defined for each system, the utterance is
considered a rejection (e.g., utterances U1, U2, and
U3 in D1). Note that since our classification prob-
lem is defined by speech recognition performance,
it might be argued that this confidence feature (or
features derived from it) suffices for accurate classi-
fication.
However, an examination of the transcript in D1
suggests that other useful features might be derived
from global or high-level properties of the dialogue
history, such as features representing the system's
repeated use of diagnostic error messages (utter-
ances A2 and A3), or the user's repeated requests
for help (utterances U4 and U6).
Although the work presented here focuses ex-
clusively on the problem of automatically
detecting
poor speech recognition, a solution to this problem
clearly suggests system
reaction,
such as the strat-
egy changes mentioned above. In this paper, we re-
port on our initial experiments, with particular at-
tention paid to the problem definition and method-
ology, the best performance we obtain via a machine
learning approach, and the performance differences
between classifiers based on acoustic and higher-
level dialogue features.
2 Systems, Data, Methods
The learning experiments that we describe here
use the machine learning program RIPPER (Co-
hen, 1996) to automatically induce a "poor speech
recognition performance" classification model from
a corpus of spoken dialogues. 1 RIPPER (like other
learning programs, such as c5.0 and CART) takes
as input the names of a set of
classes
to be learned,
the names and possible values of a fixed set
of fea-
tures, training data
specifying the class and feature
values for each example in a training set, and out-
puts a
classification model
for predicting the class
of future examples from their feature representation.
In RIPPER, the classification model is learned using
greedy search guided by an information gain metric,
and is expressed as an ordered set of if-then rules.
We use RIPPER for our experiments because it sup-
ports the use of "set-valued" features for represent-
ing text, and because if-then rules are often easier
for people to understand than decision trees (Quin-
lan, 1993). Below we describe our corpus of dia-
logues, the assignment of classes to each dialogue,
the extraction of features from each dialogue, and
our learning experiments.
Corpus: Our corpus consists of a set of 544 di-
alogues (over 40 hours of speech) between humans
and one of three dialogue systems: ANNIE (Kamm
et al., 1998), an agent for voice dialing and mes-
saging; ELVIS (Walker et al., 1998b), an agent
for accessing email; and TOOT (Litman and Pan,
1999), an agent for accessing online train sched-
ules. Each agent was implemented using a general-
purpose platform for phone-based spoken dialogue
systems (Kamm et al., 1997). The dialogues were
obtained in controlled experiments designed to eval-
uate dialogue strategies for each agent. The exper-
~We also ran experiments using the machine learning pro-
gram BOOSTEXTER (Schapire and Singer, To appear), with re-
sults similar to those presented below.
310
iments required users to complete a set of applica-
tion tasks in conversations with a particular version
of the agent. The experiments resulted in both a dig-
itized recording and an automatically produced sys-
tem log for each dialogue.
Class Assignment:
Our corpus is used to con-
struct the machine learning classes as follows. First,
each utterance that was not rejected by automatic
speech recognition (ASR) was manually labeled as
to whether it had been semantically misrecognized
or not. 2 This was done by listening to the record-
ings while examining the corresponding system log.
If the recognizer's output did not correctly capture
the task-related information in the utterance, it was
labeled as a misrecognition. For example, in Fig-
ure 1 U4 and U6 would be labeled as correct recog-
nitions, while U5 and U7 would be labeled as mis-
recognitions. Note that our labeling is semantically
based; if U5 had been recognized as "play mes-
sages" (which invokes the same application com-
mand as "get messages"), then U5 would have been
labeled as a correct recognition. Although this la-
beling needs to be done manually, the labeling is
based on objective criteria.
Next, each dialogue was assigned a class of ei-
ther good or bad, by thresholding on the percentage
of user utterances that were labeled as ASR seman-
tic misrecognitions. We use a threshold of 11% to
balance the classes in our corpus, yielding 283 good
and 261 bad dialogues. 3 Our classes thus reflect rel-
ative goodness with respect to a corpus. Dialogue
D1 in Figure 1 would be classified as "bad", be-
cause U5 and U7 (29% of the user utterances) are
misrecognized.
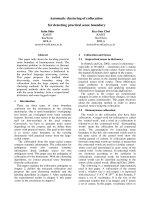
Feature Extraction:
Our corpus is used to con-
struct the machine learning features as follows.
Each dialogue is represented in terms of the 23
primitive features in Figure 2. In RIPPER, fea-
ture values are continuous (numeric), set-valued, or
symbolic. Feature values were automatically com-
puted from system logs, based on five types of
knowledge sources: acoustic, dialogue efficiency,
dialogue quality, experimental parameters, and lexi-
cal. Previous work correlating misrecognition rate
with acoustic information, as well as our own
2These utterance labelings were produced during a previous
set of experiments investigating the performance evaluation of
spoken dialogue systems (Walker et al., 1997; Walker et al.,
1998a; Walker et al., 1998b; Kamm et al., 1998; Litman et al.,
1998; Litman and Pan, 1999).
3This threshold is consistent with a threshold inferred from
human judgements (Litman, 1998).
• Acoustic Features
-mean confidence, pmisrecs%l, pmisrecs%2, pmis-
recs%3, pmisrecs%4
• Dialogue Efficiency Features
- elapsed time, system turns, user turns
• Dialogue Quality Features
- rejections, timeouts, helps, cancels, bargeins (raw)
- rejection%, timeout%, help%, cancel%, bargein% (nor-
malized)
• Experimental Parameters Features
- system, user, task, condition
• Lexical Features
- ASR text
Figure 2: Features for spoken dialogues.
hypotheses about the relevance of other types of
knowledge, contributed to our features.
The acoustic, dialogue efficiency, and dialogue
quality features are all numeric-valued. The acous-
tic features are computed from each utterance's
confidence (log-likelihood) scores (Zeljkovic,
1996). Mean confidence represents the average
log-likelihood score for utterances not rejected dur-
ing ASR. The four pmisrecs% (predicted percent-
age of misrecognitions) features represent differ-
ent (coarse) approximations to the distribution of
log-likelihood scores in the dialogue. Each pmis-
recs% feature uses a fixed threshold value to predict
whether a non-rejected utterance is actually a mis-
recognition, then computes the percentage of user
utterances in the dialogue that correspond to these
predictedmisrecognitions. (Recall that our dialogue
classifications were determined by thresholding on
the percentage of actual misrecognitions.) For in-
stance, pmisrecs%1 predicts that if a non-rejected
utterance has a confidence score below -2 then it
is a misrecognition. Thus in Figure 1, utterances U5
and U7 would be predicted as misrecognitions using
this threshold. The four thresholds used for the four
pmisrecs% features are -2,-3,-4,-5, and were
chosen by hand from the entire dataset to be infor-
mative.
The dialogue efficiency features measure how
quickly the dialogue is concluded, and include
elapsed time (the dialogue length in seconds), and
system turns and user turns (the number of turns for
each dialogue participant).
311
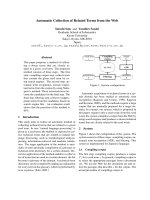
mean confidence pmisrecs%1 pmisrecs%2 pmisrecs%3 pmisrecs%4 elapsed time system turns user turns
-2.7 29 29 0 0 300 7 7
rejections timeouts helps cancels bargeins rejection% timeout% help%
3 0 2 0 1 43 0 29
cancel% bargein% system user task condition
0 14 annie mike day 1 novices without tutorial
ASR text
REJECT REJECT REJECT help get me sips help annie
Figure 3: Feature representation of dialogue D1.
The dialogue quality features attempt to capture
aspects of the naturalness of the dialogue.
Rejec-
tions
represents the number of times that the sys-
tem plays special rejection prompts, e.g., utterances
A2 and A3 in dialogue D1. This occurs whenever
the ASR confidence score falls below a threshold
associated with the ASR grammar for each system
state (where the threshold was chosen by the system
designer). The
rejections
feature differs from the
pmisrecs%
features in several ways. First, the
pmis-
recs%
thresholds are used to determine misrecogni-
tions rather than rejections. Second, the
pmisrecs%
thresholds are fixed across all dialogues and are not
dependent on system state. Third, a system rejection
event directly influences the dialogue via the rejec-
tion prompt, while the
pmisrecs%
thresholds have
no corresponding behavior.
Timeouts
represents the number of times that the
system plays special timeout prompts because the
user hasn't responded within a pre-specified time
frame.
Helps
represents the number of times that the
system responds to a user request with a (context-
sensitive) help message.
Cancels
represents the
number of user's requests to undo the system's pre-
vious action.
Bargeins
represents the number of
user attempts to interrupt the system while it is
speaking. 4 In addition to raw counts, each feature
is represented in normalized form by expressing the
feature as a percentage. For example,
rejection%
represents the number of rejected user utterances di-
vided by the total number of user utterances.
In order to test the effect of having the maxi-
mum amount of possibly relevant information avail-
able, we also included a set of features describ-
ing the experimental parameters for each dialogue
(even though we don't expect rules incorporating
such features to generalize). These features capture
the conditions under which each dialogue was col-
4Since the system automatically detects when a bargein oc-
curs, this feature could have been automatically logged. How-
ever, because our system did not log bargeins, we had to hand-
label them.
lected. The experimental parameters features each
have a different set of user-defined symbolic values.
For example, the value of the feature
system
is either
"annie", "elvis", or "toot", and gives RIPPER the op-
tion of producing rules that are system-dependent.
The lexical feature
ASR text
is set-valued, and
represents the transcript of the user's utterances as
output by the ASR component.
Learning Experiments:
The final input for
learning is training data, i.e., a representation of a
set of dialogues in terms of feature and class values.
In order to induce classification rules from a variety
of feature representations our training data is rep-
resented differently in different experiments. Our
learning experiments can be roughly categorized as
follows. First, examples are represented using all of
the features in Figure 2 (to evaluate the optimal level
of performance). Figure 3 shows how Dialogue
D1 from Figure 1 is represented using all 23 fea-
tures. Next, examples are represented using only the
features in a single knowledge source (to compara-
tively evaluate the utility of each knowledge source
for classification), as well as using features from
two or more knowledge sources (to gain insight into
the interactions between knowledge sources). Fi-
nally, examples are represented using feature sets
corresponding to hypotheses in the literature (to em-
pirically test theoretically motivated proposals).
The output of each machine learning experiment
is a classification model learned from the training
data. To evaluate these results, the error rates of the
learned classification models are estimated using
the resampling method of
cross-validation
(Weiss
and Kulikowski, 1991). In 25-fold cross-validation,
the total set of examples is randomly divided into
25 disjoint test sets, and 25 runs of the learning pro-
gram are performed. Thus, each run uses the exam-
pies not in the test set for training and the remain-
ing examples for testing. An estimated error rate is
obtained by averaging the error rate on the testing
portion of the data from each of the 25 runs.
312
Features Used Accuracy (Standard Error)
BASELINE 52%
REJECTION%
54.5 % (2.0)
EFFICIENCY 61.0 % (2.2)
EXP-PARAMS 65.5 % (2.2)
DIALOGUE QUALITY (NORMALIZED)
65.9 % (1.9)
MEAN CONFIDENCE
68.4 % (2.0)
EFFICIENCY + NORMALIZED QUALITY
69.7 % (1.9)
ASR TEXT
72.0 % (1.7)
PMISRECS%3
72.6 % (2.0)
EFFICIENCY + QUALITY + EXP-PARAMS
73.4 % (1.9)
ALL FEATURES 77.4 % (2.2)
Figure 4: Accuracy rates for dialogue classifiers using different feature sets, 25-fold cross-validation on 544
dialogues. We use SMALL CAPS to indicate feature sets, and
ITALICS
to indicate primitive features listed in
Figure 2.
3 Results
Figure 4 summarizes our most interesting experi-
mental results. For each feature set, we report accu-
racy rates and standard errors resulting from cross-
validation. 5 It is clear that performance depends on
the features that the classifier has available. The
BASELINE accuracy rate results from simply choos-
ing the majority class, which in this case means pre-
dicting that the dialogue is always "good". This
leads to a 52% BASELINE accuracy.
The REJECTION%
accuracy rates arise from a
classifier that has access to the percentage of dia-
logue utterances in which the system played a re-
jection message to the user. Previous research sug-
gests that this acoustic feature predicts misrecogni-
tions because users modify their pronunciation in
response to system rejection messages in such a way
as to lead to further misunderstandings (Shriberg et
al., 1992; Levow, 1998). However, despite our ex-
pectations, the
REJECTION%
accuracy rate is not
better than the BASELINE at our desired level of sta-
tistical significance.
Using the EFFICIENCY features does improve the
performance of the classifier significantly above the
BASELINE (61%). These features, however, tend
to reflect the particular experimental tasks that the
users were doing.
The EXP-PARAMS (experimental parameters)
features are even more specific to this dialogue
corpus than the efficiency features: these features
consist of the name of the system, the experimen-
5Accuracy rates are statistically significantly different when
the accuracies plus or minus twice the standard error do not
overlap (Cohen, 1995), p. 134.
tal subject, the experimental task, and the experi-
mental condition (dialogue strategy or user exper-
tise). This information alone allows the classifier
to substantially improve over the BASELINE clas-
sifter, by identifying particular experimental condi-
tions (mixed initiative dialogue strategy, or novice
users without tutorial) or systems that were run with
particularly hard tasks (TOOT) with bad dialogues,
as in Figure 5. Since with the exception of the ex-
perimental condition these features are specific to
this corpus, we wouldn't expect them to generalize.
if (condition = mixed) then bad
if (system = toot) then bad
if (condition = novices without tutorial) then bad
default is good
Figure 5: EXP-PARAMS rules.
The normalized DIALOGUE QUALITY features
result in a similar improvement in performance
(65.9%). 6 However, unlike the efficiency and ex-
perimental parameters features, the normalization
of the dialogue quality features by dialogue length
means that rules learned on the basis of these fea-
tures are more likely to generalize.
Adding the efficiency and normalized quality fea-
ture sets together
(EFFICIENCY +
NORMALIZED
QUALITY) results in a significant performance im-
provement (69.7%) over EFFICIENCY alone. Fig-
ure 6 shows that this results in a classifier with
three rules: one based on quality alone (per-
centage of cancellations), one based on efficiency
6The normalized versions of the quality features did better
than the raw versions.
313
alone (elapsed time), and one that consists of a
boolean combination of efficiency and quality fea-
tures (elapsed time and percentage of rejections).
The learned ruleset says that if the percentage of
cancellations is greater than 6%, classify the dia-
logue as bad; if the elapsed time is greater than 282
seconds, and the percentage of rejections is greater
than 6%, classify it as bad; if the elapsed time is less
than 90 seconds, classify it as badT; otherwise clas-
sify it as good. When multiple rules are applicable,
RIPPER resolves any potential conflict by using the
class that comes first in the ordering; when no rules
are applicable, the default is used.
if
(cancel% > 6)
then
bad
if
(elapsed time > 282 secs) A (rejection% > 6)
then
bad
if (elapsed time < 90 secs)
then
bad
default is
good
for the MEAN CONFIDENCE classifier (68.4%) is
not statistically different than that for the PMIS-
RECS%3 classifier. Furthermore, since the feature
does not rely on picking an optimal threshold, it
could be expected to better generalize to new dia-
logue situations.
The classifier trained on (noisy) ASR lexical out-
put (ASR TEXT) has access only to the speech rec-
ognizer's interpretation of the user's utterances. The
ASR TEXT classifier achieves 72% accuracy, which
is significantly better than the BASELINE, REJEC-
TION% and EFFICIENCY classifiers. Figure 7 shows
the rules learned from the lexical feature alone. The
rules include lexical items that clearly indicate that
a user is having trouble e.g. help and cancel. They
also include lexical items that identify particular
tasks for particular systems, e.g. the lexical item
p-m identifies a task in TOOT.
Figure 6:
EFFICIENCY + NORMALIZED QUALITY
rules.
We discussed our acoustic REJECTION% results
above, based on using the rejection thresholds that
each system was actually run with. However, a
posthoc analysis of our experimental data showed
that our systems could have rejected substantially
more misrecognitions with a rejection threshold that
was lower than the thresholds picked by the sys-
tem designers. (Of course, changing the thresh-
olds in this way would have also increased the num-
ber of rejections of correct ASR outputs.) Re-
call that the PMISRECS% experiments explored the
use of different thresholds to predict misrecogni-
tions. The best of these acoustic thresholds was
PMISRECS%3, with accuracy 72.6%. This classi-
fier learned that if the predicted percentage of mis-
recognitions using the threshold for that feature was
greater than 8%, then the dialogue was predicted to
be bad, otherwise it was good. This classifier per-
forms significantly better than the BASELINE, RE-
JECTION% and EFFICIENCY classifiers.
Similarly, MEAN CONFIDENCE is another
acoustic feature, which averages confidence scores
over all the non-rejected utterances in a dialogue.
Since this feature is not tuned to the applications,
we did not expect it to perform as well as the best
PMISRECS% feature. However, the accuracy rate
7This rule indicates dialogues
too
short for the user
to
have
completed the task. Note that this role could not be applied
to adapting the system's behavior during the course of the dia-
logue.
if (ASR text contains cancel)
then
bad
if
(ASR text contains the) A (ASR text contains get) A (ASR text
contains
TIMEOUT)
then
bad
if (ASR text contains today) ^ (ASR text contains on)
then
bad
if
(ASR text contains the) A (ASR text contains p-m)
then
bad
if (ASR text contains to)
then
bad
if (ASR text
contains help) ^ (ASR text contains the) ^ (ASR text
contains read)
then
bad
if
(ASR text contains help) A (ASR text contains previous)
then
bad
if
(ASR text contains about)
then
bad
if (ASR text contains
change-s trategy)
then
bad
default is
good
Figure 7: ASR TEXT rules.
Note that the performance of many of the classi-
fiers is statistically indistinguishable, e.g. the per-
formance of the ASR TEXT classifier is virtually
identical to the classifier PMISRECS%3 and the
EF-
FICIENCY
+ QUALITY + EXP-PARAMS
classifier.
The similarity between the accuracies for a range
of classifiers suggests that the information provided
by different feature sets is redundant. As discussed
above, each system and experimental condition re-
suited in dialogues that contained lexical items that
were unique to it, making it possible to identify ex-
perimental conditions from the lexical items alone.
Figure 8 shows the rules that RIPPER learned when
it had access to all the features except for the lexical
and acoustic features. In this case, RIPPER learns
some rules that are specific to the TOOT system.
Finally, the last row of Figure 4 suggests that a
classifier that has access to ALL FEATURES may do
better (77.4% accuracy) than those classifiers that
314
if (cancel% > 4) ^ (system = toot) then
bad
if (system turns _> 26) ^ (rejection% _> 5 )
then
bad
if
(condition = mixed) ^ (user turns > 12 ) then
bad
if
(system = toot)/x (user turns > 14 ) then
bad
if
(cancels > 1) A (timeout% _> 11 ) then
bad
if (elapsed time _< 87 secs)
then
bad
default is
good
Figure 8:
EFFICIENCY + QUALITY + EXP-PARAMS
rules.
have access to acoustic features only (72.6%) or to
lexical features only (72%). Although these dif-
ferences are not statistically significant, they show
a trend (p < .08). This supports the conclusion
that different feature sets provide redundant infor-
mation, and could be substituted for each other to
achieve the same performance. However, the ALL
FEATURES classifier does perform significantly bet-
ter than the EXP-PARAMS, DIALOGUE QUALITY
(NORMALIZED), and
MEAN CONFIDENCE
clas-
sifiers. Figure 9 shows the decision rules that the
ALL FEATURES classifier learns. Interestingly, this
classifier does not find the features based on experi-
mental parameters to be good predictors when it has
other features to choose from. Rather it combines
features representing acoustic, efficiency, dialogue
quality and lexical information.
if
(mean confidence _< -2.2) ^ (pmisrecs%4 _> 6 ) then
bad
if
(pmisrecs%3 >_ 7 ) A (ASR text contains yes) A (mean confidence
_< -1.9) then
bad
if (cancel% _> 4) then
bad
if (system turns _> 29 ) ^ (ASR text contains message) then
bad
if
(elapsed time <_ 90) then
bad
default is
good
Figure 9: ALL FEATURES rules.
4 Discussion
The experiments presented here establish several
findings. First, it is possible to give an objective def-
inition for poor speech recognition at the dialogue
level, and to apply machine learning to build clas-
sifiers detecting poor recognition solely from fea-
tures of the system log. Second, with appropri-
ate sets of features, these classifiers significantly
outperform the baseline percentage of the majority
class. Third, the comparable performance of clas-
sifiers constructed from rather different feature sets
(such as acoustic and lexical features) suggest that
there is some redundancy between these feature sets
(at least with respect to the task). Fourth, the fact
that the best estimated accuracy was achieved using
all of the features suggests that even problems that
seem inherently acoustic may best be solved by ex-
ploiting higher-level information.
This work differs from previous work in focusing
on behavior at the (sub)dialogue level, rather than
on identifying single misrecognitions at the utter-
ance level (Smith, 1998; Levow, 1998; van Zanten,
1998). The rationale is that a single misrecognition
may not warrant a global change in dialogue strat-
egy, whereas a user's repeated problems communi-
cating with the system might warrant such a change.
While we are not aware of any other work that has
applied machine learning to detecting patterns sug-
gesting that the user is having problems over the
course of a dialogue, (Levow, 1998) has applied
machine learning to identifying single misrecogni-
tions. We are currently extending our feature set
to include acoustic-prosodic features such as those
used by Levow, in order to predict misrecognitions
at both the dialogue level as well as the utterance
level.
We are also interested in the extension and gen-
eralization of our findings in a number of additional
directions. In other experiments, we demonstrated
the utility of allowing the user to dynamically adapt
the system's dialogue strategy at any point(s) during
a dialogue. Our results show that dynamic adapta-
tion clearly improves system performance, with the
level of improvement sometimes a function of the
system's initial dialogue strategy (Litman and Pan,
1999). Our next step is to incorporate classifiers
such as those presented in this paper into a system
in order to support dynamic adaptation according to
recognition performance. Another area for future
work would be to explore the utility of using alter-
native methods for classifying dialogues as good or
bad. For example, the user satisfaction measures we
collected in a series of experiments using the PAR-
ADISE evaluation framework (Walker et al., 1998c)
could serve as the basis for such an alternative clas-
sification scheme. More generally, in the same way
that learning methods have found widespread use in
speech processing and other fields where large cor-
pora are available, we believe that the construction
and analysis of spoken dialogue systems is a ripe
domain for machine learning applications.
5 Acknowledgements
Thanks to J. Chu-Carroll, W. Cohen, C. Kamm, M.
Kan, R. Schapire, Y. Singer, B. Srinivas, and S.
315
Whittaker for help with this research and/or paper.
References
Paul R. Cohen. 1995.
Empirical Methods for Arti-
ficial Intelligence.
MIT Press, Boston.
William Cohen. 1996. Learning trees and rules
with set-valued features. In
14th Conference of
the American Association of Artificial Intelli-
gence, AAAI.
C. Kamm, S. Narayanan, D. Dutton, and R. Rite-
nour. 1997. Evaluating spoken dialog systems
for telecommunication services. In
5th European
Conference on Speech Technology and Commu-
nication, EUROSPEECH 97.
Candace Kamm, Diane Litman, and Marilyn A.
Walker. 1998. From novice to expert: The ef-
fect of tutorials on user expertise with spoken di-
alogue systems. In
Proceedings of the Interna-
tional Conference on Spoken Language Process-
ing, ICSLP98.
Gina-Anne Levow. 1998. Characterizing and rec-
ognizing spoken corrections in human-computer
dialogue. In
Proceedings of the 36th Annual
Meeting of the Association of Computational Lin-
guistics, COLING/ACL 98,
pages 736-742.
Diane J. Litman and Shimei Pan. 1999. Empirically
evaluating an adaptable spoken dialogue system.
In
Proceedings of the 7th International Confer-
ence on User Modeling (UM).
Diane J. Litman, Shimei Pan, and Marilyn A.
Walker. 1998. Evaluating Response Strategies in
a Web-Based Spoken Dialogue Agent. In
Pro-
ceedings of ACL/COLING 98: 36th Annual Meet-
ing of the Association of Computational Linguis-
tics,
pages 780-787.
Diane J. Litman. 1998. Predicting speech recog-
nition performance from dialogue phenomena.
Presented at the American Association for Arti-
ficial Intelligence Spring Symposium Series on
Applying Machine Learning to Discourse Pro-
cessing.
J. Ross Quinlan. 1993.
C4.5: Programs for Ma-
chine Learning.
San Mateo, CA: Morgan Kauf-
mann.
Robert E. Schapire and Yoram Singer. To appear.
Boostexter: A boosting-based system for text cat-
egorization.
Machine Learning.
Elizabeth Shriberg, Elizabeth Wade, and Patti Price.
1992. Human-machine problem solving using
spoken language systems (SLS): Factors affect-
ing performance and user satisfaction. In
Pro-
316
ceedings of the DARPA Speech and NL Workshop,
pages 49-54.
Ronnie W. Smith. 1998. An evaluation of strate-
gies for selectively verifying utterance meanings
in spoken natural language dialog.
International
Journal of Human-Computer Studies,
48:627-
647.
G. Veldhuijzen van Zanten. 1998. Adaptive mixed-
initiative dialogue management. Technical Re-
port 52, IPO, Center for Research on User-
System Interaction.
Marilyn Walker, Donald Hindle, Jeanne Fromer,
Giuseppe Di Fabbrizio, and Craig Mestel. 1997.
Evaluating competing agent strategies for a voice
email agent.
In Proceedings of the European
Conference on Speech Communication and Tech-
nology, EUROSPEECH97.
M. Walker, J. Fromer, G. Di Fabbrizio, C. Mestel,
and D. Hindle. 1998a. What can I say: Evaluat-
ing a spoken language interface to email. In
Pro-
ceedings of the Conference on Computer Human
Interaction ( CH198).
Marilyn A. Walker, Jeanne C. Fromer, and
Shrikanth Narayanan. 1998b. Learning optimal
dialogue strategies: A case study of a spoken
dialogue agent for email. In
Proceedings of the
36th Annual Meeting of the Association of Com-
putational Linguistics, COLING/ACL 98,
pages
1345-1352.
Marilyn. A. Walker, Diane J. Litman, Candace. A.
Kamm, and Alicia Abella. 1998c. Evaluating
spoken dialogue agents with PARADISE: Two
case studies.
Computer Speech and Language,
12(3).
S. M. Weiss and C. Kulikowski. 1991.
Computer
Systems That Learn: Classification and Predic-
tion Methods from Statistics, Neural Nets, Ma-
chine Learning, and Expert Systems.
San Mateo,
CA: Morgan Kaufmann.
Ilija Zeljkovic. 1996. Decoding optimal state se-
quences with smooth state likelihoods. In
Inter-
national Conference on Acoustics, Speech, and
Signal Processing, ICASSP 96,
pages 129-132.